0295
Differences in temporal cerebrovascular reactivity responses between patients with atherosclerotic and non-atherosclerotic intracranial disease: implications for optimal hypercapnic reactivity experiments1Radiology and Radiological Sciences, Vanderbilt University Medical Center, Nashville, TN, United States, 2Neurological Surgery, Vanderbilt University Medical Center, Nashville, TN, United States
Synopsis
Intracranial stenosis may be due to atherosclerotic or idiopathic non-atherosclerotic mechanisms, and each condition may incur different consequences on cerebral hemodynamics. The purpose of this study was to use a time regression analysis approach applied to hypercapnic BOLD fMRI data to evaluate how cerebrovascular reactivity (CVR) timing and maximum CVR may differ between patient groups and with vasculopathy extent. Time-to-maximum CVR may be lengthened in territories supplied by stenotic vessels in both patient groups; however, maximum CVR may be reduced on average only in patients with non-atherosclerotic disease, potentially indicating that arteriolar smooth muscle and/or endothelial function may differ substantially between conditions.
Introduction
Intracranial arterial stenosis represents a major stroke risk factor1 and can be due to atherosclerotic plaque, or moyamoya disease, which is a non-atherosclerotic and frequently idiopathic progressive narrowing of intracranial vessels2. Both conditions cause a reduction in cerebral perfusion pressure (CPP), resulting in autoregulatory increases in parenchymal cerebral blood volume (CBV) to compensate. However, such compensation is not unlimited; as CBV approaches maximal capacity or arteriolar smooth muscle becomes dysfunctional, the ability of the microvasculature to respond to further changes in CPP or vasodilatory stimuli is impaired. This ability can be evaluated in vivo using cerebrovascular reactivity (CVR)-weighted approaches, in which fMRI data are acquired with hypercapnic stimuli. Recently, time regression CVR analysis approaches have been proposed, which allow for decomposition of the composite CVR response into maximum CVR (CVRMAX) and time-to-maximum CVR (CVRDELAY)3. The purpose of this study was to quantify CVR, CVRMAX, and CVRDELAY separately in patients with atherosclerosis and moyamoya to examine whether differences in CVRDELAY may bias conventional measures of CVR.Methods
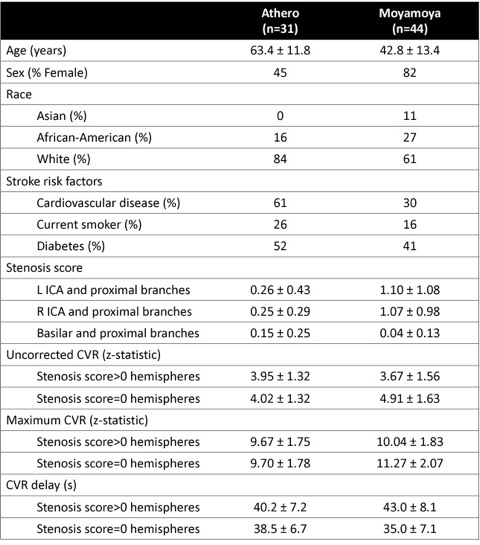
Study participants. Patients with intracranial atherosclerosis (n=31) or moyamoya disease (n=44) and >50% stenosis of a major intracranial vessel (intracranial ICA, or first segment of the ACA, PCA, or MCA; intracranial vertebral or basilar artery) were scanned at 3.0T (Philips) within 30 days of stroke or TIA. All participants provided informed written consent. Demographic information is summarized in Table 1.
Experiment. Respiratory challenge-weighted blood-oxygenation-level-dependent (BOLD; TR/TE=2000/30ms; spatial resolution=3x3x4mm3) MRI data were acquired with alternating blocks of room air (180s) and hypercapnia (180s) to measure the CVR-weighted response. Anatomical MR imaging, including T1-weighted and T2-weighted FLAIR, were performed for infarct determination and co-registration. Digital subtraction angiography (DSA) or computed tomography angiography (CTA) were performed for vasculopathy assessment within 30 days of MRI.
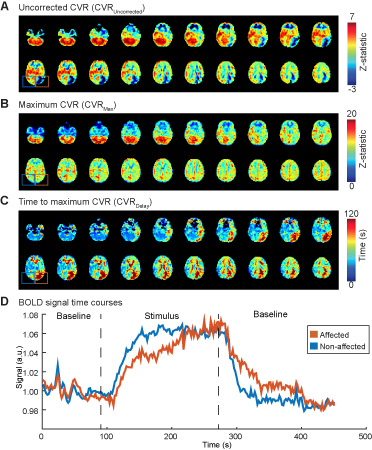
Analysis. First, BOLD MRI data were analyzed using a conventional approach, where the stimulus paradigm was applied as the regressor to qualitatively assess CVR (uncorrected CVR; z-statistic). Second, a more novel time regression approach was applied3, where the regressor was progressed in time, and maximum correlation (CVRMAX; z-statistic) and time-to-maximum correlation (CVRDELAY; seconds) were separately quantified (Figure 2). Stenosis was graded by a board-certified radiologist in each major intracranial vessel as none (score=0; stenosis<49%), mild (score=1; 50%≤stenosis<70%), severe (score=2; 70%≤stenosis<99%), or occluded (score=3; stenosis=100%). Mean images of uncorrected CVR, CVRMAX, and CVRDELAY were calculated from vessels with different categorical stenosis scores.
Results
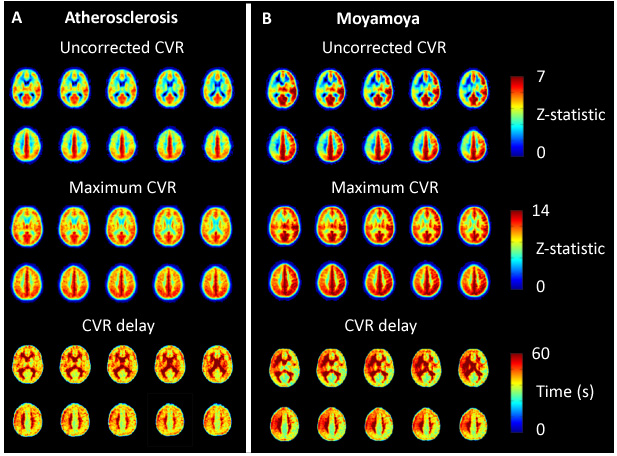
A summary of demographic and imaging findings is shown in Table 1. In atherosclerosis patients, the regions with stenosis score>0 appeared to exhibit (i) reduced uncorrected CVR and lengthened CVRDELAY relative to regions without stenosis, but CVRMAX appears unchanged unchanged between these regions (Figure 3A). In moyamoya patients, the hemispheres with stenosis score>0 displayed reduced uncorrected CVR, reduced CVRMAX, and lengthened CVRDELAY compared with the less impaired hemispheres (Figure 3B). The mean CVRDELAY range was 35-43s, consistent with the requirement that vasoactive response times can be much longer than simple blood arrival times in patients with cerebrovascular disease.Discussion
We utilized noninvasive MR methods to show that maximum CVR may be differentially affected in regions supplied by stenotic vessels in moyamoya patients but not in atherosclerosis patients, while CVR delay may be lengthened in both groups. As such, in patients with atherosclerotic disease, the time to maximum reactivity, but not cerebrovascular reserve itself, may be impaired. This work also has implications for CVR-weighted mapping in cerebrovascular disease more broadly. For instance, experiments that use short hypercapnic stimuli or ramped stimuli with short durations (e.g., less than 40-50s) may suffer from artifacts related to delayed reactivity compliance times. This analysis could underestimate true cerebrovascular reserve capacity or, in extreme cases, even indicate apparent negative cerebrovascular reserve, which has been interpreted as paradoxical “vascular steal phenomena”. Such regions may indeed be hemodynamically important, but the mechanism of impairment appears to frequently originate from timing differences rather than reserve exhaustion alone.Acknowledgements
No acknowledgement found.References
1. Holmstedt CA, Turan TN, Chimowitz MI. Atherosclerotic intracranial arterial stenosis: Risk factors, diagnosis, and treatment. Lancet Neurol. 2013;12:1106-1114
2. Bang OY, Toyoda K, Arenillas JF, Liu L, Kim JS. Intracranial large artery disease of non-atherosclerotic origin: Recent progress and clinical implications. J Stroke. 2018;20:208-217
3. Donahue MJ, Strother MK, Lindsey KP, Hocke LM, Tong Y, Frederick BD. Time delay processing of hypercapnic fmri allows quantitative parameterization of cerebrovascular reactivity and blood flow delays. J Cereb Blood Flow Metab. 2015
Figures