0292
Mean Transit Time and Capillary Transit Time Heterogeneity at the Basal Ganglia of Patients with Huntington’s Disease1Massachusetts General Hospital, Athinoula A. Martinos Center for Biomedical Imaging, Charlestown, MA, United States, 2Radiology, Massachusetts General Hospital, Harvard Medical School, Boston, MA, United States, 3Neurology, Massachusetts General Hospital, Harvard Medical School, Boston, MA, United States
Synopsis
We identified abnormally long mean transit time (MTT) and large capillary transit time heterogeneity (CTH) in the basal ganglia of ten individuals with Huntington’s disease (HD) as compared to ten healthy control subjects. Since iron is elevated in the putamen and globus pallidus in HD [1], which can lead to an underestimation of relative cerebral blood flow (CBF) and cerebral blood volume (CBV), excessively prolonged MTT and CTH, which are ratios of CBV and CBF, could be utilized as relatively intact parameters for the estimation of perfusion deficits or breakdown in blood-brain barrier.
PURPOSE:
We sought to evaluate perfusion deficits and capillary dysfunction, given the vulnerability of the basal ganglia in HD, by measuring MTT and CTH as indicators of such perfusion deficits.METHODS:
Ten participants with HD and ten healthy control subjects were recruited for perfusion MRI.Imaging was performed on 3T Siemens MRI systems. T2-weighted (T2SPACE) and T1-weighted (MPRAGE) images were acquired followed by dynamic susceptibility enhanced (DSC) MRI with a bolus injection of Gd. Temporal resolution is 1.5 – 1.8 s. In-plane resolution is 1.7 – 2 mm and slice thickness is 2.4 – 3 mm.
DSC-MRI data were processed by using Penguin/pgui software (Center for Functionally Integrative Neuroscience, Aarhus University, Denmark) [2]. Arterial input function (AIF) from middle cerebral artery branches was selected by the software based on cluster analysis of voxel-wise dynamic curves [3]. MTT was computed via the central volume theorem by CBV from the integration of dynamic curve and CBF from residue function after singular value decomposition of the AIF. CTH was estimated by the standard deviation of the transit time distribution measured as the time derivative of the residue function [4-6]. The parametric maps were registered to MPRAGE images in DSC space. Regions of interest (ROIs) of the whole brain including basal ganglia and white matter were parcellated by using Freesurfer software [7]. Mean and standard deviation from those selected ROIs were used for statistical analysis.
RESULTS:
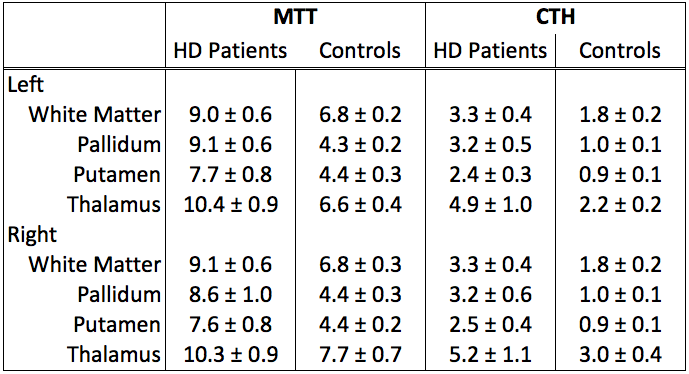
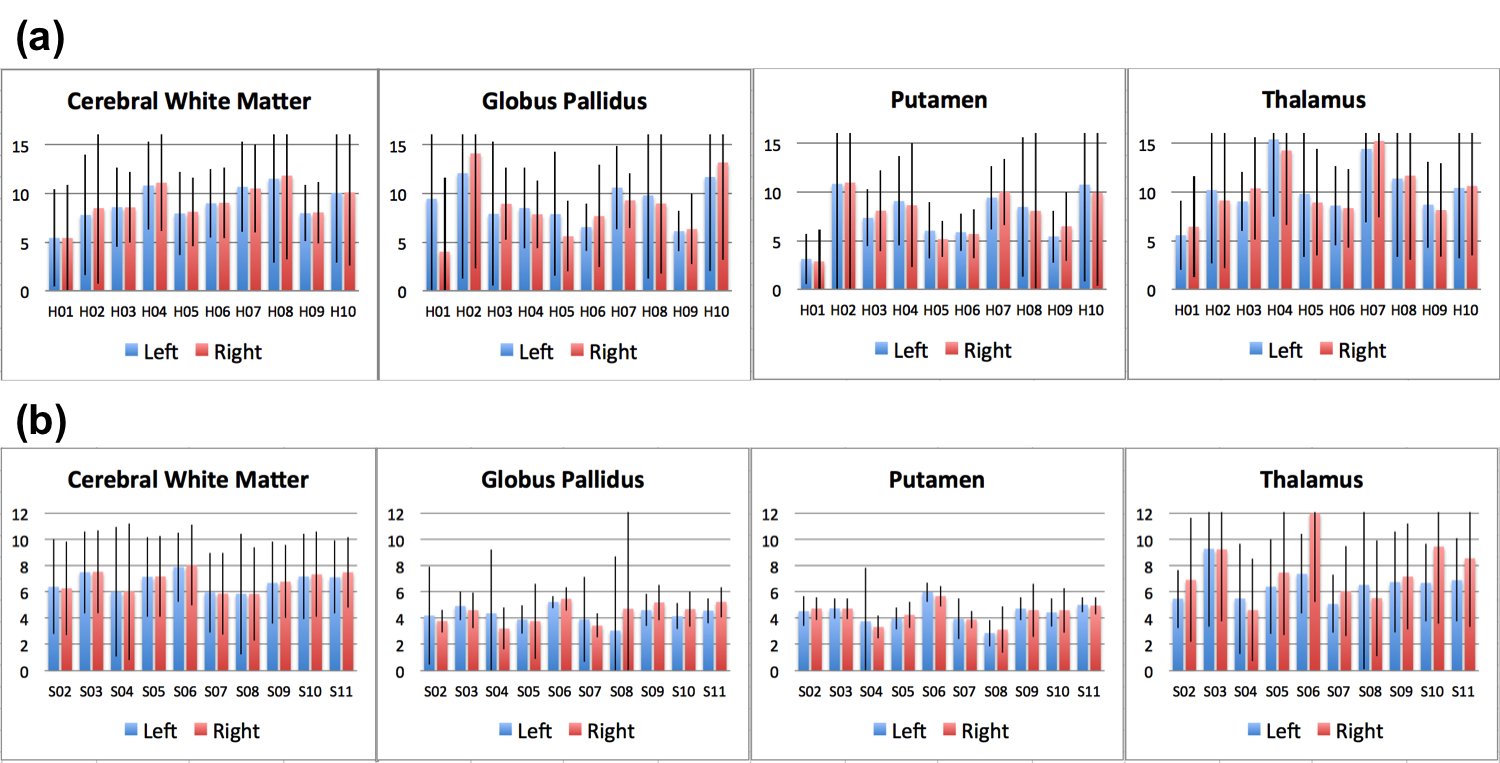
The mean and standard error of MTT and CTH from the cerebral white matter, globus pallidus, putamen, and thalamus are summarized in Table 1. The left and right hemispheres have consistent MTT and CTH values. Overall, HD participants demonstrated higher MTT and CTH than healthy controls. The quality of the MTT and CTH maps is demonstrated in Figure 1, where elevated MTT and CTH in HD participants compared to healthy controls are present in the basal ganglia and white matter. Relative to the individual subject's white matter, perfusion impairments as ascertained by an abnormally long MTT and large CTH in the putamen and globus pallidus of HD participants are illustrated in Figure 2(a) and Figure 3(a), respectively. MTT and CTH of healthy control subjects (Figure 2(b) and Figure 3(b), respectively) did showed significantly lower values in both regions. It is worth mentioning that patients H04 and H07 who have distinctively elevated CTH in thalamus are in more advanced stages of HD.DISCUSSION AND CONCLUSION:
We report significantly prolonged MTT and CTH in individuals with HD. We were unfortunately not able to evaluate MTT and CTH of caudate, given the significant caudate atrophy present in our HD cohort.
The vascular model employed in this analysis [5] extended the relation between blood supply and oxygen availability in tissue to take into account the distribution of blood across the capillary bed [8]. MTT is the ratio between CBV and CBF and, therefore, reflects capillary density and blood supply, whereas CTH reflects capillary function, which limits the efficacy of oxygen extraction from blood [8]. Homogenization (i.e. small CTH) of capillary transit times during increasing blood flow (i.e. small MTT) reflects compliant microvascular network. Compromised blood brain barrier may cause heterogeneous blood flow and inefficient oxygen extraction, which are reflected in the elevated MTT and CTH [9]. In summary, our results suggest that MTT and CTH may serve as imaging biomarkers of the perfusion deficits and capillary dysfunction of HD.
Acknowledgements
We appreciate the financial support from NIH R01NS042861 and helps from Research Assistants Paul Wilkens, Matt Linnehan, and Eugene Hsu as well as Research Coordinators Lois Kwon, Sue Imbriglio, and Keith Malarick.References
1. Rosas, et al. Arch Neurol. 2012; 69(7): 887–893.
2. Penguin, http://www.cfin.au.dk/penguin
3. Mouridsen, Christensen, Gydensted, Østergaard. MRM 2006; 55:524–531.
4. Mouridsen, Friston, Hjort, Gyldensted, Østergaard, Kiebel. NeuroImage 2006; 33:570–579.
5. Jespersen and Østergaard. JCBFM 2012; 32:264–277.
6. Mouridsen, Hansen, Østergaard, Jespersen. JCBFM 2014; 34:1511–1521.
7. Destrieux, Fischl, Dale, Halgren. NeuroImage 2010; 53:1-15. http://surfer.nmr.mgh.harvard.edu
8. Nielsen, et al. Alzheimer’s & Dementia 2017; 13:1143-1153.
9. Eskildsen, et al. Neurobiology of Aging 2017; 50:107-118.
Figures