0291
Cerebral hypometabolism measured with intravascular T2-prepared tissue relaxation with inversion recovery (T2-TRIR) and pCASL in adults with sickle cell disease1Department of Radiology & Nuclear Medicine, Amsterdam UMC, Amsterdam, Netherlands, 2C.J. Gorter Center for High Field MRI, Department of Radiology, Leiden University Medical Center, Leiden, Netherlands, 3Danish Research Centre for Magnetic Resonance, Copenhagen University Hospital Hvidovre, Copenhagen, Denmark, 4Helmholtz-Zentrum Dresden-Rossendorf, Institute of Radiopharmaceutical Cancer Research, Dresden, Germany, 5Department of Cardiology and Radiology, Children’s Hospital of Los Angeles, Los Angeles, CA, United States, 6Department of Biomedical Engineering & Physics, Amsterdam UMC, Amsterdam, Netherlands, 7Department of Hematology, Amsterdam UMC, Amsterdam, Netherlands
Synopsis
Cerebral metabolic rate of oxygen (CMRO2) quantifies the amount of oxygen consumed by the brain, and relies on continuous delivery of nutrients and oxygen via cerebral blood flow (CBF). In sickle cell disease (SCD), CBF is elevated to compensate for chronic anaemia. This study investigates CMRO2 in adults with SCD using T2-prepared tissue relaxation with inversion recovery (T2-TRIR). CBF increased after acetazolamide-induced vasodilation in both groups but CMRO2 reduced even further in SCD patients while it remained stable in controls. Our results suggest that cerebral shunting is exacerbated by high flow conditions.
Introduction
Cerebral metabolic rate of oxygen (CMRO2) quantifies the amount of oxygen consumed by the brain, and relies on continuous cerebral blood flow (CBF) for nutrients and oxygen. In sickle cell disease (SCD), CBF is elevated to compensate chronic anaemia (low haemoglobin), but is associated with reduced flow reserve capacity and increased vessel dilation(1,2), potentially exhausting autoregulation. Inadequate CBF can result in ischaemic lesions(3), particularly in borderzone regions(4,5). We tested the hypothesis that adults with SCD have impaired cerebral oxygenation under various flow conditions, by measuring the CMRO2 response to acetazolamide, an isometabolic vasodilator.Methods
Participants: 38 adults with sickle cell disease (SCD) and 11 matched controls were included after IRB approval and informed consent, and underwent a venous blood draw to measure haemoglobin. After baseline scans, 16mg/kg acetazolamide (dissolved in 20 mL saline) was administered intravenously and scans were repeated after 15 min.
Imaging: Images were acquired at 3T (Philips Ingenia) using a 32-channel receive head-coil. Venous T1 and T2 was measured by T2- prepared tissue relaxation with inversion recovery (T2-TRIR)(6,7), consisting of a slab-selective frequency offset corrected inversion (FOCI) pulse, a T2 preparation, and 2D single slice single-shot FFE EPI Look-locker read-out, and the following parameters: FOV 202x243mm, 1.69x1.69x4mm voxels, TR/TE 150/24ms, four T2 weightings resulting in eTEs of 0, 40, 80, and 160ms, corresponding to 0, 4, 8 and 16 refocusing pulses in the MLEV T2-preparation, interpulse spacing of tCPMG=10ms, TI1 10ms, ∆TI 130ms, 4 dynamic scans, flip angle 95°, and total scan duration of 50sec. For lesions we acquired a 3D FLAIR sequence (FOV 250x250x180 mm, 1mm isotropic voxels, TR/TE 4800/356ms). For CBF, we acquired a 2D gradient-echo single-shot EPI pCASL and M0 with the following parameters: FOV 240x240x133mm, 3x3x7mm voxels, 19 slices, TR/TE 4400/14ms, background suppression, flip angle 90°, PLD 1800ms, labelling duration 1800ms, and total scan duration 20min, where the first 5min and last 5min (each 35 dynamics) were used for pre and post-acetazolamide conditions.
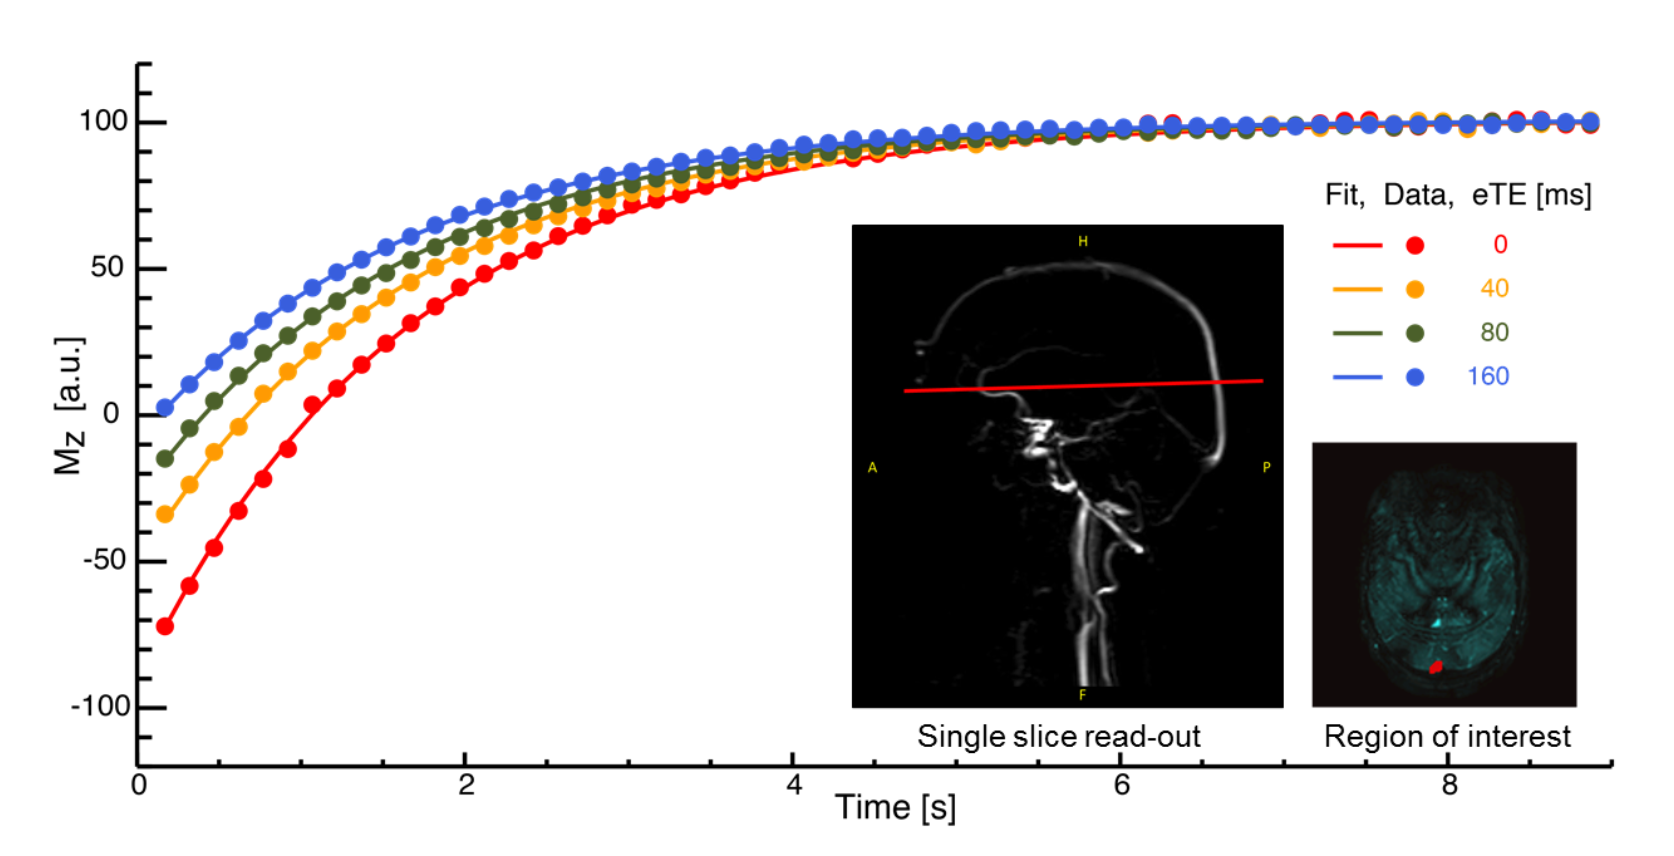
Analysis: A region-of-interest was automatically detected in the sagittal sinus of T2-TRIR images and masked to all time-points (Figure 1). T2 was converted to venous saturation (Yv) using a recently developed calibration plot describing the relationship between T2, haematocrit and Yv for human SCD blood(9). Lesions were manually delineated on FLAIR and co-registered to CBF using SPM in ExploreASL(8). Whole-brain CBF was quantified with a dual compartment model(10) incorporating subject-specific T1 values, velocity-corrected labelling efficiency(11), and arterial transit time(12). Oxygen extraction fraction (OEF%) was calculated by (Ya-Yv)/Yv x 100. Arterial saturation (Ya) was assumed (98%). Oxygen delivery (mL O2/min) was calculated by CBF x CaO2, where the oxygen carrying capacity (CaO2) was calculated by (Hb x 1.34 x SaO2) + (0.003 x pO2). Using Fick’s principle, we calculated CMRO2 (μmol O2/100g/min) = CBF x OEF x CaO2, where CaO2 was converted to molar units. Parametric tests were used to assess changes from pre to post-acetazolamide conditions (Tables 1 and 2).
Results
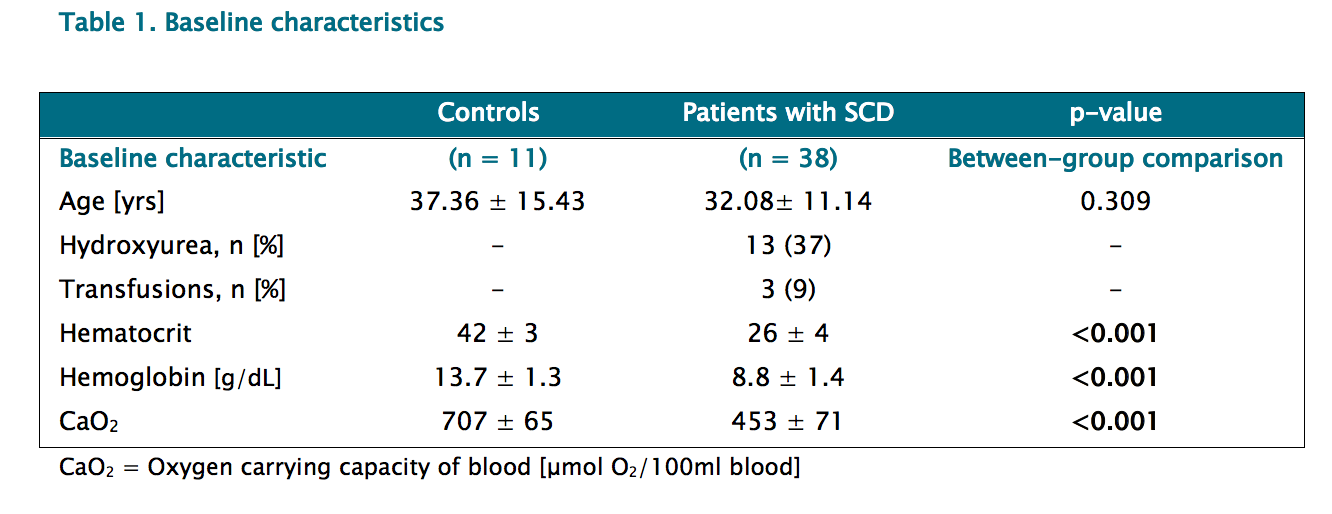
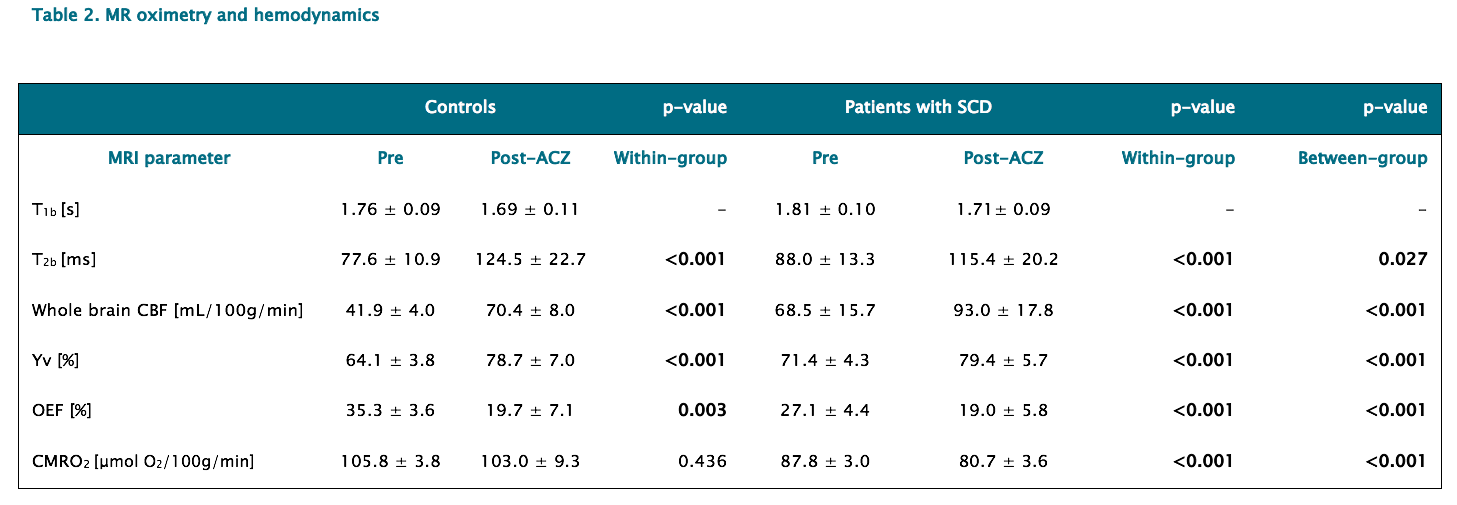
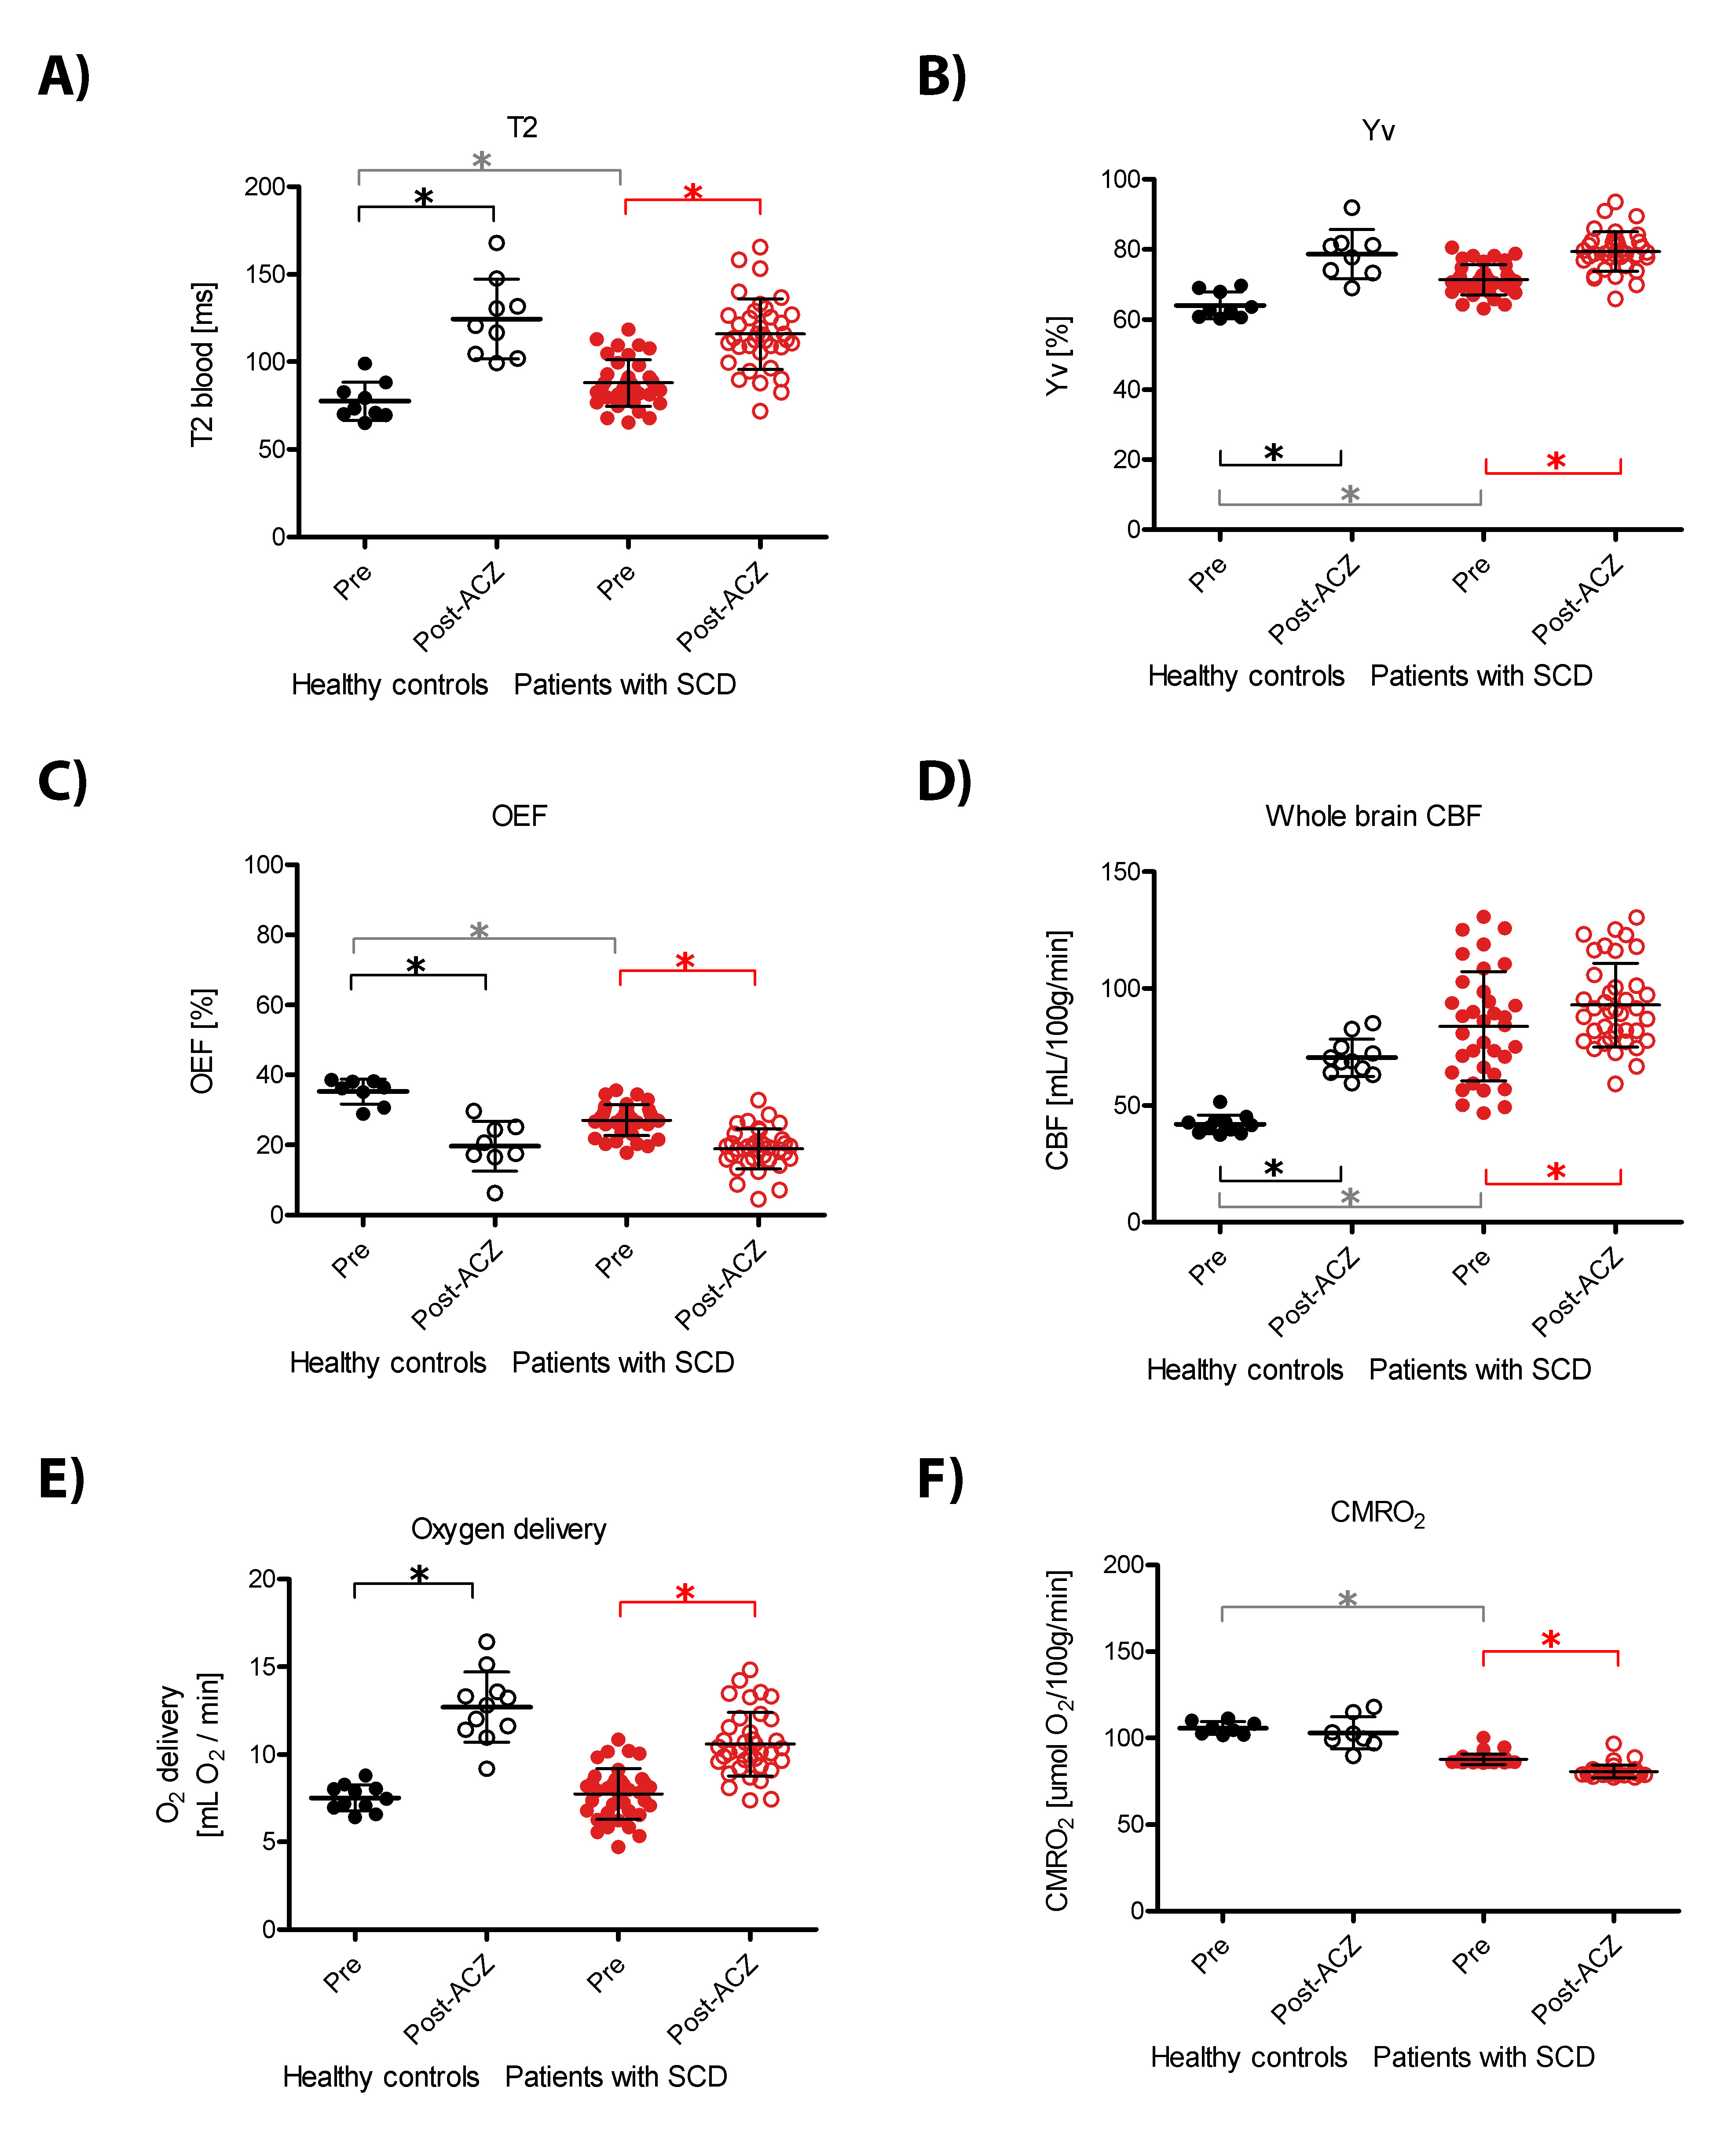
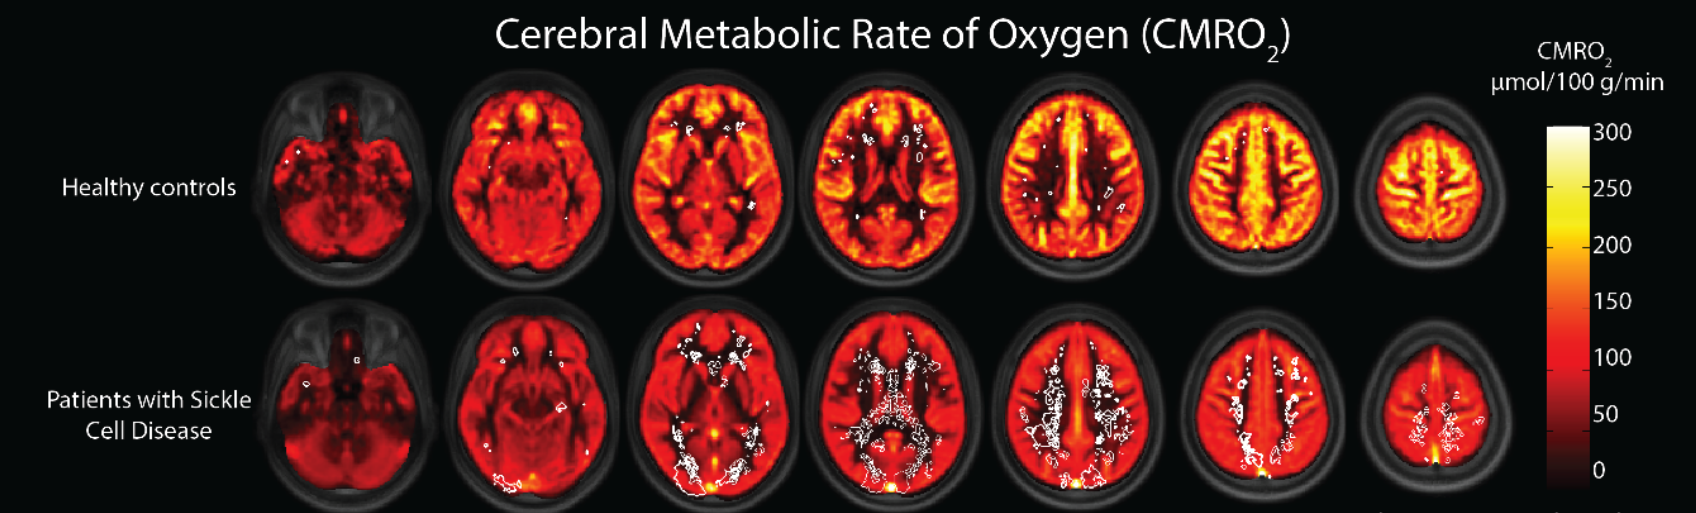
Baseline: CaO2 was lower in patients with SCD compared to controls (453±71 vs 707±65 μmol O2/100ml blood, P<0.001) due to low haemoglobin. We found no difference in oxygen delivery between patients with SCD and controls (7.7±1.4 vs 7.5±0.7 mL O2/min, P=0.62) due to appropriately elevated whole brain CBF in patients with SCD compared to controls (68.5±15.7 vs 41.9±4.0 mL/100g/min, P<0.001). CMRO2 was however lower in patients with SCD compared to controls (87.8±3.0 vs 105.8±3.8 μmol O2/100g/min, P<0.001). WM lesions were located in regions of low CBF and/or low CMRO2 (Figure 3). Acetazolamide(Figure 2): As expected, CBF increased in both groups after acetazolamide. CMRO2 reduced even further in patients with SCD (87.8±3.0 to 80.7±3.6 μmol O2/100g/min, P<0.001), but in controls remained stable (105.8±3.8 to 103.0±9.3 μmol O2/100g/min, P=0.436), indicating sufficient autoregulation in controls but not in patients. Indeed, the increase in CBF was accompanied by a significant drop in OEF in SCD patients (27.1±4.4 to 19.0±5.8%, P<0.001) and controls (35.3±3.6 to 19.7±7.1%, P=0.003), demonstrating that reductions in OEF are associated with increased CBF.Discussion
We found normal oxygen delivery and reduced CMRO2 in adults with SCD. Cerebral metabolism in SCD may have adapted to chronic low oxygen levels or autoregulation was unable to compensate the mismatch between CBF and OEF. Interestingly, the reduced CMRO2 in adults with SCD(9) declined further after acetazolamide, which may suggest that cerebral shunting is present in SCD(9,13) and is exacerbated by high flow conditions(14). CMRO2 could be useful to monitor response to new drugs in clinical trials targeting oxygen affinity or for clinical assessments to identify patients at risk for ischaemia.Acknowledgements
No acknowledgement found.References
(1) Nur, Erfan, Yu-Sok Kim, Jasper Truijen, Eduard J van Beers, Shyrin C a T Davis, Dees P Brandjes, Bart J Biemond, and Johannes J van Lieshout. 2009. “Cerebrovascular Reserve Capacity Is Impaired in Patients with Sickle Cell Disease.” Blood 114 (16): 3473–78.
(2) Václavů, Lena, Henri JMM Mutsaerts, Esben Thade Petersen, Ed T VanBavel, John C Wood, Charles BL Majoie, Aart J Nederveen, and Bart J Biemond. 2017. “Reduced Cerebrovascular Reserve Capacity in Adults with Sickle Cell Disease.” Blood 130 (Suppl 1): 972.
(3) Dowling, MM, CT Quinn, P Plumb, ZR Rogers, N Rollins, K Koral, R Barber, and GR Buchanan. 2012. “Acute Silent Cerebral Infarction Occurs during Acute Anemic Events in Children with and without Sickle Cell Disease.” Blood 120 (19): 3891–97
(4) Ford, Andria L, Dustin K Ragan, Slim Fellah, Michael M Binkley, Melanie E Fields, P Guilliams, Hongyu An, et al. 2018. “Silent Infarcts in Sickle Cell Anemia Occur in the Borderzone Region and Are Associated with Low Cerebral Blood Flow.” Blood, no. 314
(5) Fields, Melanie E., Kristin P. Guilliams, Dustin K. Ragan, Michael M. Binkley, Cihat Eldeniz, Yasheng Chen, Monica L. Hulbert, et al. 2018. “Regional Oxygen Extraction Predicts Border Zone Vulnerability to Stroke in Sickle Cell Disease.” Neurology.
(6) De Vis, J B, E T Petersen, T Alderliesten, F Groenendaal, L S de Vries, F van Bel, M J N L Benders, and J Hendrikse. 2014. “Non-Invasive MRI Measurements of Venous Oxygenation, Oxygen Extraction Fraction and Oxygen Consumption in Neonates.” NeuroImage 95 (July). Elsevier Inc.: 185–92.
(7) Petersen, Esben Thade, Jill De Vis, Thomas Alderliesten, Karina J Kersbergen, Manon Benders, Jeroen Hendrikse, and C.A.T. van den Berg. 2012. “Simultaneous OEF and Haematocrit Assessment Using T2 Prepared Blood Relaxation Imaging with Inversion Recovery.” In Proc. Intl. Soc. Mag. Reson. Med., 20:472.
(8) Mutsaerts, HJMM, J Petr, E Lysvik, A Schrantee, Z Shirzadi, F Zelaya, I Groote, et al. 2017. “ExploreASL: Image Processing Toolbox for Multi-Center Arterial Spin Labeling Population Analyses.” In 34th Annual Scientific Meeting of European Society for Magnetic Resonance in Medicine and Biology. Barcelona, Spain.
(9) Bush, Adam M, Thomas D Coates, and John C Wood. 2018. “Diminished Cerebral Oxygen Extraction and Metabolic Rate in Sickle Cell Disease Using T2 Relaxation under Spin Tagging MRI.” Magnetic Resonance in Medicine 80 (1): 294–303. doi:10.1002/mrm.27015.
(10) Wang, Jiongjiong, David C Alsop, Lin Li, John Listerud, Julio B Gonzalez-At, Mitchell D Schnall, and John a Detre. 2002. “Comparison of Quantitative Perfusion Imaging Using Arterial Spin Labeling at 1.5 and 4.0 Tesla.” Magnetic Resonance in Medicine: Official Journal of the Society of Magnetic Resonance in Medicine / Society of Magnetic Resonance in Medicine 48 (2): 242–54. doi:10.1002/mrm.10211.
(11) Vaclavu, Lena, Magdalena Sokolska, Aart Nederveen and David Thomas. 2018. “Accounting for pCASL labelling efficiency variation in patients with low and high arterial blood flow velocities.” In Proc. Intl. Soc. Mag. Reson. Med., 26:5530.
(12) Vaclavu, Lena, Moss Zhao, Esben Thade Petersen, John Wood, Henk Mutsaerts, Charles Majoie, Ed vanBavel, Bart Biemond, Michaell Chappell, and Aart Nederveen. 2018. “Adaptations in cerebral physiology due to chronic anaemia measured with Turbo-QUASAR ASL”. In Proc. Intl. Soc. Mag. Reson. Med., 26:0856.
(13) Juttukonda, Meher R., Manus J. Donahue, Larry T. Davis, Melissa C. Gindville, Chelsea A. Lee, Niral J. Patel, Adetola A. Kassim, Sumit Pruthi, Jeroen Hendrikse, and Lori C. Jordan. 2017. “Preliminary Evidence for Cerebral Capillary Shunting in Adults with Sickle Cell Anemia.” Journal of Cerebral Blood Flow and Metabolism.
(14) Rasmussen, Peter M., Sune N.
Jespersen, and Leif Østergaard. 2015. “The Effects of Transit Time
Heterogeneity on Brain Oxygenation during Rest and Functional Activation.”
Journal of Cerebral Blood Flow and Metabolism 35 (3): 432–42.
Figures