0289
The Quantification of Feuromxytol Uptake on the Post Enhance in Intracranial Atherosclerotic Plaque by using a 3D high resolution Black Blood(BB) Multiple Echo(ME) T2* Imaging Technique1UCAIR, Department of Radiology and Imaging Sciences, University of Utah, Salt Lake City, UT, United States, 2Siemens Healthcare, Salt Lake City, UT, United States, 3Department of Surgery, University of Utah, Salt Lake City, UT, United States, 4Department of Veterans Affairs, VASLCHCS, Salt Lake City, UT, United States, 5Department of Neurology, University of Utah, Salt Lake City, UT, United States
Synopsis
Post-gadoliniun enhancement(PGE) in ICAD may be related to endothelial dysfunction or breakdown or secondary to plaque inflammation. Delayed ferumoxytol imaging allows intravascular clearance with retention in the macrophages present in vulnerable atherosclerotic plaque. A 3D BB ME T2* Imaging technique allows the quantitative ferumoxytol imaging on delayed scans by measuring T2* in intracranial atherosclerotic plaque. We performed 3D BB T2* sequences on ten patients with ICAD and measured T2* changes between baseline and 72 hour after ferumoxytol injection. The iron nanoparticle uptake in symptomatic ICAD presented in this work may provide important mechanistic implications for the pathophysiology of PGE.
Purpose
Vessel wall MRI (vwMRI) has been used to detect vulnerable plaque features including post-gadoliniun enhancement (PGE) in intracranial atherosclerotic disease (ICAD), with stroke risk independent of stenosis1. In the carotid artery, plaque enhancement correlates with both inflammation and neovascularization2. PGE may be related to endothelial dysfunction or breakdown, leading to contrast leakage into the vessel wall or to plaque inflammation and recruitment of leaky plaque neovessels3,4. Previous studies found significantly more macrophages in the symptomatic ICAD. Ferumoxytol uptake by macrophages has been reported only in carotid atherosclerosis5,6. Delayed ferumoxytol imaging allows intravascular clearance with retention in the macrophages present in vulnerable atherosclerotic plaque7. We developed a 3D Black Blood (BB) Multi Echo (ME) T2* imaging technique to allow quantitative ferumoxytol uptake in intracranial atherosclerotic plaque by calculating T2*8.Methods
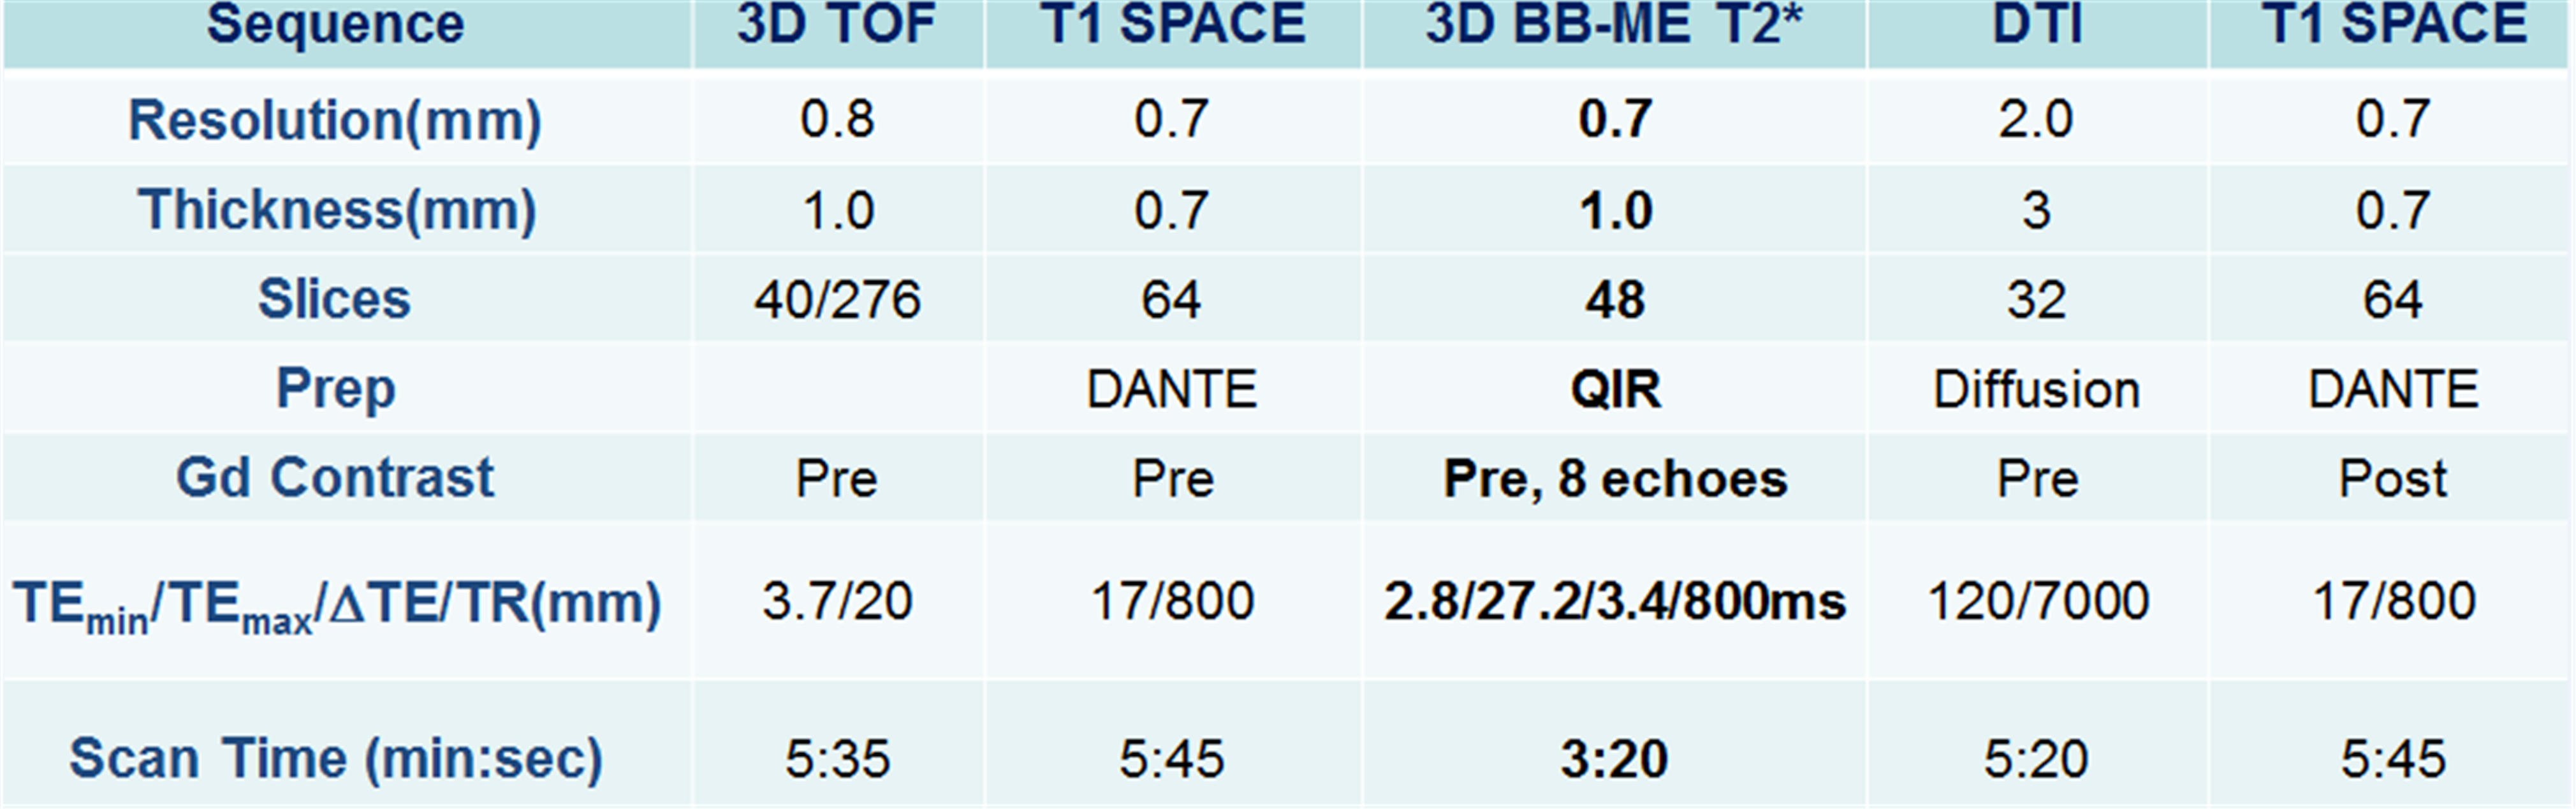
With IRB consent, we recruited ten stroke patients, four females and six males with age ranges from 39 to 80. All studies were performed on a Siemens Verio 3T MRI scanner with 20 channel head coil. To locate PGE in vessel wall, 3D T1w SPACE with DANTE preparation was performed. We found eight MCAs and four vertebra arteries that showed the post enhancement. 3D ME T2* images were acquired before (baseline) and 72 hours after ferumoxytol injection (delayed). Table 1 summarizes the protocol. Baseline and delayed T2* maps were calculated from the eight echo T2* images acquired from 3D ME T2* study. All images, including T2* maps, were registered to the PGE to to confirm overlap of the PGE and ferumoxytol uptake using by the custom software developed in Matlab.Results
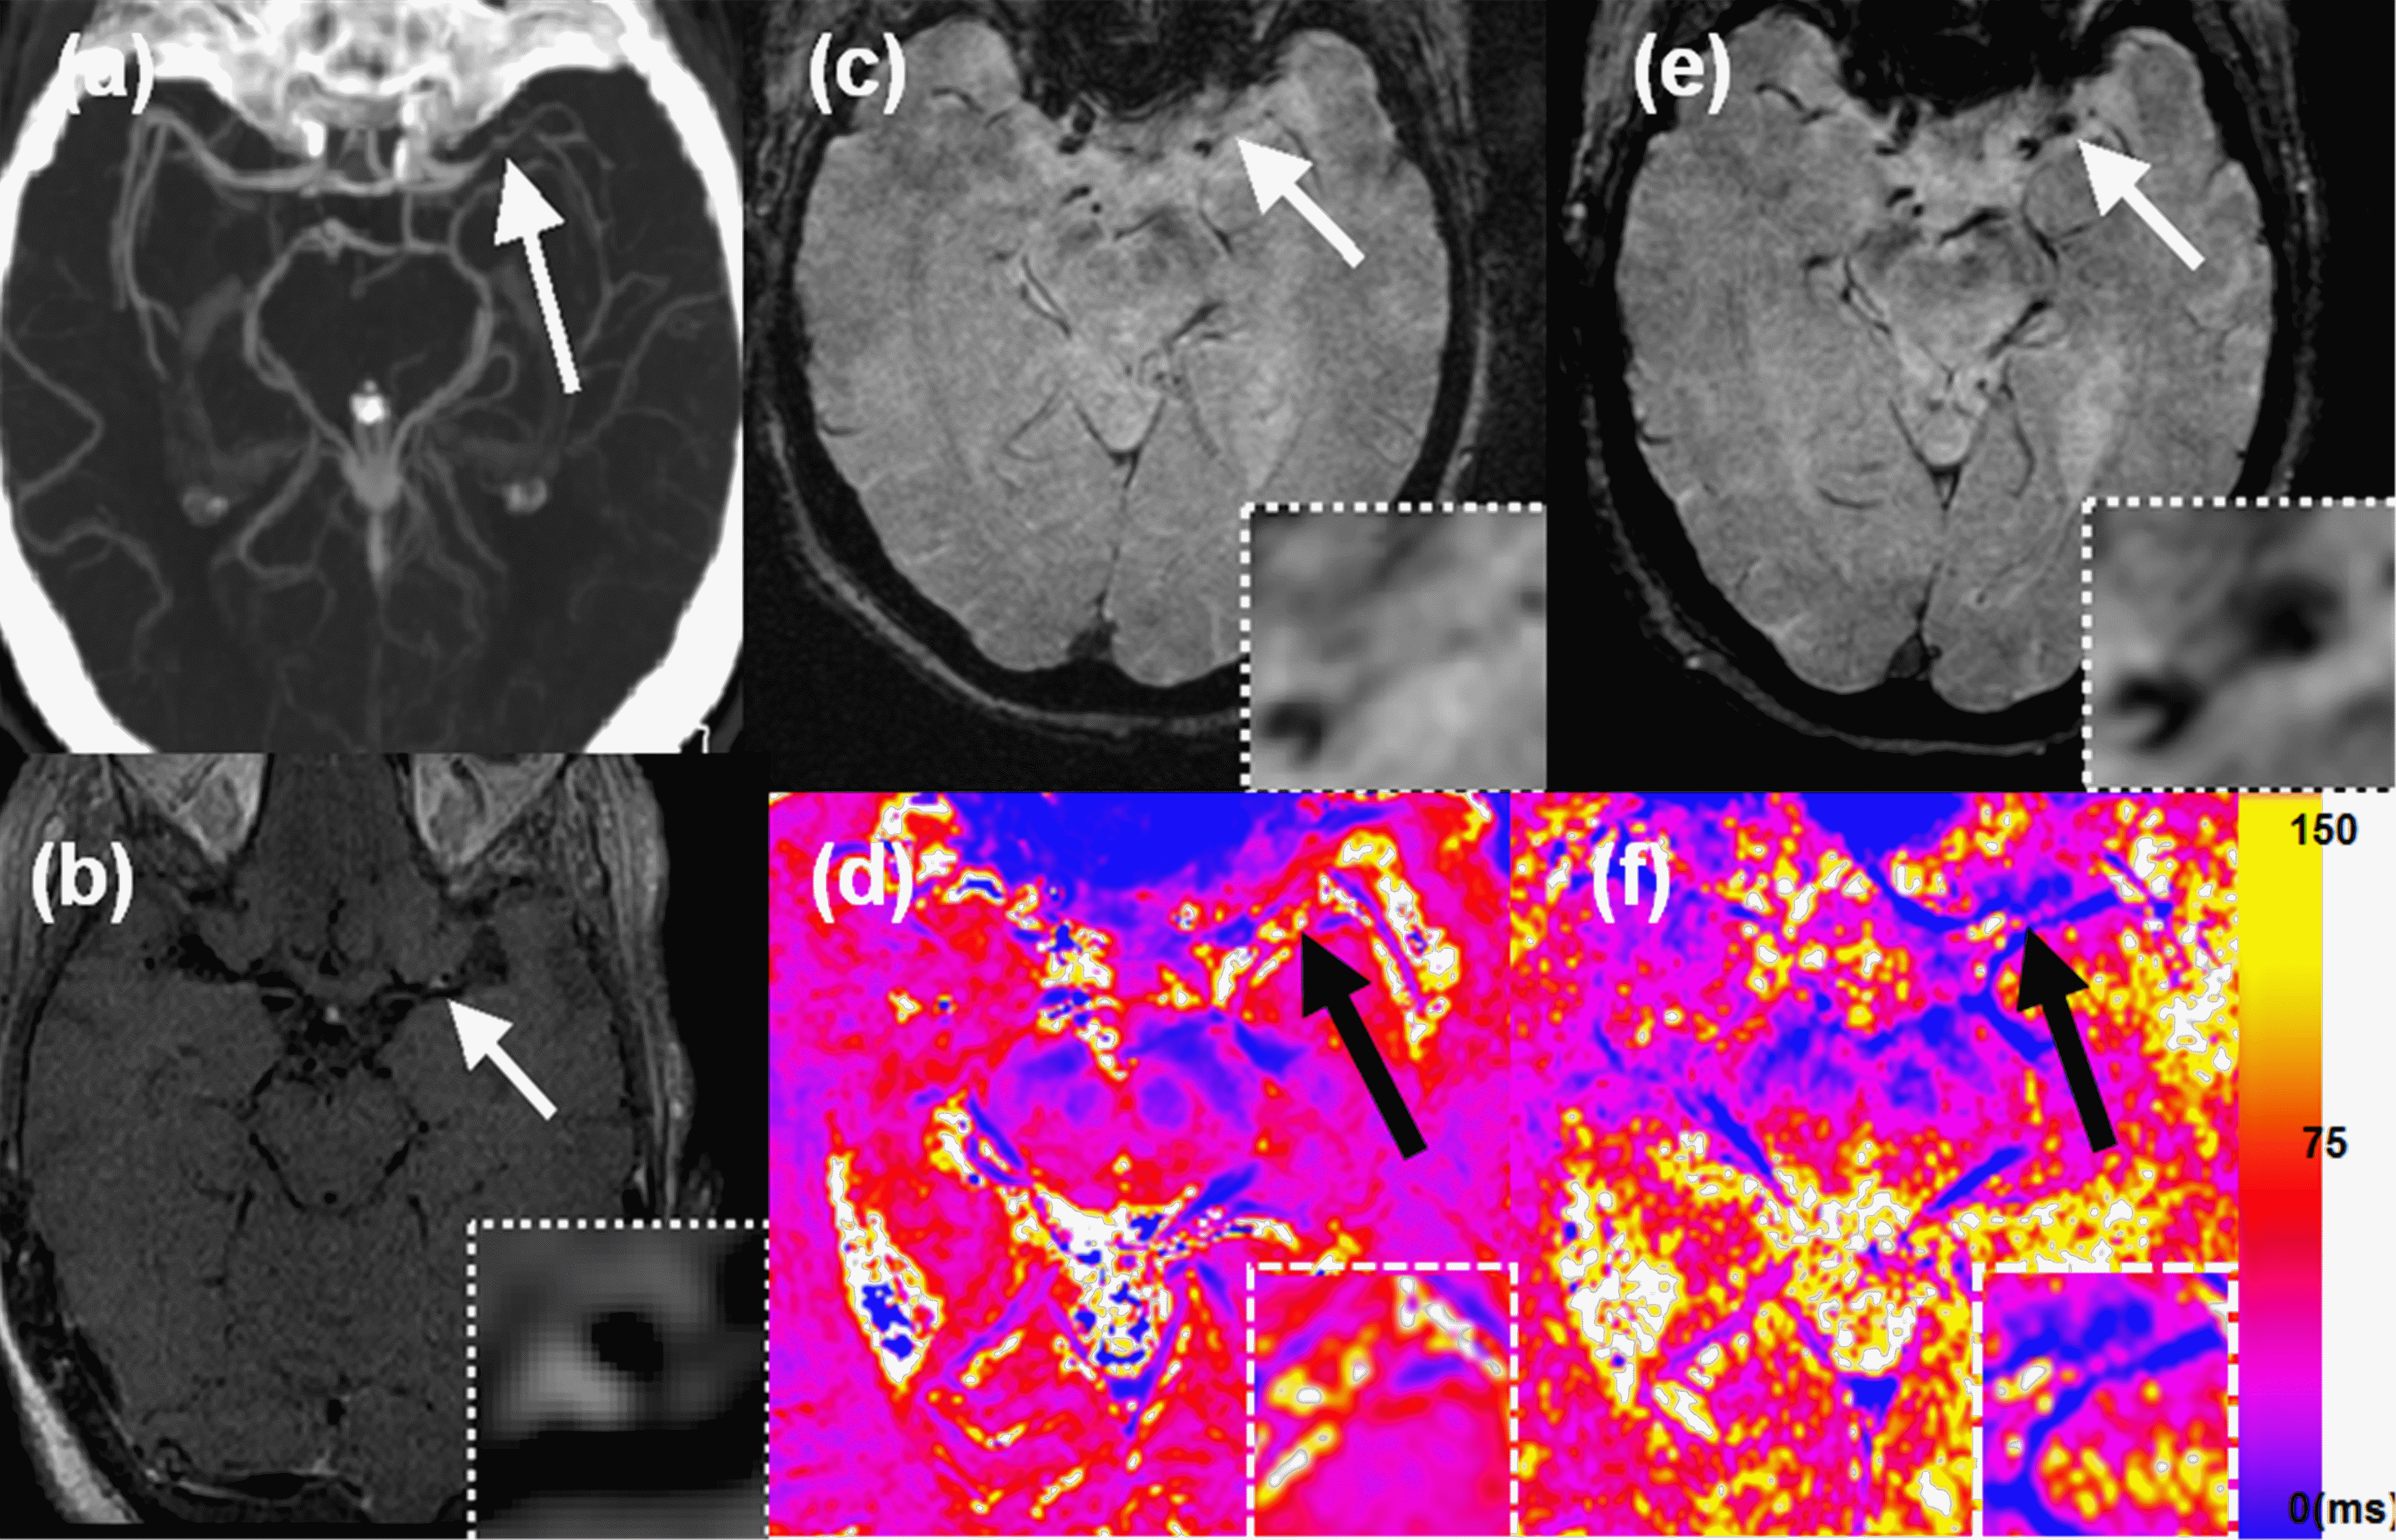
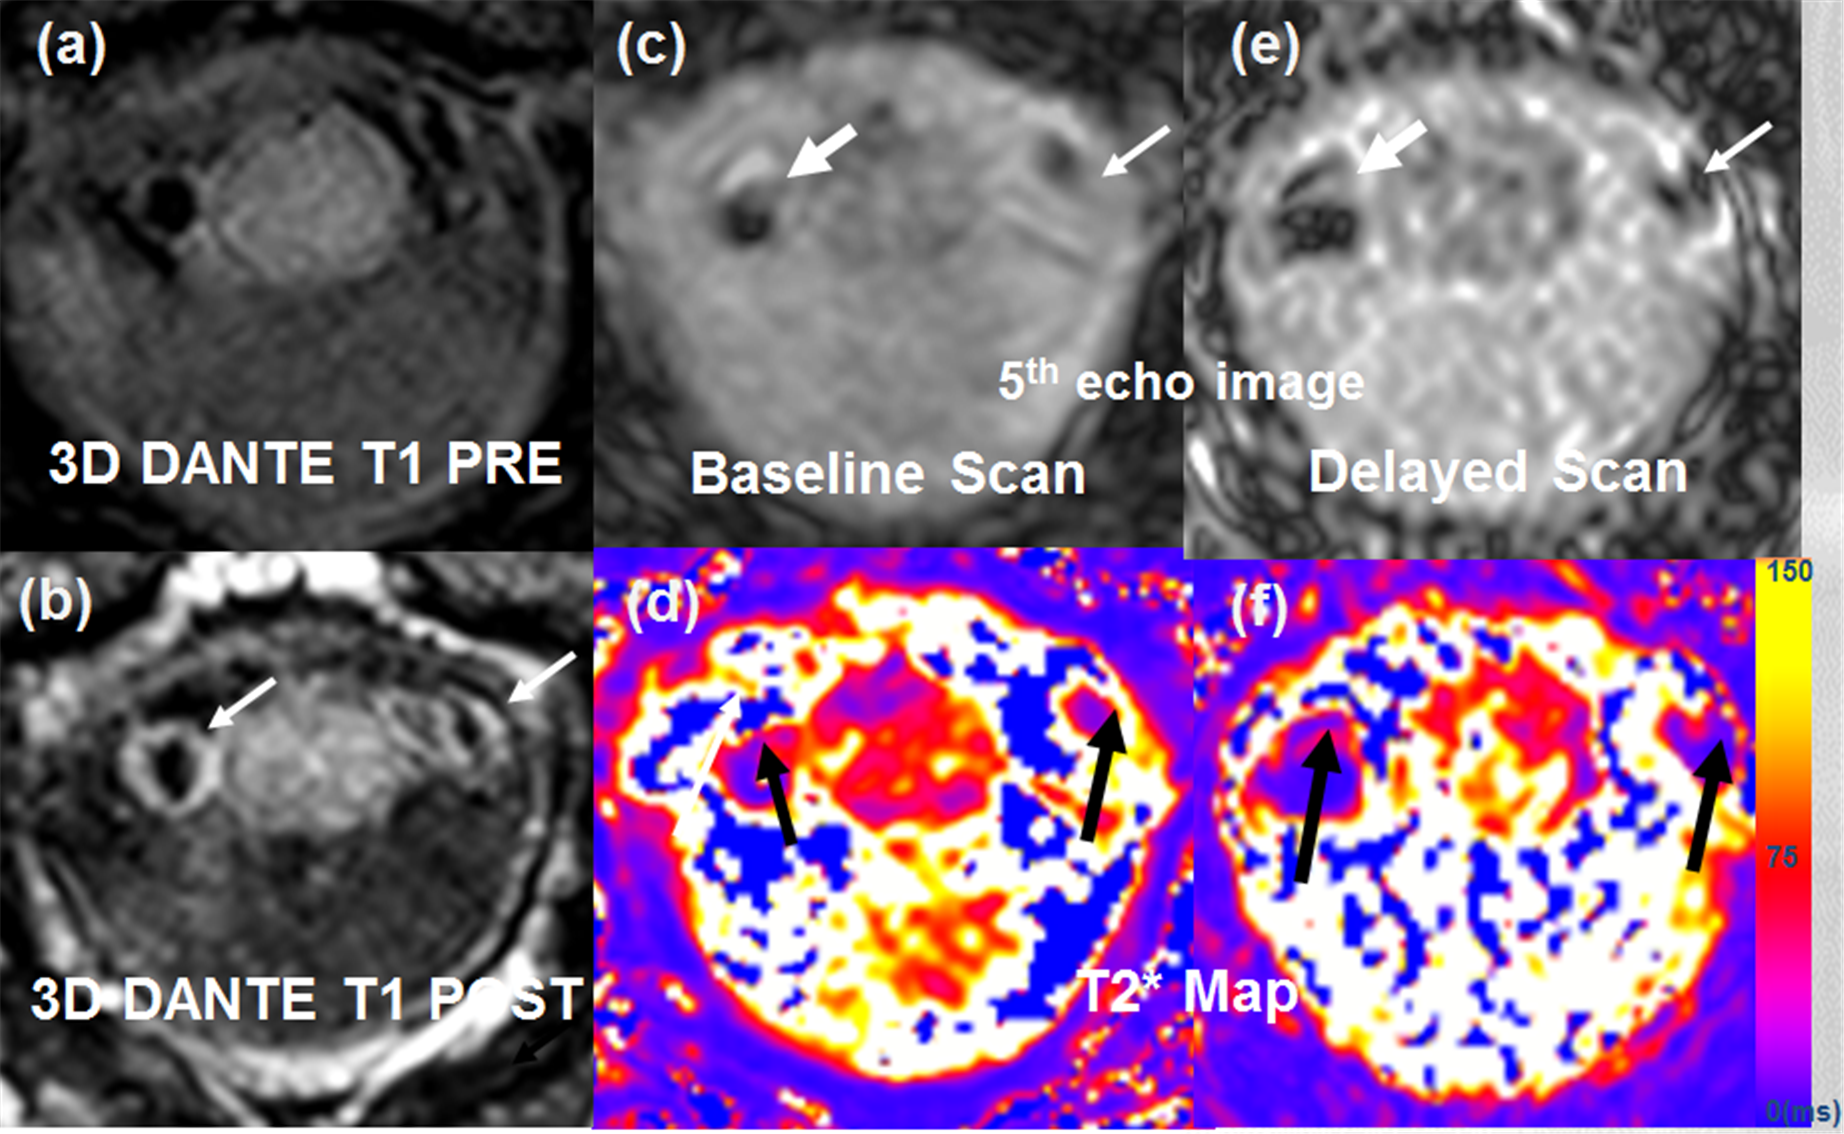
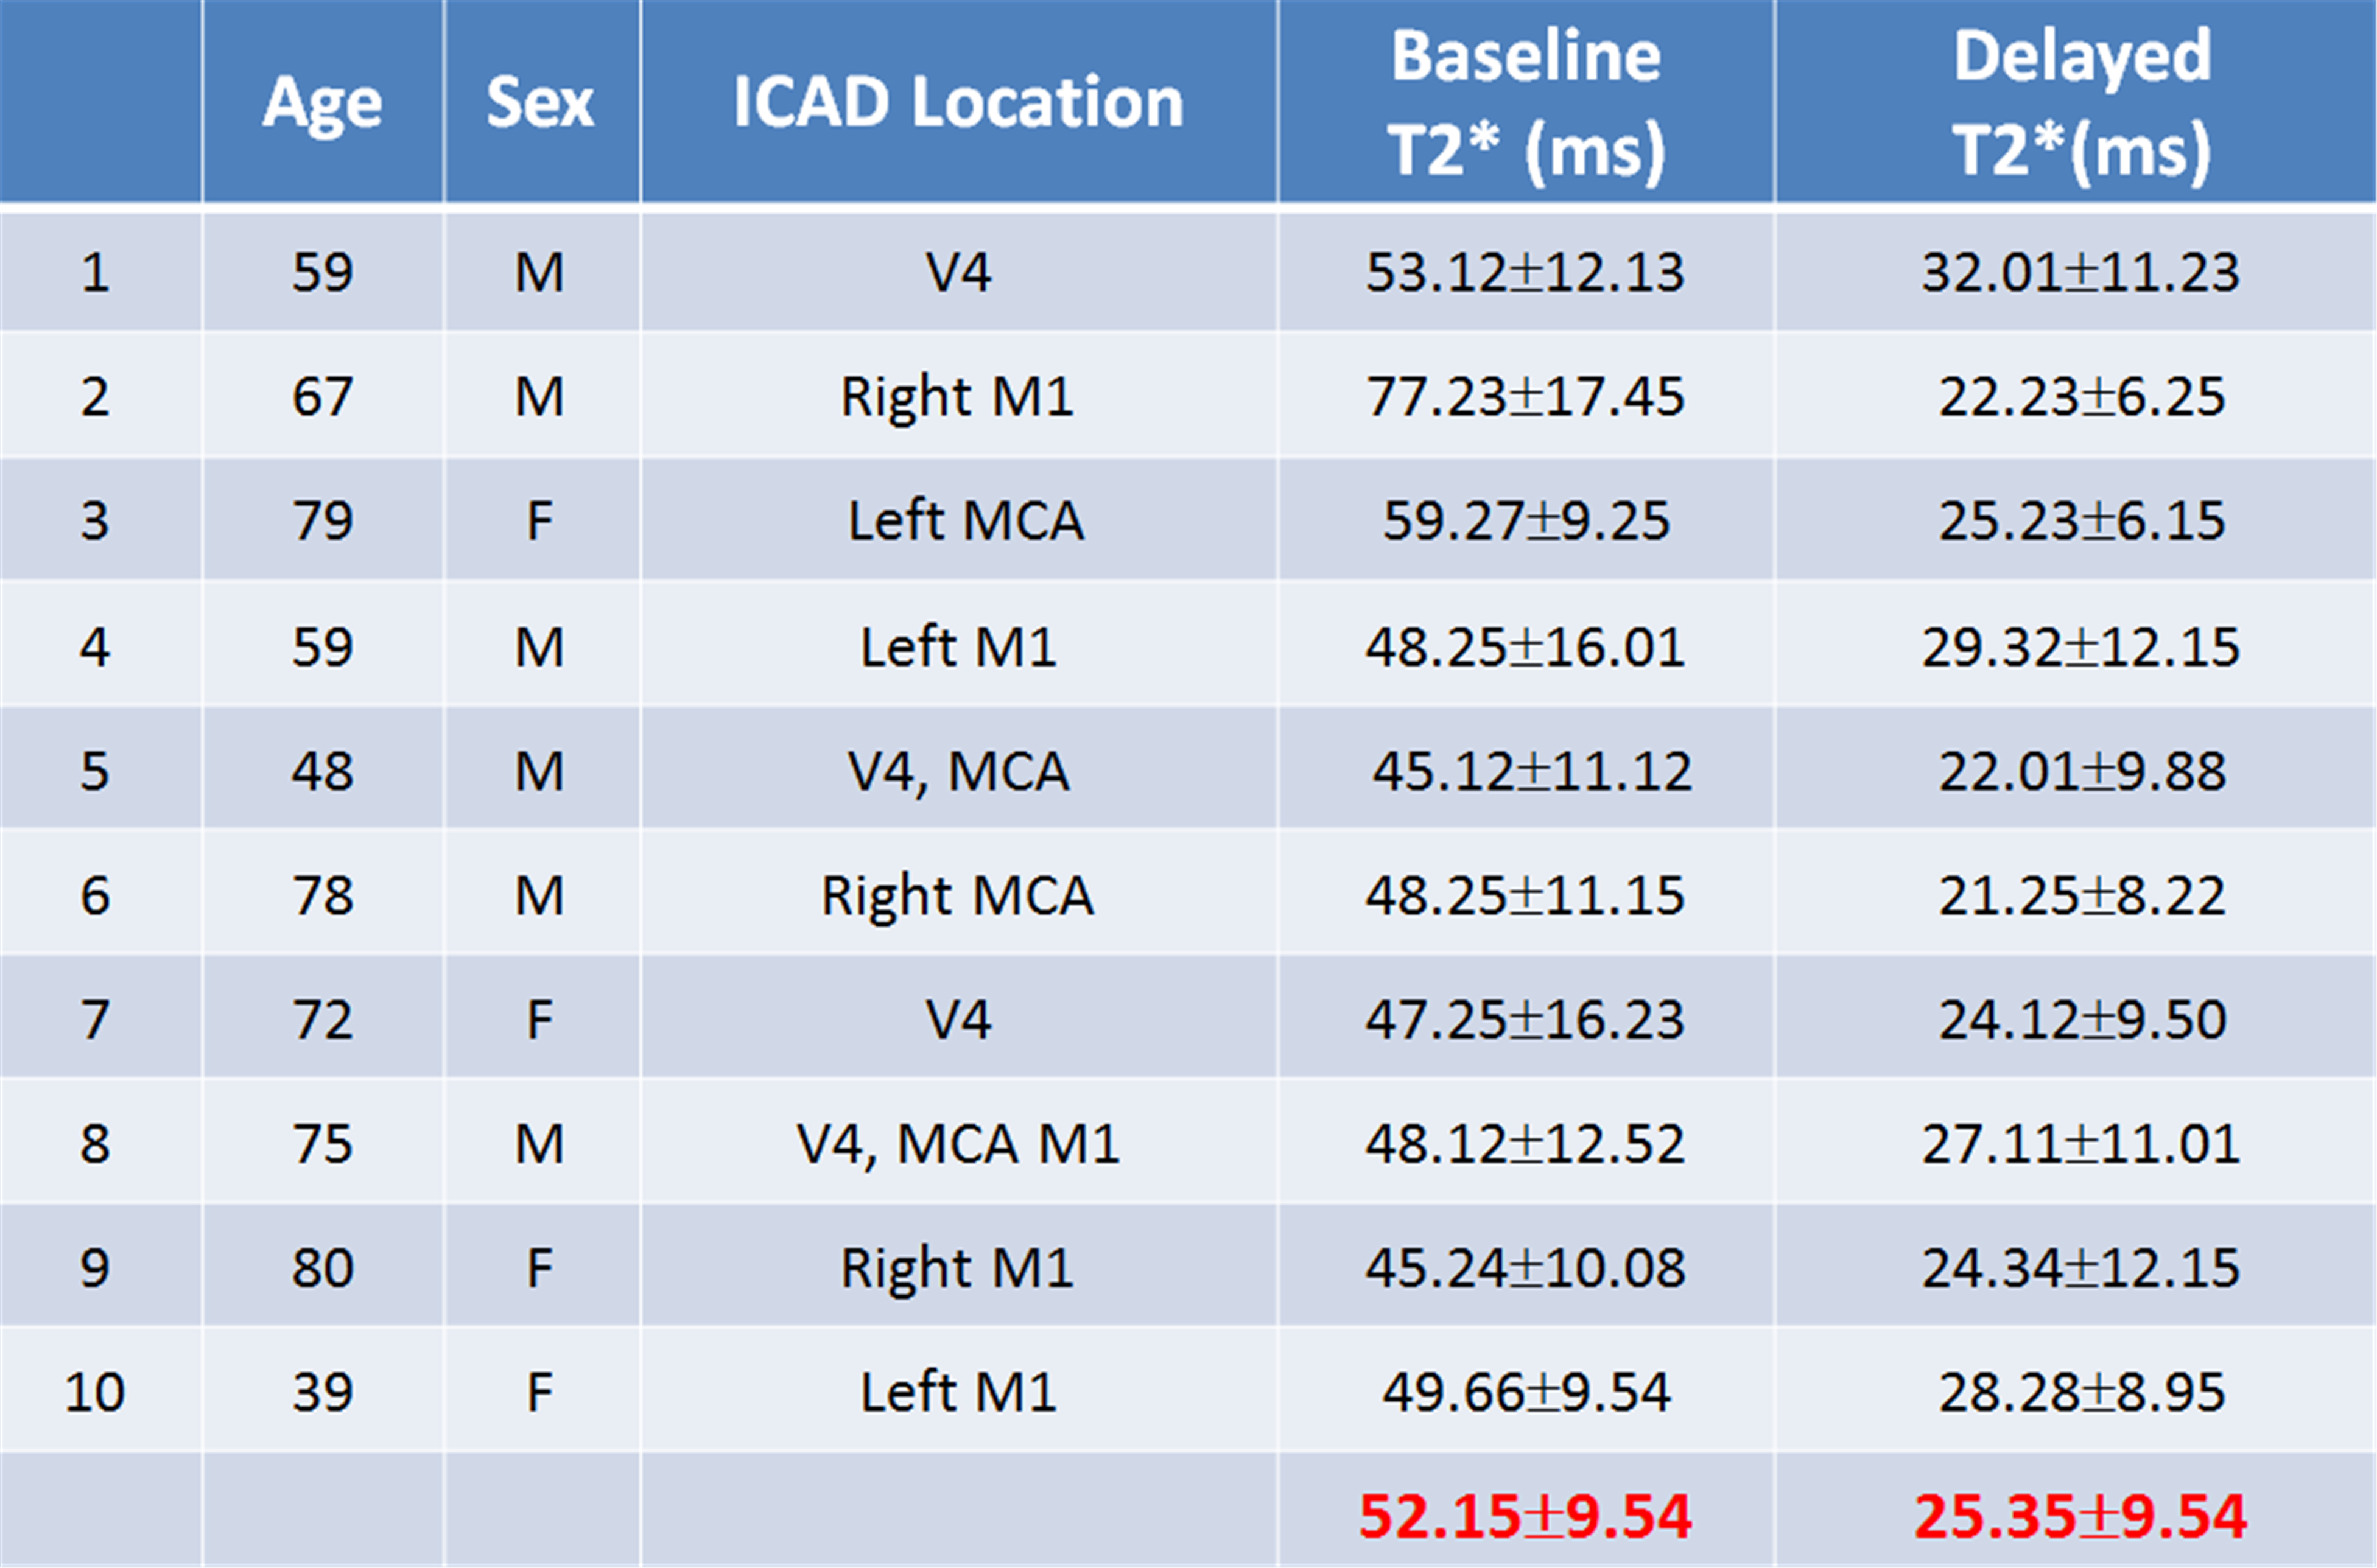
The baseline and delayed T2* measurements from ten patients are summarized on Table 2. Delayed measurements compared to baseline PGE had overall lower plaque T2* values. Figure 1 shows results from a 79 year old female patient who was found to have multiple acute infarcts in the left MCA distribution. A CTA MIP (Fig 1a) shows severe left MCA M1 segment stenosis. 3D SPACE shows PGE in a left MCA stenotic plaque (white arrow) (Fig 1b). Baseline T2* imaging (5th echo with TE=16.2ms, Fig 1e) shows no T2* signal in the left M1 plaque (white arrow, Fig 1c) comparing to the 72 h delayed T2* image (Fig 1f) which shows hypointense signal (white arrow, Fig 1d). The 72h delayed T2* map (Fig 2d) shows a lower T2* value corresponding to the T2* signal enhanced area. The black arrows on T2* maps show that the ferumoxytol uptake after 72h post injection can be quantified by the difference in T2* values measured from baseline and delayed scans. Mean T2* values of baseline and delayed on the left M1 plaque were measured to be 57.27±9.25 ms (Fig 1e) and 25.23±6.15 ms (Fig 1f), respectively. Fig 2 shows the results from a 72 year old female patient with bilateral PGE in V4. 3D DANTE post sequence (b) shows the vessel wall enhancement surrounding V4 segments of the arteries with single puncuate focus diffusion restriction. T2* images are shown on Fig 2c (baseline) and Fig 2e (delayed). Mean T2* values of baseline and delayed on the V4 were measure as 47.25±16.23 ms(Fig 2d) and 24.12±9.5 ms(Fig 2f), respectively.Discussion
T2* weighted imaging often suffers from macroscopic susceptibilities that arise from the sinus/brain interface. Image post-processing methods have been proposed to correct T2* induced by macroscopic susceptibilities9. Previous studies of iron nanoparticle uptake have used 2D techniques, which are adequate for larger caliber arteries, larger plaques and linear segments such as the carotid6,7. For the unique challenges inherent to ICAD, we developed a 3D BB ME T2* sequence that has excellent blood suppression. When a relatively thin slab (36 mm) is used with 3D acquisition and QIR preparation, we found good blood suppression on 72h delay MRI. Delayed ferumoxytol T2* imaging has been used for semi-quantitative measurement of uptake, but it can easily over- or under-estimate the uptake caused by the differences in subject and coil positioning between baseline and delayed scan which can influence the T2* signal intensities10. To minimize those factors, T2* can be used to assess the localization and amount of uptake more directly and with high sensitivity. Our measurements of iron nanoparticle uptake in symptomatic ICAD have important mechanistic implications for the pathophysiology of PGE. Further research will clarify if this uptake is only seen in ICAD with PGE and if it is predictive of stroke recurrence.Acknowledgements
Supported by R01 HL127582, NIH S10OD018482, RSNA Research Scholar Grant RSCH1414, AMAG Pharmaceuticals, American Heart Association 17SDG33670114, Siemens Medical Solutions, and the Clinical Merit Review Grant from the Veterans Administration health Care System.References
1. Suri MFK, Johnston SC. Epidemiology of intracranial stenosis. J Neuroimaging Off J Am Soc Neuroimaging 2009;19 Suppl 1:11S–6S.
2. Millon A, Boussel L, Brevet M, et al. Clinical and histological significance of gadolinium enhancement in carotid atherosclerotic plaque. Stroke J Cereb Circ 2012;43:3023–8.
3. Celletti FL, Waugh JM, Amabile PG, et al. Vascular endothelial growth factor enhances atherosclerotic plaque progression. Nature medicine 2001;7(4):425-429.
4. Libby P, Ridker PM, Maseri A. Inflammation and atherosclerosis. Circulation 2002;105(9):1135-1143.
5. Trivedi RA, Mallawarachi C, U-King-Im J-M, et al. Identifying inflamed carotid plaques using in vivo USPIO-enhanced MR imaging to label plaque macrophages. Arterioscler Thromb Vasc Biol 2006;26:1601–6.
6. Weinstein JS, Varallyay CG, Dosa E, et al. Superparamagnetic iron oxide nanoparticles: diagnostic magnetic resonance imaging and potential therapeutic applications in neurooncology and central nervous system inflammatory pathologies, a review. J Cereb Blood Flow Metab Off J Int Soc Cereb Blood Flow Metab 2010;30:15–35.
7. Alam SR, Stirrat C, Richards J, et al. Vascular and plaque imaging with ultrasmall superparamagnetic particles of iron oxide. J Cardiovasc Magn Reson 2015;17:1–9.
8. Kim SE, de Havenon A, McNally JS et al. 3D high resolution Black Blood(BB) Multiple Echo(ME) T2* Imaging Technique for Quantitative Ferumoxytol Imaging on Delayed Scans. ISMRM 2018.
9. Panek R, Welsh Liam, Dunlop A er al. Repeatability and sensitivity of T∗2 measurements in patients with head and neck squamous cell carcinoma at 3T. JMRI. 2016 Jul; 44(1): 72–80.
10. Fayad ZA, Razzouk, Briley-Saebo KC et al. Iron oxide magnetic resonance imaging for atherosclerosis therapeutic evaluation: still rusty?. J Am Coll Cardiol. 2009 Jun 2; 53(22): 2051–2052.
Figures