0288
ASL signal model for simultaneously measuring CBF and CBV based on ASL imaging for characterizing hemodynamic perfusion state in normal subjects and patients with moyamoya disease.1Radiology, University of Fukui, Fukui, Japan, 2Neurosurgery, University of Fukui, Fukui, Japan, 3Radiological center, University of Fukui Hospital, Fukui, Japan, 4Division of Health Sciences, Graduate school of Medical Sciences, Kanazawa University, Kanazawa, Japan, 5MR application and Workflow, GE Healthcare JAPAN, HIno, Japan, 6Department of Medical Imaging, Faculty of Life Sciences, Kumamoto University, Kumamoto, Japan, 7Department of Radiology, University of Fukui, Fukui, Japan, 8GE Healthcare JAPAN, Hino, Japan
Synopsis
Not only cerebral blood flow (CBF) but also cerebral blood volume (CBV)
plays an important role for the maintenance of cerebral blood perfusion. We
hypothesized that the ASL signal difference caused by vessel suppression (VS)
scheme should be dependent on arterial CBV fraction of total ASL signal. In
this study, we introduced modified two-compartments model based on ASL signal
with and without VS, so that we can calculate arterial volume fraction of total
ASL signal. The objective of this study is to demonstrate the feasibility of arterial
CBV map as well as CBF based on ASL imaging.
Introduction:
Arterial spin labeling provides a non-invasive assessment of cerebral blood flow (CBF). Cerebral blood volume (CBV) also plays an important role for the maintenance of cerebral blood perfusion. However, non-invasive measurement of CBV is a challenge due to the difficulty of separating tissue signal from arteriolar/microvasculature signal. Most straightforward method is suppressing microvascular signal using vascular suppression (VS) scheme. Recent paper has reported that a technique of Delays Alternating with Nutation for Tailored Excitation (DANTE) had homogenous and efficient vascular suppression effects for ASL sequence [1]. Thus CBV imaging consists of two ASL acquisitions with and without VS. Moreover, arterial transit time (ATT) correction is also inevitable and time consuming acquisition for the quantitative multi-parametric analysis of ASL imaging. Hadamard-encoded pseudo-continuous arterial spin labeling (H-pCASL) is a time-efficient technique with high signal-to-noise ratio for multiple delay acquisitions [2]. Therefore, we have combined H-pCASL acquisition and DANTE-VS preparation for the calculation of arterial CBV (aCBV) in addition to CBF and ATT. The objective of this study was to demonstrate the feasibility of quantitative aCBV map as well as CBF with ATT compensation based on H-pCASL combined with DANTE-VS imaging.ASL signal model:
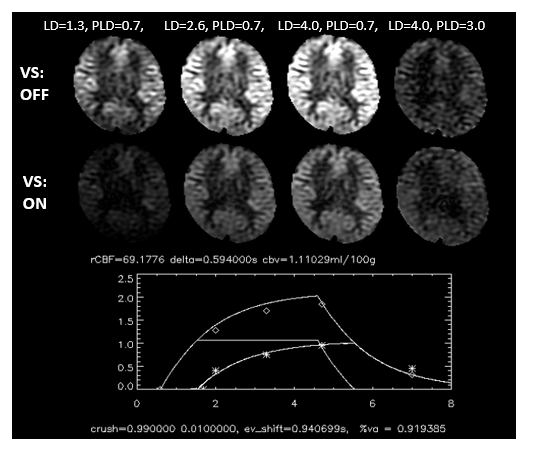
The used ASL signal model consists of two compartments corresponding to microvascular and tissue, each has different transit time, i.e., ATT and tissue transit time (TTT), respectively. In addition, we hypothesized that the signal from microvascular compartment could be ideally suppressed by the method using DANTE-VS scheme, while the signal from tissue could be fully retained. We have used the simplified two-compartment model with the two transit time consideration, which has been reported previously [3,4].Materials & Methods:
Seventeen healthy volunteers (n = 17, 33.2 ± 14.6 years old) and three patients with moyamoya disease ( 45 ± 1.2 years old) were scanned on a 3.0 T magnetic resonance imaging unit (Discovery 750, GE Healthcare) with a 32-channel head array coil. H-pCASL was performed with LD=40000 ms, PLD=700 ms, three delays, repetition time of 6225 ms, echo time of 10.5 ms, field of view of 240 mm, 512 points with 6 interleaves, and a signal average. Using the data of Hadamard-encoded acquisition, a long-labeled short-delay perfusion image (1dLLSD) was also calculated. In addition, single-delay pCASL with a long LD=4000ms and long PLD=3000 ms was acquired (1dLLLD). We combined two series of ASL acquisition (3d H-pCASL including 1dLLSD and 1dLLLD) to estimate ATTs using the weighted delay method [5]. The combination of 3d and 1dLLLD were repeated again in the same protocol but with VS condition, which make total scan time 10min 42 sec. All calculated maps were spatially normalized to the Montreal Neurological Institute-space template using SPM12 [6]. The volumes of interest in the anterior, middle, and posterior cerebral artery territories were automatically delineated using a vascular territory atlas template [7].Results:
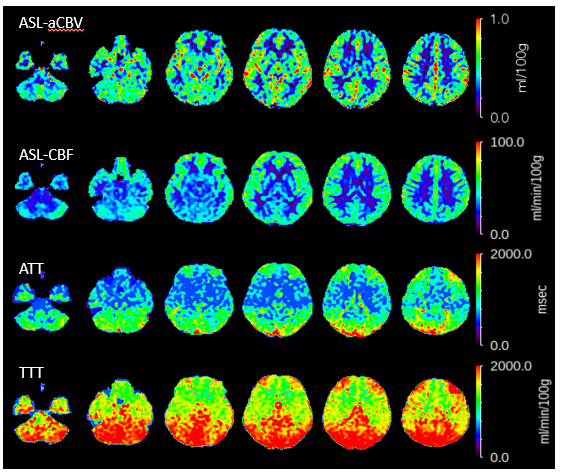
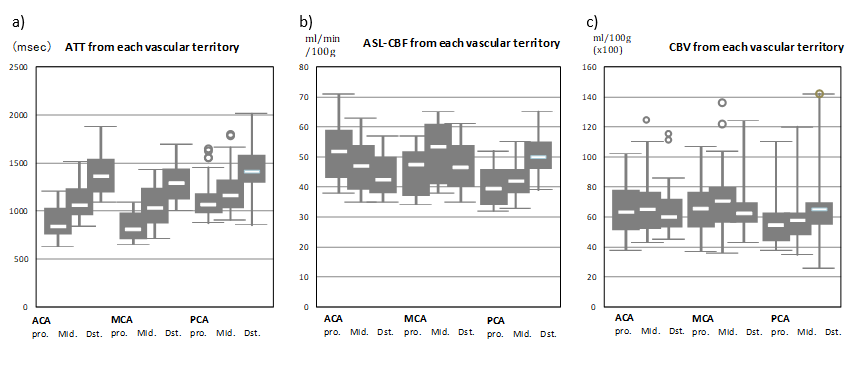
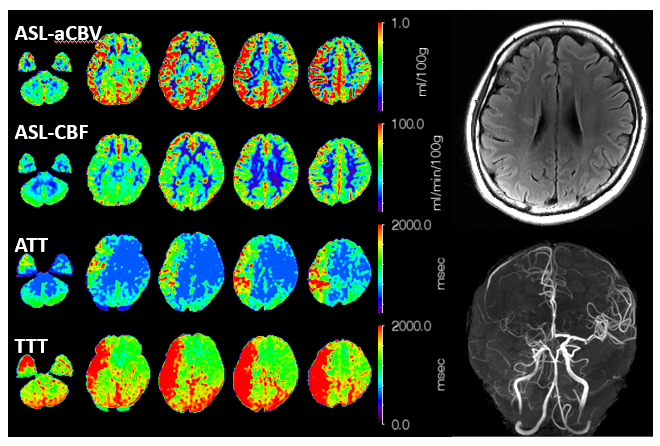
Figure 1 demonstrates the simulation of two compartment model from the ROI located in cortical gray region. CBF, ATT, aCBV (Percent vascular signal ratio), and TTT maps from a normal subject are shown in Figure 2. The average values of those parameters obtained from each vascular territories are shown in Figures 3 in normal groups. Figure 4 demonstrates CBV, CBF, ATT, and TTT maps obtained from a patient with moyamoya disease.Discussion:
We have demonstrated the feasibility of simultaneous calculation of aCBV, ATT, TTT and CBF maps from the two ASL acquisitions with and without VS. The aCBV map revealed brighter signal in affected cortex than that of contralateral side, and did so as that of a normal subject (Figure 2, 3), which may be associated with the drop of perfusion pressure due to the chronic major cerebral artery stenosis/occlusion, the arteriolar cerebral vessels dilate, which may cause the decline of cerebral vessel resistance and hence prolonged transit time through microvascular compartment. In another words, larger aCBV could be the reflection of the regulatory response to compensate decreased perfusion pressure in misery perfusion state. Therefore, the current result suggests that the quantitative value of aCBV is directly dependent to the sensitivity of DANTE-VS in local brain microvasculature.Conclusion:
The simplified two-compartment model has successfully simulated the ASL signal with and without VS from normal subjects and a patient with moyamoya disease. The metrics of aCBV as well as rCBF, ATT, TTT based on the ASL signal model may be useful for characterizing the case with misery perfusion state in complete non-invasive way.Acknowledgements
No acknowledgement found.References
1. Matsuda, T., Kimura, H, Kabasawa, H, et al. Three-dimensional arterial spin labeling imaging with a DANTE preparation pulse. Magn reson imaging. 2018; 49: 131-137.
2. Dai, W, Shankaranarayanan A, Alsop DC. Volumetric measurement of perfusion and arterial transit delay using hadamard encoded continuous arterial spin labeling. Magn Reson Med. 2013; 69 (4): 1014–1022.
3. Wang, J., et al. Comparison of quantitative perfusion imaging using arterial spin labeling at 1.5 and 4.0 Tesla. Magn Reson.Med. 2002; 48(2): 242-254.
4. Tsujikawa T, Kimura H, Matsuda T, et al. Arterial transit time mapping obtained by pulsed continuous 3D ASL imaging with multiple post-label delay acquisitions: Comparative study with PET-CBF in patients with chronic occlusive cerebrovascular disease. PLoS One. 2016; 11 (6): e0156005.
5. Dai W, Robson PM., Shankaranarayanan A, et al. Reduced resolution transit delay prescan for quantitative continuous arterial spin labeling perfusion imaging. Magn Reson Med. 2012; 67 (5), 1252–1265.
6. Ashburner J, Friston KJ. Voxel-based morphometry—the methods. Neuroimage. 2000; 11:805-521. Mutsaerts HJ, van Dalen JW, Heijtel DF, et al. Cerebral perfusion measurements in elderly with hypertension using arterial spin labeling. PLoS One. 2015; 10 (8): e0133717.
7. Mutsaerts HJ, van Dalen JW, Heijtel DF, et al. Cerebral perfusion measurements in elderly with hypertension using arterial spin labeling. PLoS One. 2015; 10 (8): e0133717.
Figures