0281
Time-Varying Diffusion Patterns in Breast Cancer Linked to Prognostic Factors1Diagnostic Imaging and Nuclear Medicine, Graduate School of Medicine, Kyoto University, Kyoto, Japan, 2Siemens Healthcare K.K., Tokyo, Japan, 3Siemens Healthcare GmbH, Erlangen, Germany, 4Breast Surgery, Graduate School of Medicine, Kyoto University, Kyoto, Japan
Synopsis
We investigated the utility of diffusion time-dependence of ADC measurements for the differentiation of prognostic biomarkers in human breast tumors using OGSE and PGSE sequences. Malignant tumors had significantly lower ADC values with longer diffusion times. ADC change significantly correlated with Ki-67 expression. Significant association was found between ADC value (at the effective diffusion time of 5.1ms) and PgR expression. These associations indicate the potential of the diffusion-time-dependent ADC values as a tool to differentiate these prognostic biomarkers and highlight tumor heterogeneity without the need of contrast agents.
Introduction
The clinical utility of ADC values in the differentiation between malignant and benign breast lesions or breast tumor subtypes has been reported.1,2 The change in ADC values with different diffusion times has been demonstrated in mice brain studies3,4, and its utility in differentiating malignant and benign tumors has been investigated in the breast, and head and neck5,6. Measuring ADC values at different diffusion times will provide important information of the degree of diffusion hindrance and in turn of the nature of the lesions. Thus, our purpose was to investigate the association of diffusion parameters with the different diffusion times using oscillating gradient spin-echo (OGSE) and pulsed gradient spin-echo (PGSE) in human breast tumors with prognostic biomarkers.Materials and Methods
This prospective study included 88 patients with 91 breast lesions (46 malignant and 45 benign). Diffusion-weighted images were acquired on a dedicated breast phantom (with incorporated compartment with a range of ADC values using polyvinylpyrrolidone (10-40% PVP)7) and on patients, using a 3T system (MAGNETOM Prisma, Siemens Healthcare, Erlangen, Germany) equipped with a dedicated 16-channel breast coil. DWI was performed for 74 patients with breast tumors (37 malignant and 40 benign); with prototype sequences using b-values of 0 and 700s/mm2, and OGSE with trapezoid cosine waveforms (frequency=40Hz; effective diffusion time Deff=5.1ms) and PGSE (Deff=96.6 ms); TR/TE, 7,500ms/125ms; FOV,330×330mm2; matrix,112×112; slice thickness,3.0mm; 4averages, and acquisition time, 2.5min each. 14 patients with breast tumors (9 malignant and 5 benign) had DWI using PGSE with three diffusion times (Deff=20ms, 35ms and 50ms, respectively); b-values of 0 and 850s/mm2, TR/TE, 7,000ms/99ms; FOV,330×330mm2; matrix,112×112; slice thickness,5.0mm; 1average, and acquisition time, 1min10sec each. ADC change was calculated as (ADCshort–ADClong)/ADCshort x 100(%), where ADCshort and ADClong indicate ADC value at short and long diffusion times. ADC values as well as ADC change with the different diffusion times between positivity and negativity in expression of prognostic biomarkers (ER, PgR, HER2, Ki-67) were compared using Mann-Whitney test, and the difference in ADC values depending on the subtypes (Luminal A, Luminal B, HER2, Triple-negative) using Kruskal Wallis test.Results
<Phantom>
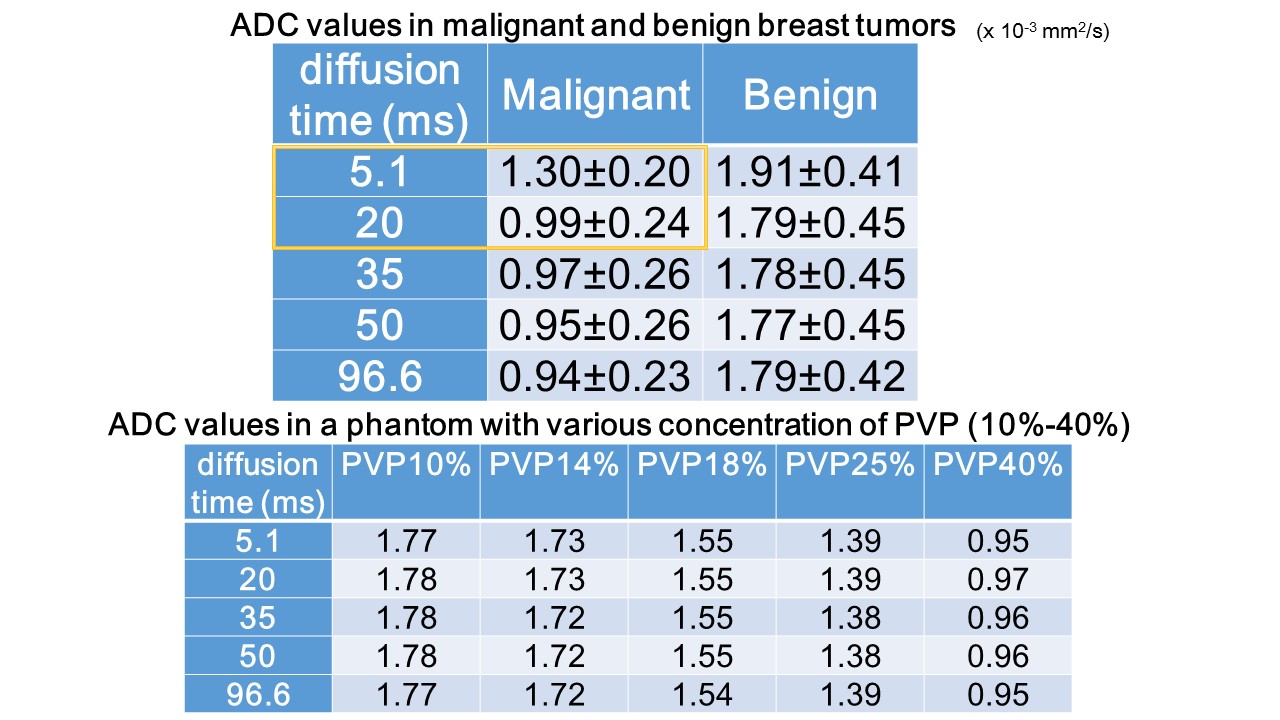
No difference in ADC values across diffusion time was observed in the phantom as expected for Gaussian diffusion, validating the OGSE and PGSE protocols (Table 1).
<Patients>
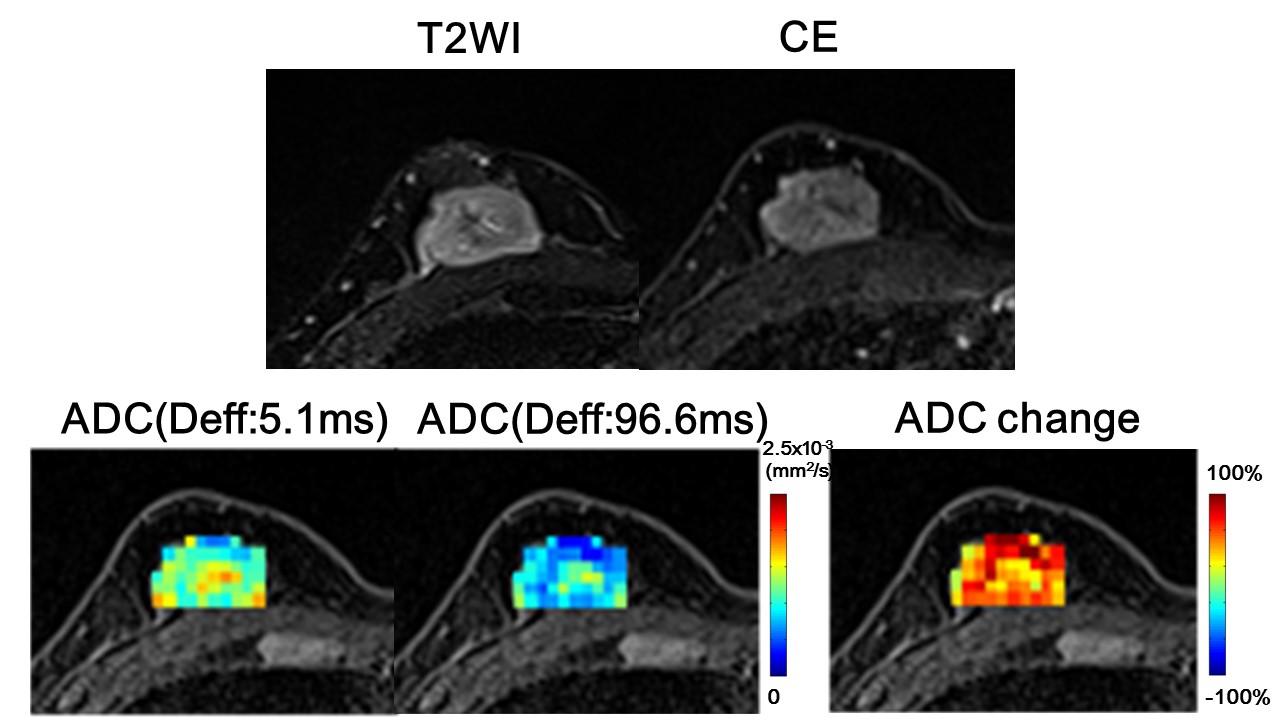
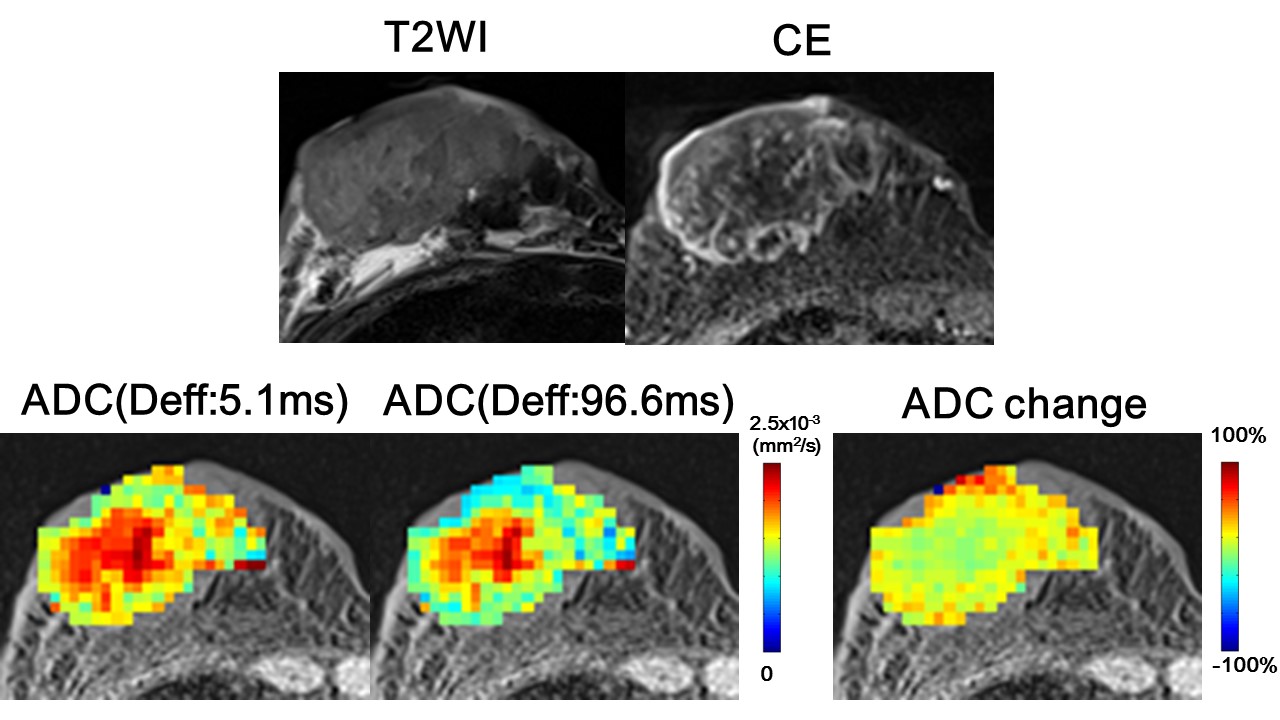
ADC values in malignant lesions were significantly lower than in benign lesions at all diffusion times (Table 1). ADC values in malignant tumors significantly decreased at Deff of 96.6ms compared to 5.1ms, and at Deff of 50ms compared to 20ms (P<0.05). Figures 1-2 demonstrate representative ADC maps and their ADC change maps. The center of the cancer shows a mild decrease in ADC values, while remarkable ADC decrease is observed in the peripheral region of the cancer(Fig.1). This contrast pattern is clearly appreciated in adenoid cystic carcinoma, exhibiting central lesions (possibly necrosis) with small ADC change and peripheral viable lesions with large ADC change(Fig.2).
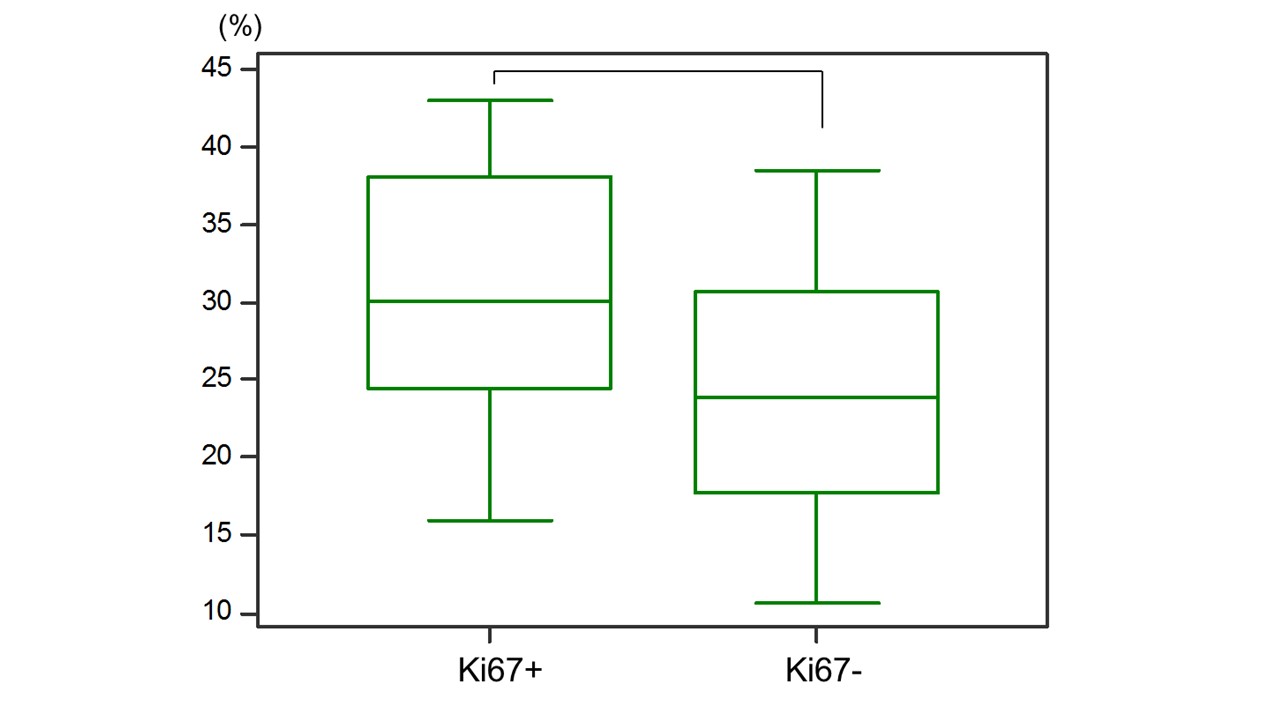
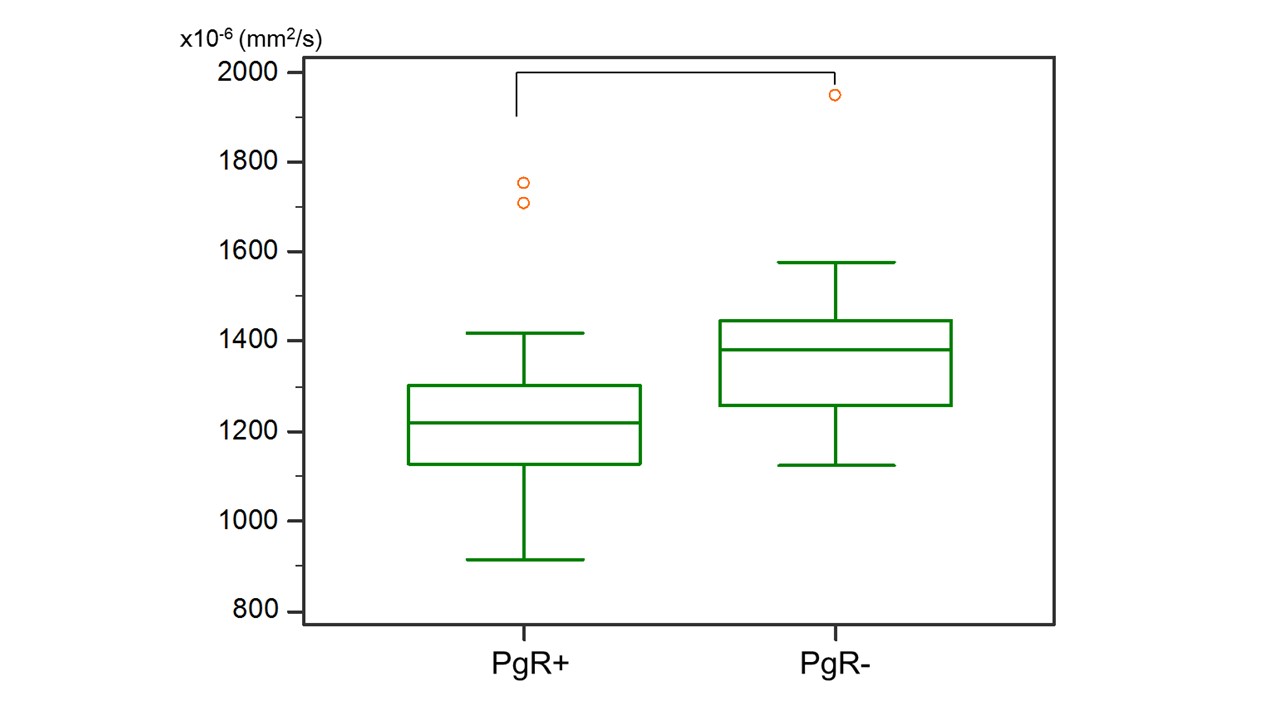
Significant association was found between ADC change (between Deff of 5.1ms and 96.6ms) and the Ki-67 status (P<0.03, Fig.3). The ADC value at Deff of 5.1ms is significantly associated with the expression in PgR status (P<0.01, Fig.4). No significant difference was found in other prognostic biomarkers or subtypes of breast cancer.
Discussion
The decrease of ADC values at different diffusion times in breast tumors was in agreement with literature and in line with our previous investigation5,6. This suggests the hypothesis that diffusion hindrance increases with the diffusion time in the tumor, as more molecules hit many boundaries, such as cell membranes. After a sharp decrease between 5 and 20ms the ADC value in malignant tumors was levelling-off at longer diffusion times. The ADC decrease observed in malignant rather than benign tumors suggest the difference of displacement of water molecules depending on tissue types. The association of ADC values with prognostic biomarkers was reported2,9; however, its tendency of diffusion-time-dependent ADC values has not been investigated to the best of our knowledge. PgR or Ki-67 might reflect differences in some activity of microscopic obstacles, such as components in cells or cell membranes as they are expressed in membranes or in the nucleus of cancer cells, considering the cell membrane permeability to water to which the ADC is highly sensitive8.Conclusion
ADC values in breast tumors varied with diffusion time, suggesting the necessity of reporting diffusion time. The ADC change between different diffusion times was significantly associated with Ki-67 expression. The ADC value (Deff=5.1ms) was significantly associated with PgR expression. Diffusion-time dependent ADC measurements might help differentiate these prognostic biomarkers, to determine treatment plans and to highlight tumor heterogeneity without the need of contrast agents.Acknowledgements
This work was supported by Hakubi Project of Kyoto University and MEXT KAKENHI Grant No. 15K19786. The authors would like to thank Mr. Katsutoshi Murata from Siemens Healthcare K.K. for the excellent and knowledgeable support.References
(1) Partridge SC et al. Diffusion-weighted breast MRI: Clinical applications and emerging techniques. J Magn Reson Imaging. 2017;45:337-355.
(2) Iima M et al. Intravoxel incoherent motion and quantitative non-Gaussian diffusion MRI: Evaluation of the diagnostic and prognostic value of several markers of malignant and benign breast lesions. Radiology 2018;287:432-441.
(3) Pyatigorskaya N et al. Relationship between the diffusion time and the diffusion MRI signal observed at 17.2 Tesla in the healthy rat brain cortex. Magn Reson Med. 2014;72:492-500.
(4) Reynaud O et al. Surface-to-volume ratio mapping of tumor microstructure using oscillating gradient diffusion weighted imaging. Magn Reson Med. 2016;76:237-47.
(5) Iima M et al. Time makes the difference: Comparison of ADC values obtained with OGSE and PGSE sequences for differentiation of human breast tumors. ISMRM-ESMRMB 2018 Paris, France.
(6) Iima M et al. Time-dependent diffusion MRI to distinguish malignant from benign head and neck tumors, J Magn Reson Imaging. in press
(7) Keenan KE et al. Design of a breast phantom for quantitative MRI. J Magn Reson Imaging. 2016 ;44:610-9.
(8) Springer CS Jr. Using 1H2O MR to measure and map sodium pump activity in vivo. J Magn Reson. Epub 2018 Apr 26.
(9) Kamitani T et al. Correlations between Apparent Diffusion Coefficient Values and Prognostic Factors of Breast Cancer. Magnetic Resonance in Medical Sciences. 2013;3193-199.
Figures