0278
Combination of MRI quantitative measures improves prediction of residual disease following neoadjuvant chemotherapy (NAC) for breast cancer in the I-SPY 2 TRIAL1Radiology & Biomedical Imaging, University of California San Francisco, San Francisco, CA, United States, 2Epidemiology and Biostatistics, University of California San Francisco, San Francisco, CA, United States, 3Surgery, University of California San Francisco, San Francisco, CA, United States, 4Quantum Leap Healthcare Collaborative, San Francisco, CA, United States
Synopsis
This abstract presents the work of combining different MR measures to predict primary tumor residual after patients with breast cancer went through neoadjuvant chemotherapy. Three types of MR measures are investigated in this study: longest diameter, functional tumor volume, and apparent diffusion coefficient. Results showed that when all three types of MR measures are combined in the logistic regression model, it yielded the highest AUC compared to the model with only one of the MR measures. Results also suggested that measures taken at various treatment time points, not just pre-surgery, should be included in the prediction of the residual disease.
Introduction
The I-SPY 2 TRIAL is a multi-center clinical trial for patients with locally advanced breast cancer undergoing systemic chemotherapy before surgery (neoadjuvant chemotherapy, NAC)1. MRI is an integral part of the trial and is used to monitor tumor response during treatment. The purpose of this study is to determine if the combination of longest diameter (LD), functional tumor volume (FTV), and apparent diffusion coefficient (ADC) from MRI collected at 4 time-points during treatment is superior to any measure alone for predicting residual disease after NAC.Methods
Data from patients in completed drug arms of I-SPY 2 were included in the analysis. Dynamic contrast-enhanced (DCE) MRI and diffusion weighted (DW) MRI were acquired four times for each patient: pre-treatment (T0), early treatment (T1, 3 weeks after treatment initiation), inter-regimen (T2, after the completion of first NAC regimen and before the second regimen), and before surgery (T3, after the completion of both regimens). LD was measured by the site radiologist as the longest dimension of the enhanced area on early post-contrast images. FTV was assessed as the sum of voxels with enhancement above specific thresholds within a manually defined volume-of-interest encompassing the enhancing region(s). ADC was assessed as the mean ADC within the manually delineated tumor region-of-interest (ROI) on all axial slices where tumor was visualized. The absolute values of LD, FTV, and ADC at T0, and their percent changes from T0 to T1, T2 and T3, were analyzed as imaging predictors of residual primary tumor after NAC. The residual was dichotomized to be 0=no residual and 1=yes residual based on the residual cancer burden (RCB) in the primary tumor bed2. The area under the ROC curve (AUC) was calculated using 10-fold cross-validation to avoid overfitting. The model for LD values only, FTV values only, ADC values only, and for the combination of all values from all 3 predictor types was chosen as the one having the highest AUC after all combinations of available predictors were tested based on logistic regression modeling. The same analysis was conducted in the full cohort and separately in hormone receptor (HR, positive or negative) and human epidermal growth factor receptor 2 (HER2, positive or negative) subtypes.Results
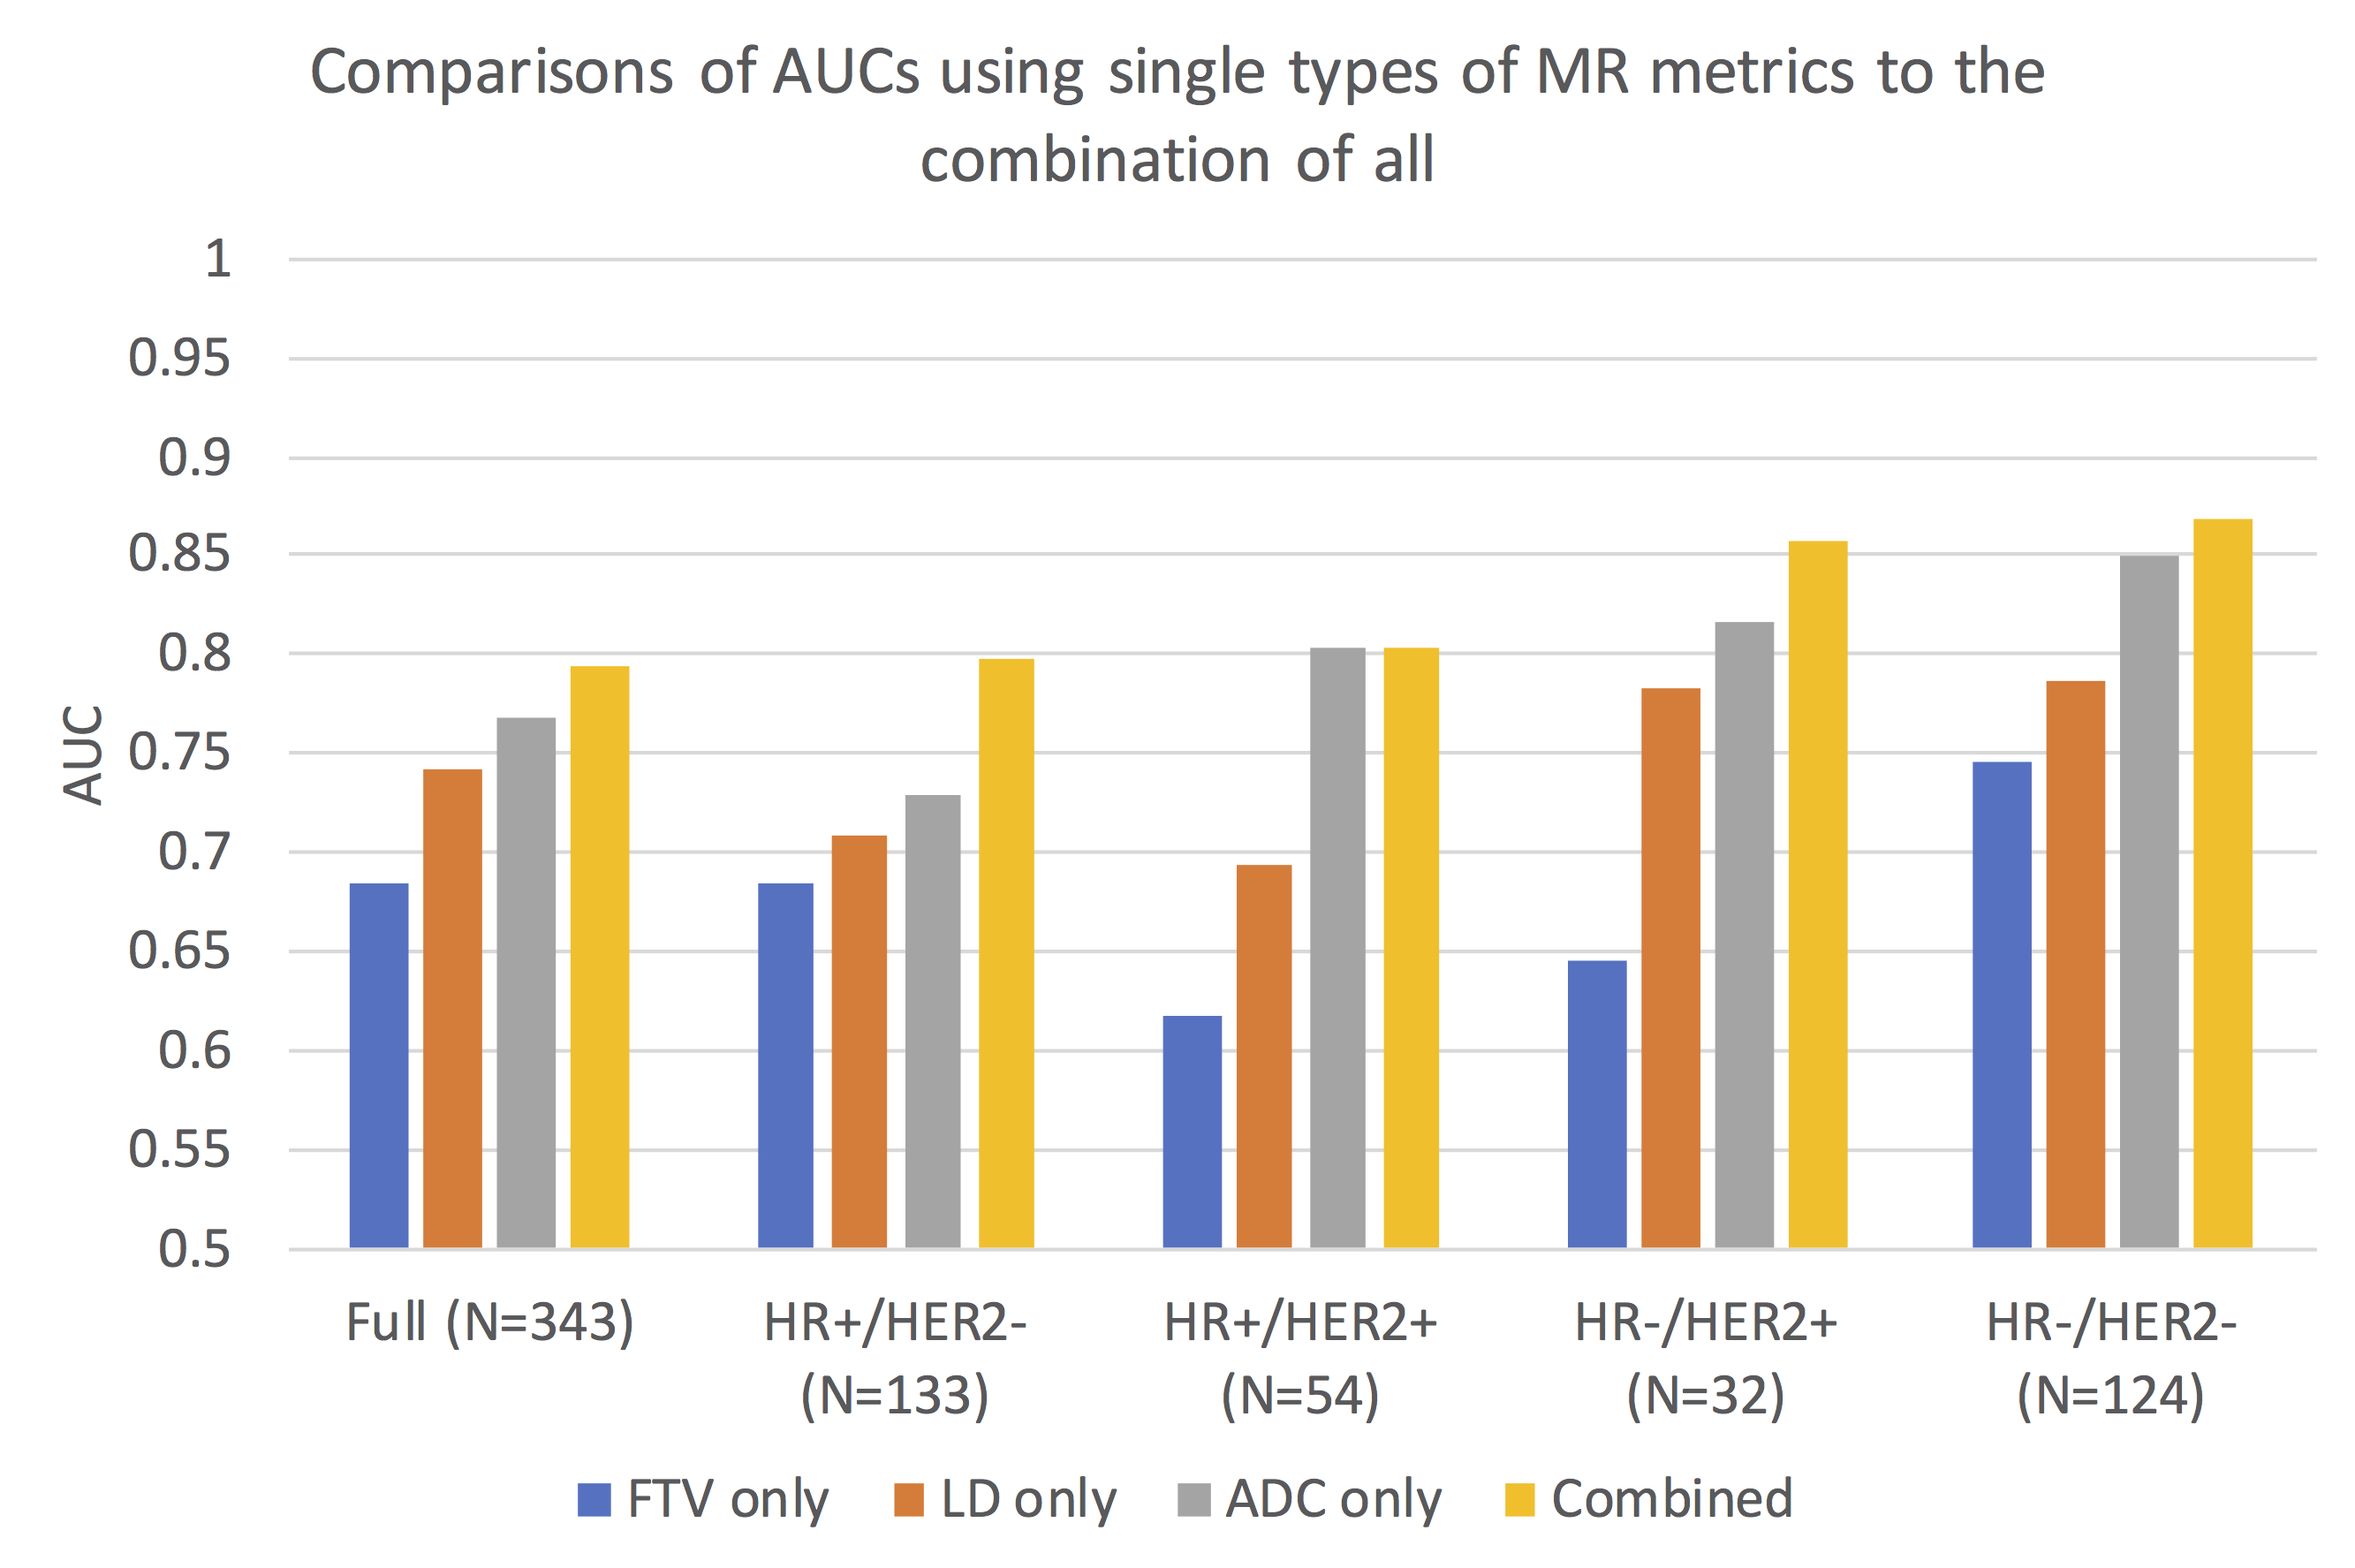
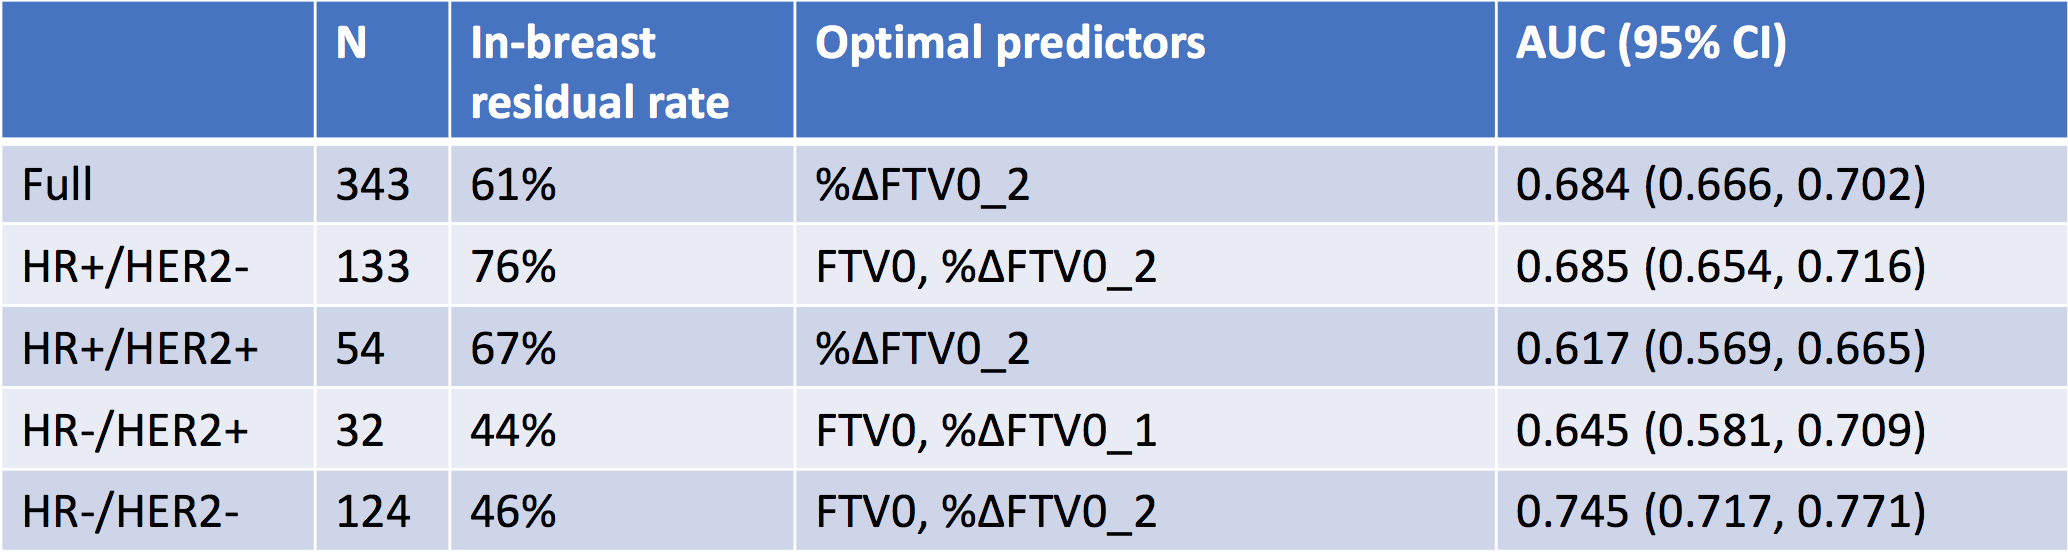
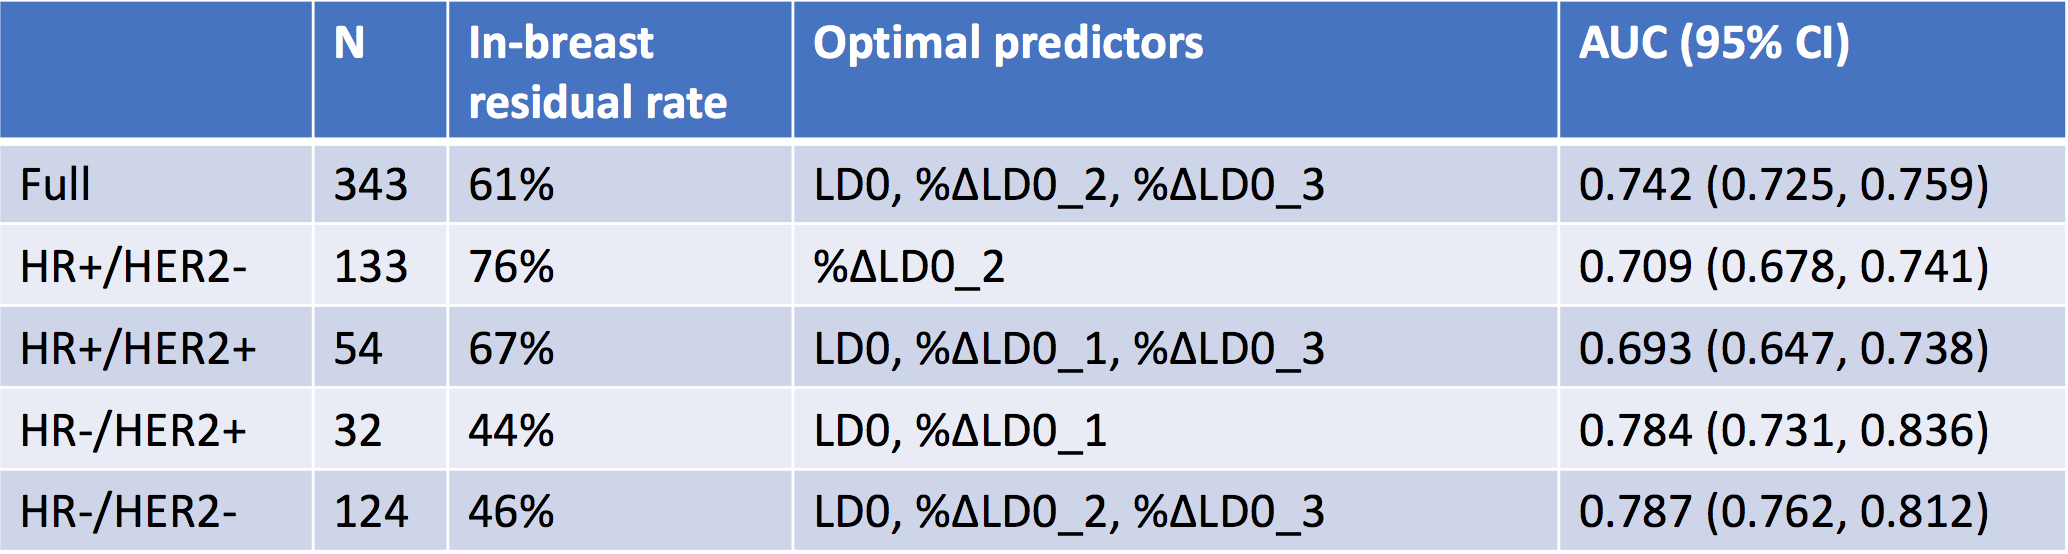
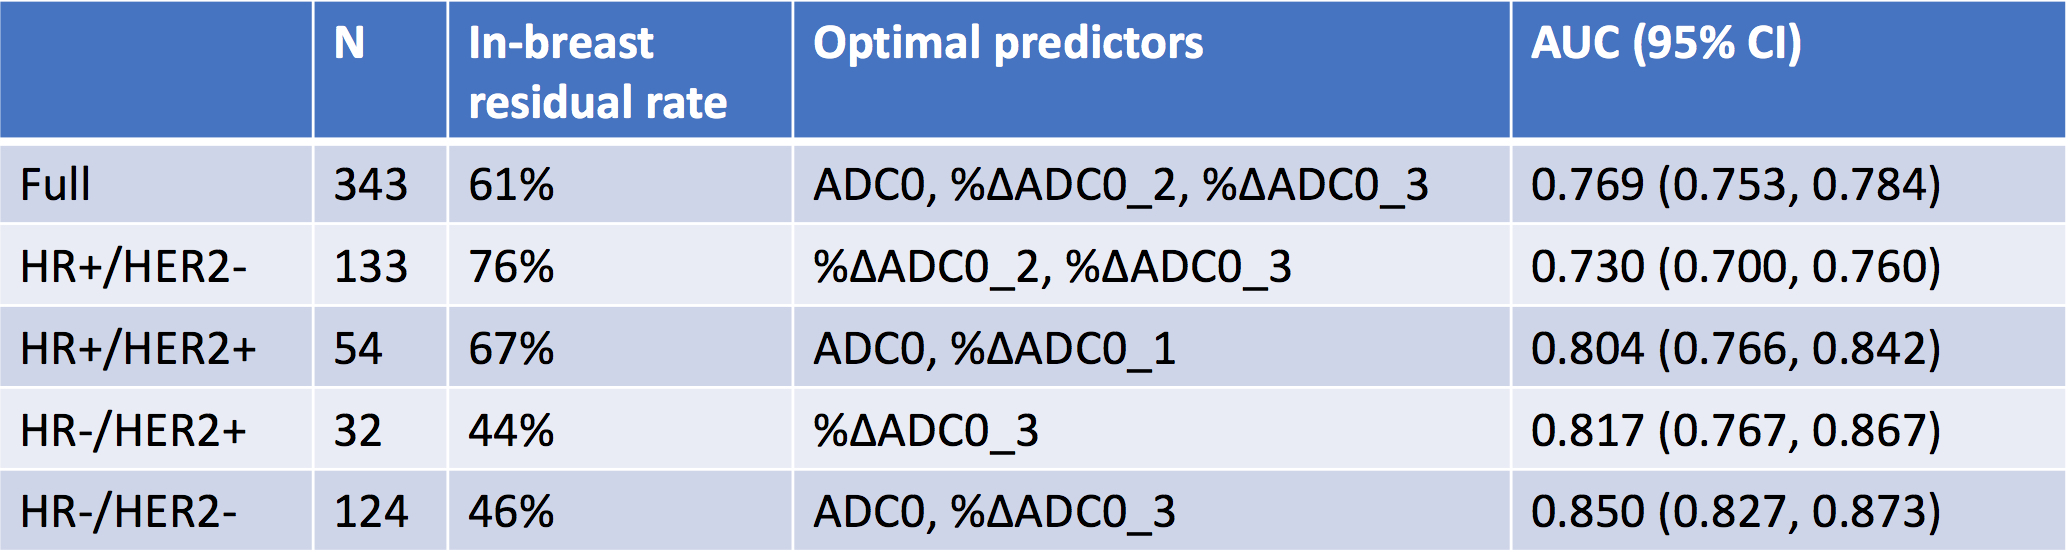
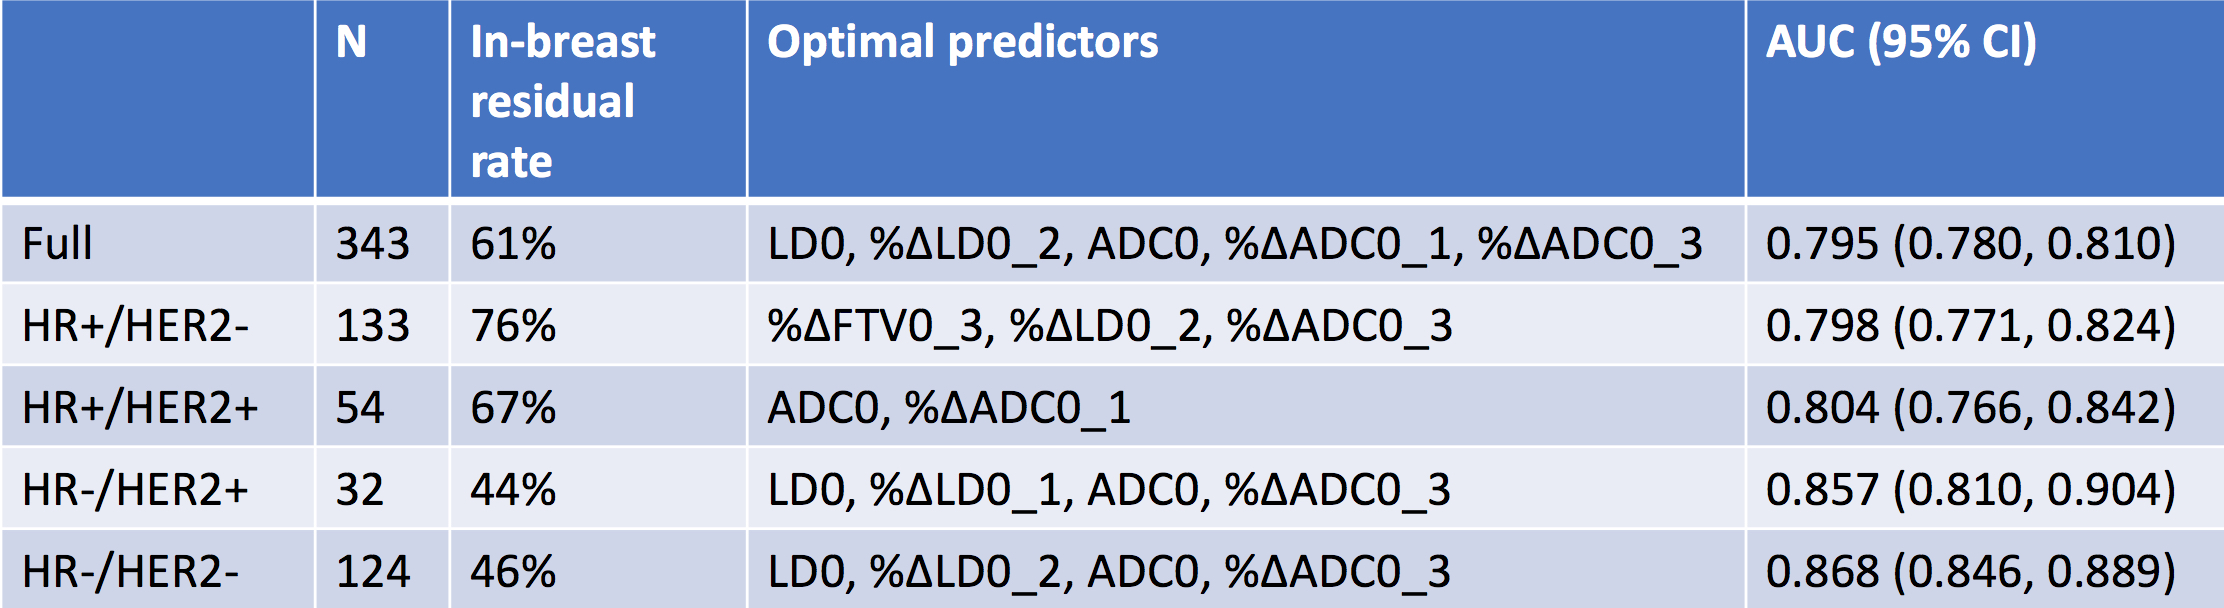
A total cohort of 343 patients (median age: 49, range: 24-71 years old) with LD, FTV and ADC available at all 4 treatment time points were included in the analysis. The number of patients in each HR/HER2 subtype were: HR+/HER2- (N=133), HR+/HER2+ (N=54), HR-/HER2+ (N=32), HR-/HER2- (N=124). All AUCs obtained using LD/FTV/ADC only and the combination of them in the full cohort and in individual subtypes are plotted in Figure 1. It shows that the combination achieved higher AUC than individual measure alone in the full cohort and in HR+/HER2-, HR+/HER2-, HR-/HER2- subtype. It achieved the same AUC as the ADC only in HR+/HER2+. When logistic regression models were built using LD/FTV/ADC only, the highest AUCs were in the range of 0.68-0.75 for FTV only (Figure 2), 0.69-0.79 for LD only (Figure 3), and 0.73-0.85 for ADC only (Figure 4). Figure 5 showed corresponding results by combining all 3 measures together. The range of AUCs of combined models is 0.80-0.87. Variations in AUCs were observed among HR/HER2 subtypes. Figure 2-5 also listed the optimal predictors included in the logistic regression model.Discussion
In breast cancer, neoadjuvant chemotherapy is commonly used to downsize the tumor before surgery, allowing for breast conservation. It also provides the opportunity to use MRI to monitor treatment response during therapy. Our results show that the combination of LD, FTV, and ADC from MRI is superior to using any single measure alone for accurately predicting residual disease at pathology. Our results also suggest that higher AUCs could be achieved if we combined measures from different time points together. However, the results in certain HR/HER2 subtypes (HR+/HER2+ and HR-/HER2+) are limited by sample sizes. Thus, they should be taken with caution until results from larger cohorts are available.Conclusion
Our study demonstrated that combining LD, FTV, ADC from MRI can lead to higher AUCs for predicting residual disease after NAC than using a single measure alone. It also showed that measures taken at various treatment time points, not just pre-surgery, can also better predict the residual disease.Acknowledgements
This work was supported in part by NIH R01 CA132870 and NIH U01 CA225427.References
1. Barker AD, Sigman CC, Kelloff GJ, Hylton NM, Berry DA, Esserman LJ. I-SPY 2: an adaptive breast cancer trial design in the setting of neoadjuvant chemotherapy.Clin Pharmacol Ther. 2009;86(1):97-100.
2. Symmans WF, Peintinger F, Hatzis C, et al. Measurement of residual breast cancer burden to predict survival after neoadjuvant chemotherapy. J Clin Oncol. 2007;25(28):4414-4422.
Figures