0277
Quantification of Benign and Malignant Breast Tumor Cellularity1Radiology, Washington University School of Medicine, Saint Louis, MO, United States, 2Radiology, Changhai Hospital, Shanghai, China, 3Medical Scientist Training Program, The University of Alabama at Birmingham, Birmingham, AL, United States, 4Medicine, University of Missouri – Kansas City, Kansas City, MO, United States, 5Radiology, Guangzhou First People’s Hospital, Guangzhou, China, 6Radiology, The First Affiliated Hospital of Nanchang University, Nanchang, China
Synopsis
Recent consensus suggested that breast MRI lacks the needed sensitivity or specificity to detect breast cancer. Breast cancer over-diagnosis may result in over-treatments. We recently modified diffusion basis spectrum imaging (DBSI) to accurately localize breast cancer lesion and quantify cancer cellularity. Results revealed that modified-DBSI afforded greater diagnostic sensitivity and specificity than ADC in distinguishing between tumor and benign tissues.
Introduction
Breast cancer is the most frequently diagnosed cancer and the second leading cause of cancer death amongst American women.1 Breast MR images, such as gadolinium-enhanced T1-weighted imaging (Gd-T1WI), DCE-MRI and diffusion-weighted imaging (DWI), have been widely used to detect clinically significant breast cancer and to guide biopsies.2 However, false positive diagnoses were common due to overlapping MRI signals from benign tumors, edema, inflammation, and stromal tissues. Apparent diffusion coefficient (ADC) has been used to determine the presence of breast cancer, ADC decreases with increasing cellularity. Yet, ADC-tumor correlation is confounded by the presence of inflammatory cell infiltration and vasogenic edema. The modified-DBSI models diffusion-weighted MRI signals as a combination of an anisotropic diffusion tensor reflecting stromal tissues and a spectrum of highly-restricted (lymphocytes), restricted (cancer cells) and hindered (edema) isotropic-diffusion tensors. Results suggest modified-DBSI accurately delineates malignant breast tumor and quantifies tumor cellularity.Materials and Methods
Total 95 patients with clinical suspicion of breast cancer and without preoperative treatment were recruited. After biopsy, we confirmed 21 patients with benign tumors and 74 patients with malignant tumors (Table 1). Among all malignant tumors, 64 were invasive ductal carcinoma (IDC). DWI data was obtained through a 3T GE scanner with an 8-channel phased-array breast receive coil. Single-shot echo-planar DWI was performed in transverse view (1.5×1.5×5 mm3) using a 25-direction diffusion-encoding scheme (maximum b-value of 1500 s/mm2) in 8 minutes. An in-house software performed both modified-DBSI and DTI analyses. Standard multi-parametric MRI were obtained for all patients. All tumor lesions and benign regions were based on Gd-T1W images and defined by an experienced radiologist. Tumor tissues were obtained for sectioning and staining after mastectomy. Specimens were embedded in paraffin and sectioned in 4-µm thick slices for H&E staining.Results
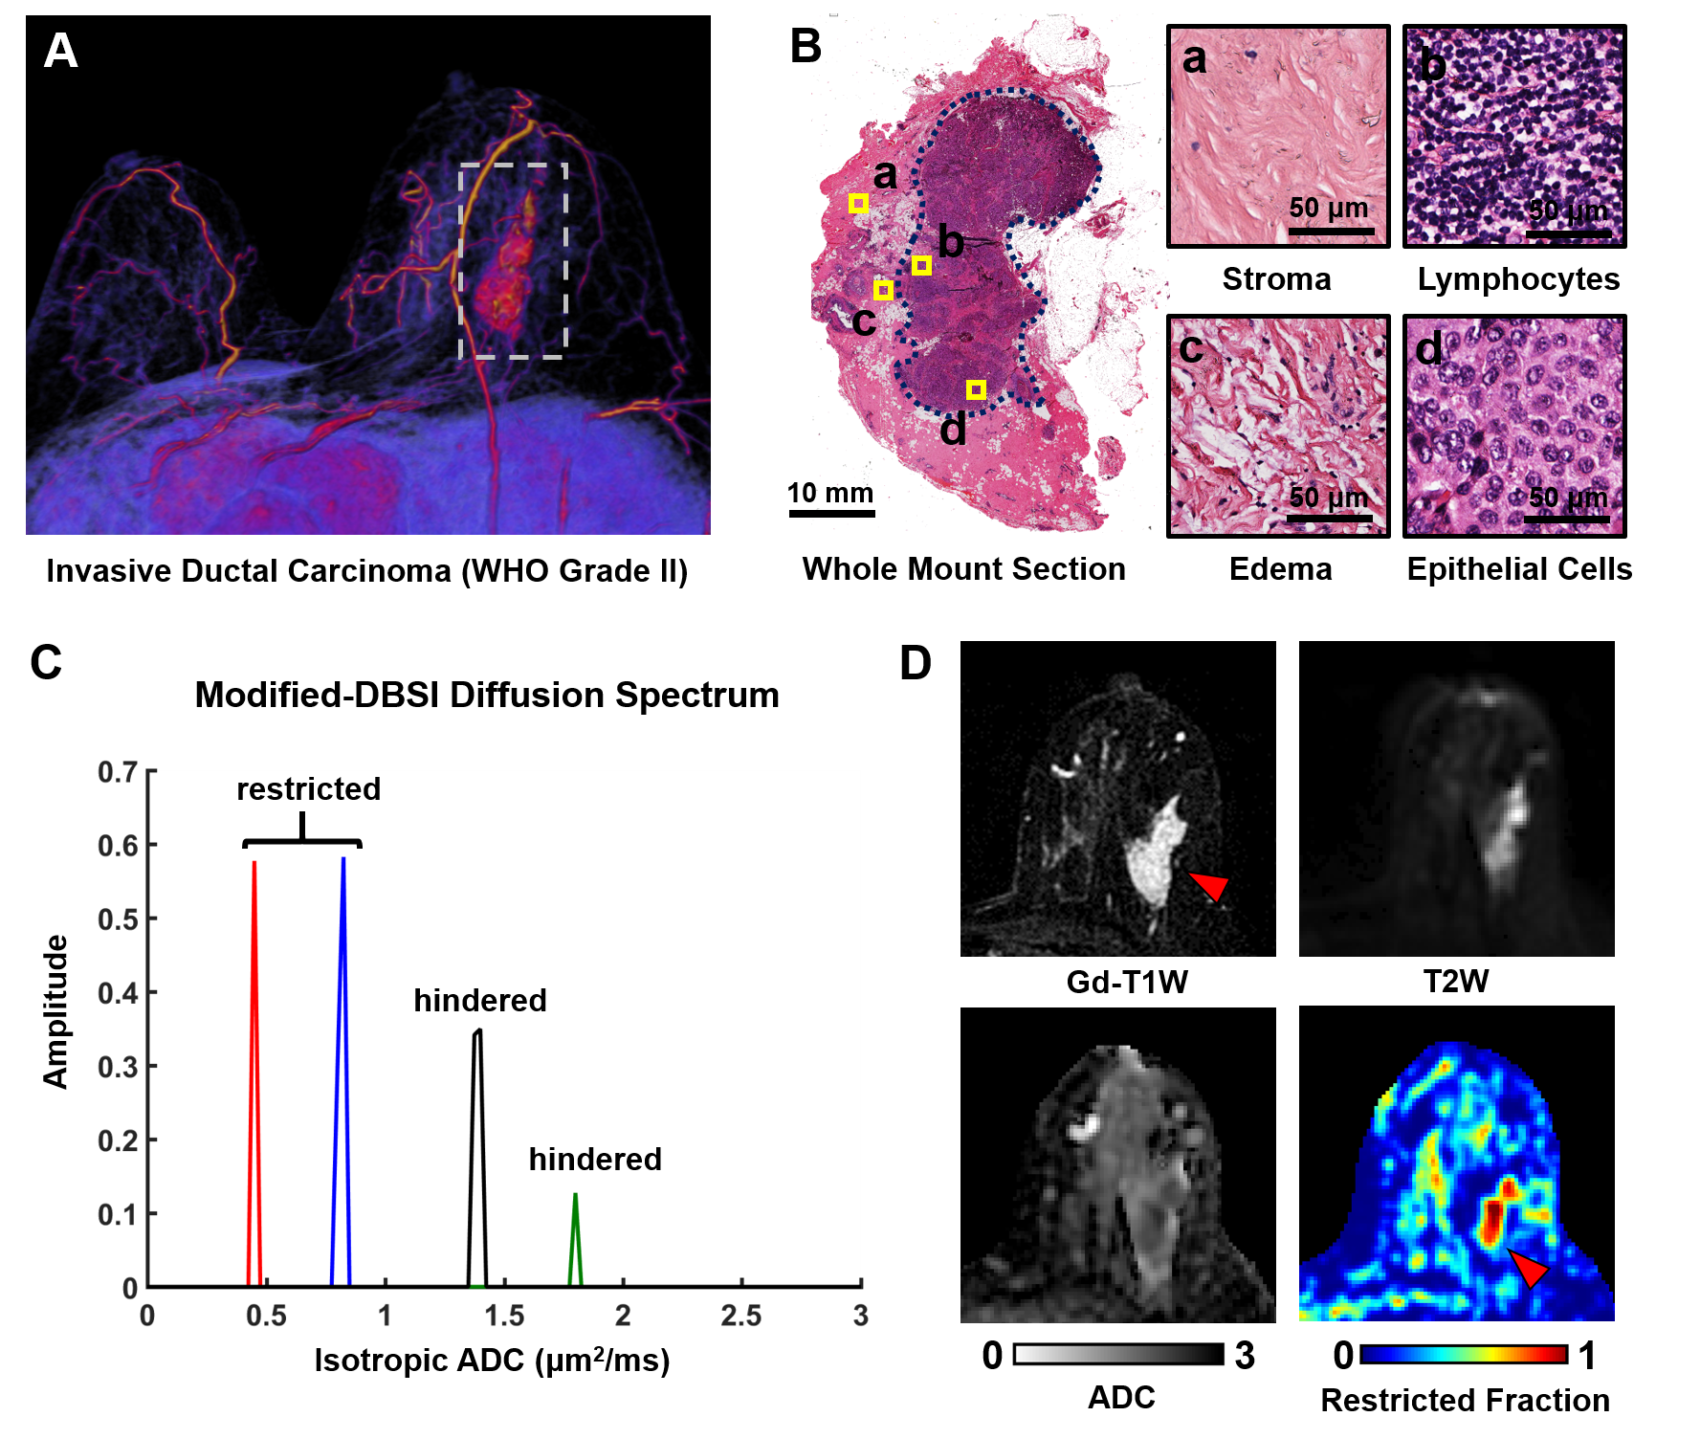
Three dimensional reconstruction of Gd-T1WI indicated a tumor nodule in right breast of a 57-year-old patient with IDC (WHO Grade II). The tumor nodule was surgically removed and then whole mount section was performed. H&E analysis identified malignant tumor in the central part of the nodule (Fig. 1B), along with heterogeneous histopathology including stroma, lymphocytes, hyper-cellularity tumor, and vasogenic edema (Fig. 1B). Modified-DBSI revealed different diffusion signatures from various regions within Gd-enhanced regions in T1W image (Fig. 1C). Gd-T1WI overestimated malignant tumor portion (Fig. 1D) by including peritumoral edema and benign tissues. T2WI and ADC could not conclusively outline the tumor lesion. Modified-DBSI restriction fraction detected high tumor cellularity (Fig. 1F) that is consistent with H&E result.
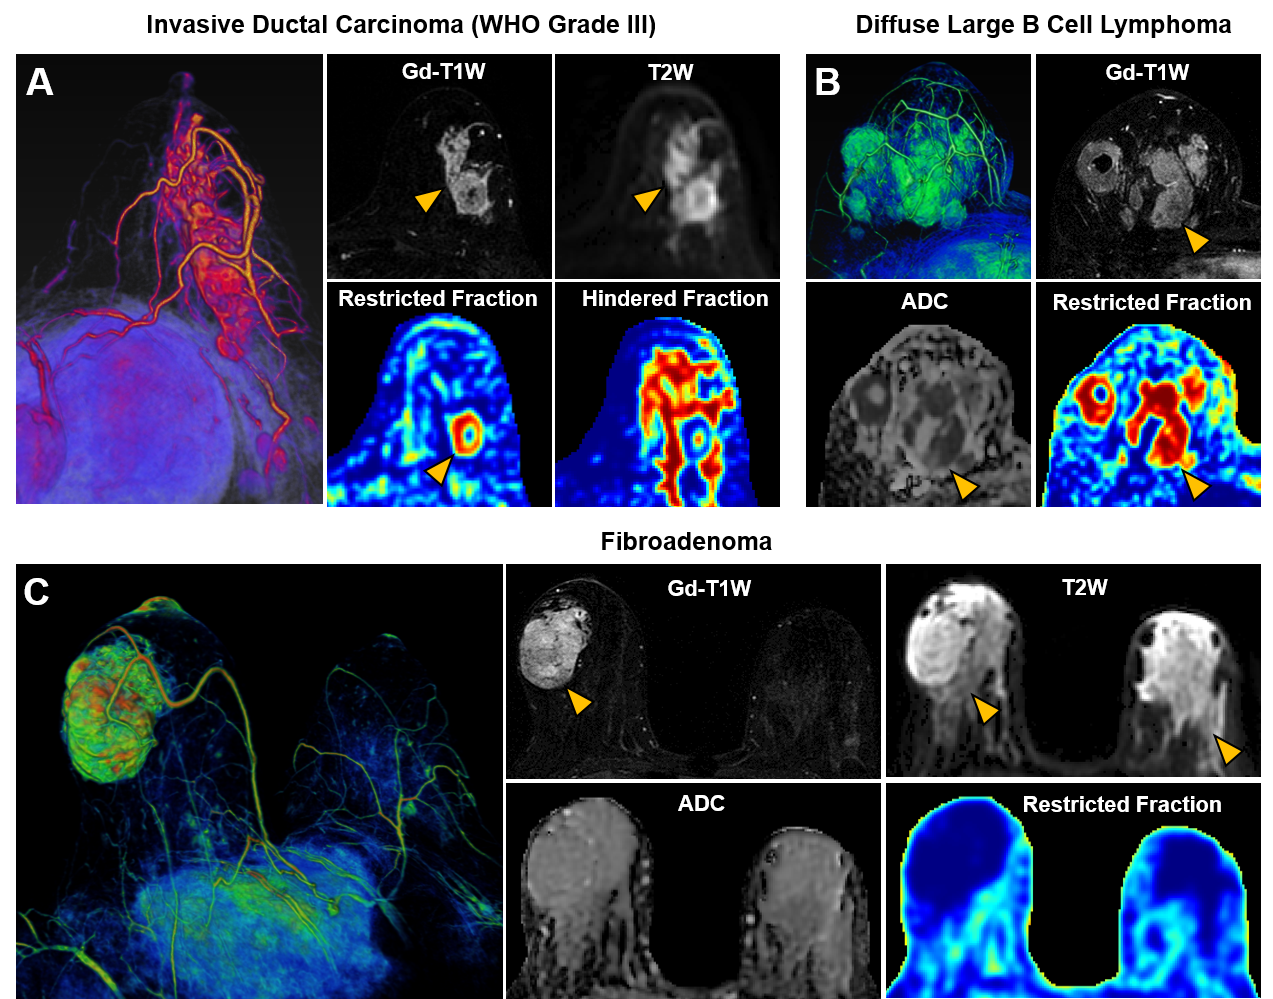
In another case of a 53-year-old patient with Grade III IDC, Gd-enhanced T1W and T2W images displayed a tumor region larger than lesion indicated by both ADC and modified-DBSI restricted-fraction (Fig. 2A). Modified-DBSI hindered-fraction map revealed peri-tumoral edema and possible central necrosis. In the case of a 39-year-old patient with diffuse large B cell lymphoma (Fig. 2B), lesion areas indicated by Gd-enhanced T1WI, T2WI, ADC map and restricted-fraction were in close agreement; the overall high cellularity of lymphoma might explain the consistency. In the case of a 68-year-old patient with firboadenoma, T1W showed Gd-enhancement on the left breast, contradicting with the T2W finding that showed hyperintensity on both breast; restricted-fraction indicated negative maignant tumor presence on both breasts (Fig. 2C).
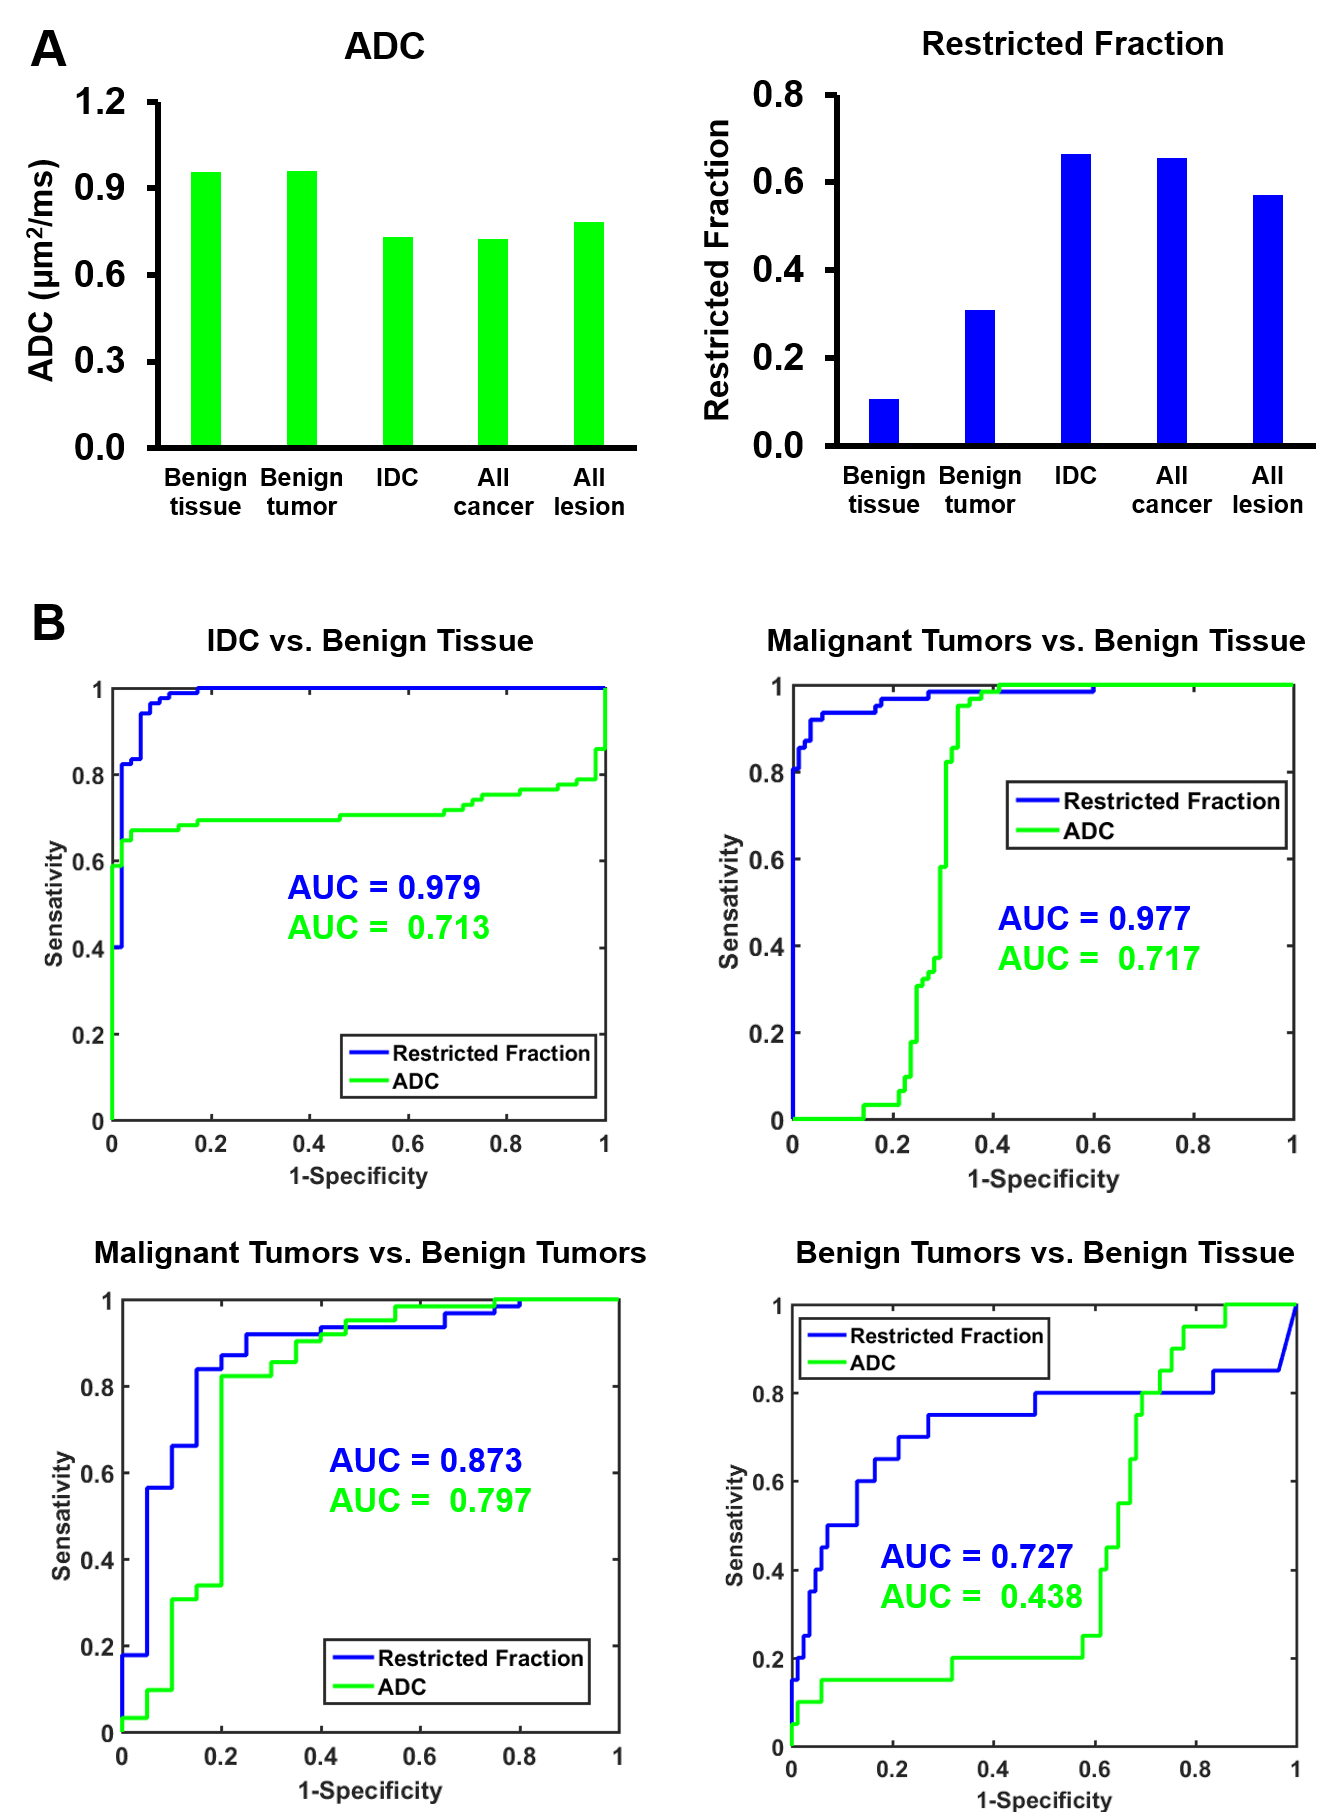
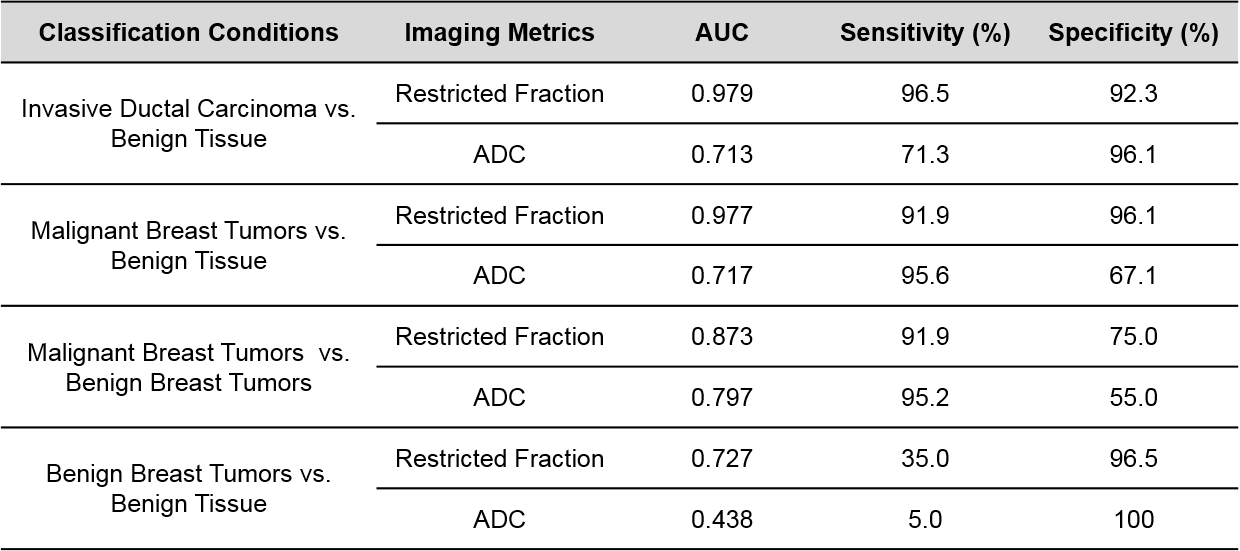
ADC values differed very little between benign tissue and invasive ductal carcinoma (0.95±0.34 vs. 0.82±0.20, p=0.06). Difference of ADC values between benign tissue and malignant tumors (0.93±0.34 vs. 0.84±0.27, p=0.19) were also insignificant. DBSI restricted-fractions values increased significantly for both invasive ductal carcinoma (0.47±0.18 vs. 0.17±0.16, p<0.01) and all breast tumors (0.41±0.24 vs. 0.19±0.15, p<0.01) from that of benign tissue (Fig. 3). ROC analysis of DBSI and of ADC (Fig. 3) demonstrated that DBSI restricted fraction more effectively differentiated IDC from benign tissue (AUC=0.979 vs. AUC=0.713), malignant tumors from benign tissue (AUC=0.977 vs. AUC=0.717), malignant tumors from benign tumors (AUC=0.873 vs. AUC=0.797), and benign tumors from benign tissue (AUC=0.727 vs. AUC=0.438).
Discussion and Conclusion
Gd-enhanced T1WI detects breast cancer with high sensitivity but comes at the expense of over-diagnosing breast cancer. Gd-contrast agent indiscriminately enhances benign and inflammatory tissues, along with malignant lesion. The common leakage of contrast agents into peri-tumoral edema and adjacent benign tissues also tends to present oversized lesions. ADC was widely used to assess restricted diffusion caused by increased tumor cellularity, although ADC-based diagnoses are prone to false positive diagnosis caused by confounding effects from stroma and inflammation. Modified-DBSI counters these shortcomings by specifically modelling individual microstructures with their distinct diffusion signatures, allowing an accurate reflection of the diffusion distribution of each microstructure. Here, we demonstrated how DBSI restricted fraction more accurately delineated breast cancer than other MRI methods.Acknowledgements
This work was supported in part by NIH R01-NS047592, P01-NS059560, U01-EY025500, National Multiple Sclerosis Society (NMSS) RG 5258-A-5, RG 1701-26617, and Department of Defense Idea Award W81XWH-12-1-0457.References
1. DeSantis CE, Ma J, Goding Sauer A, Newman LA, Jemal A. Breast cancer statistics, 2017, racial disparity in mortality by state. CA: a cancer journal for clinicians. Nov 2017;67(6):439-448.
2. Marino MA, Helbich T, Baltzer P, Pinker-Domenig K. Multiparametric MRI of the breast: A review. Journal of magnetic resonance imaging: JMRI. Jun 22 2017.
Figures