0269
Portable, single-sided magnetic resonance sensor for hydration status assessment via multicomponent T2 relaxometry1Electrical Engineering & Computer Science, Massachusetts Institute of Technology, Cambridge, MA, United States, 2David H. Koch Institute For Integrative Cancer Research, Massachusetts Institute of Technology, Cambridge, MA, United States, 3Department of Materials Science and Engineering, Massachusetts Institute of Technology, Cambridge, MA, United States
Synopsis
Undiagnosed dehydration compromises health outcomes across many populations including the elderly, infants, soldiers and athletes. Here we introduce a miniature (~1000 cm3), portable (~4 kg), single-sided magnetic resonance (MR) sensor capable of identifying and quantifying fluid loss induced by dehydration. Multicomponent T2 relaxometry of skeletal muscle tissue enables the measurement of distinct fluid compartments. We first quantify fluid loss induced by dehydration with multicomponent T2 relaxometry using a standard MRI. We then extend these findings and demonstrate a portable, low-field MR sensor exhibits comparable performance via a similar measurement while offering significantly reduced sensor mass, measurement time, and system complexity.
Background and Purpose
Dehydration is associated with increased hospitalization and mortality, substandard postoperative outcomes, and decreased cognitive and physical performance [1–5]. Existing approaches towards identifying dehydration often require invasive sampling of bodily fluids or are easily confounded by external factors limiting widespread adoption [6].
We introduce a miniaturized (~1000 cm3), portable (~4 kg), single-sided magnetic resonance (MR) sensor. The primary component of this sensor (Figure 1) is an array of permanent magnets [7]. The sensor is capable of performing accurate multicomponent T2 relaxometry via CPMG measurements (Figure 2). We developed a mouse model of thermal dehydration and validated a shift in fluid from the lean tissue compartment via whole-body NMR (Figure 3). T2 relaxometry performed with both standard MRI (Figure 4) and our portable MR sensor (Figure 5) demonstrated that the MR signal produced by the slow component of muscle tissue can quantify fluid loss induced by dehydration.
Methods and Results
Portable, miniature, single sided MR sensor design and characterization
A portable, single sided MR sensor was designed and constructed with a permanent magnet array to generate a static magnetic field (B0) based on the Unilateral Linear Halbach array (Figure 1a-b) [7]. The sweet spot magnet design allows for high sensitivity measurements over a large uniform region using a field parallel to the surface of the sensor. The magnet produces a uniform region with a field strength of 0.28 Tesla located 2 to 7 mm from the surface of the sensor (Figure 1c). The sensitive region was characterized by scanning a small aqueous sample and spans a 12 x 5 x 2 mm region located directly above the RF coil (Figure 1d-e).
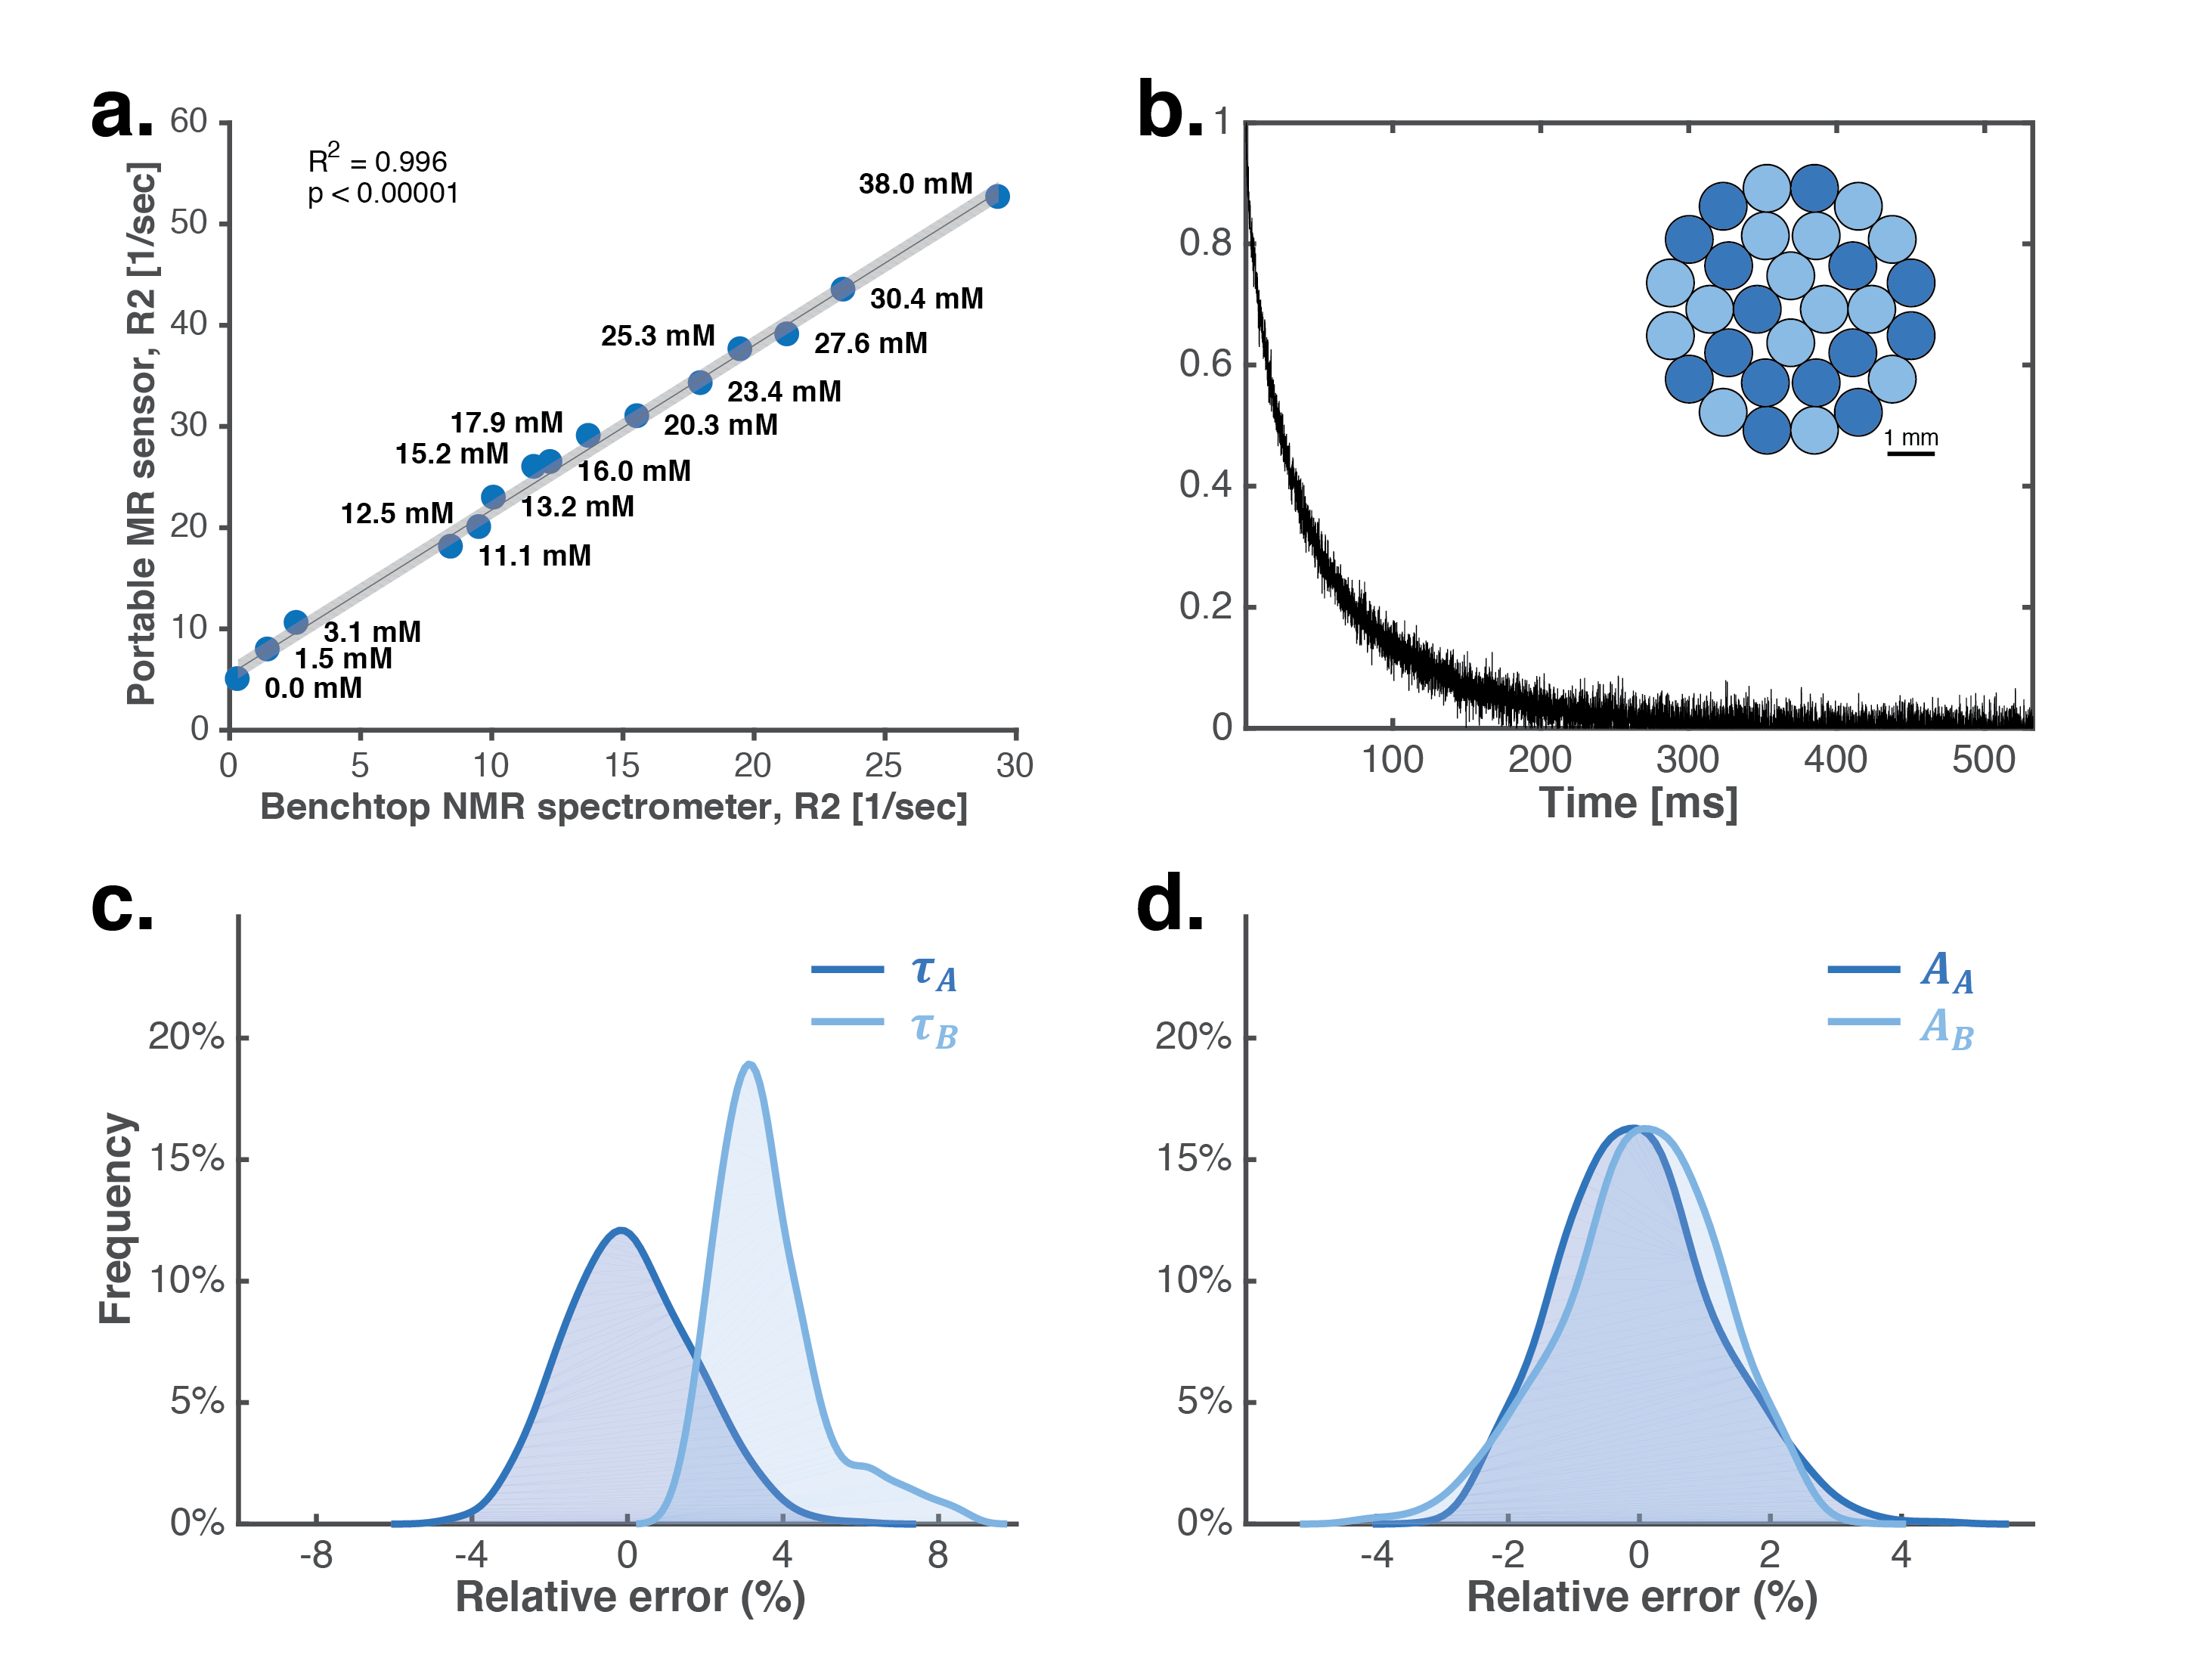
The portable MR sensor accurately measures T2 relaxation rate of a paramagnetic solution (aqueous CuSO4) via CPMG as validated by benchtop NMR spectrometry (minispec mq7.5, Bruker, USA) (Figure 2a). A heterogeneous phantom consisting of two distinct solutions with unique T2 relaxation rates was measured with CPMG using the portable MR sensor (Figure 2b). Multicomponent T2 relaxometry successfully extracts the relaxation times and relative amplitudes of each component accurately and reproducibly via a biexponential model (Figure 2c-d). We utilize this ability to quantify distinct fluid compartments using multicomponent T2 relaxometry to measure changes in the distribution of fluid within tissue.
Mouse model of thermal dehydration with whole animal NMR validation
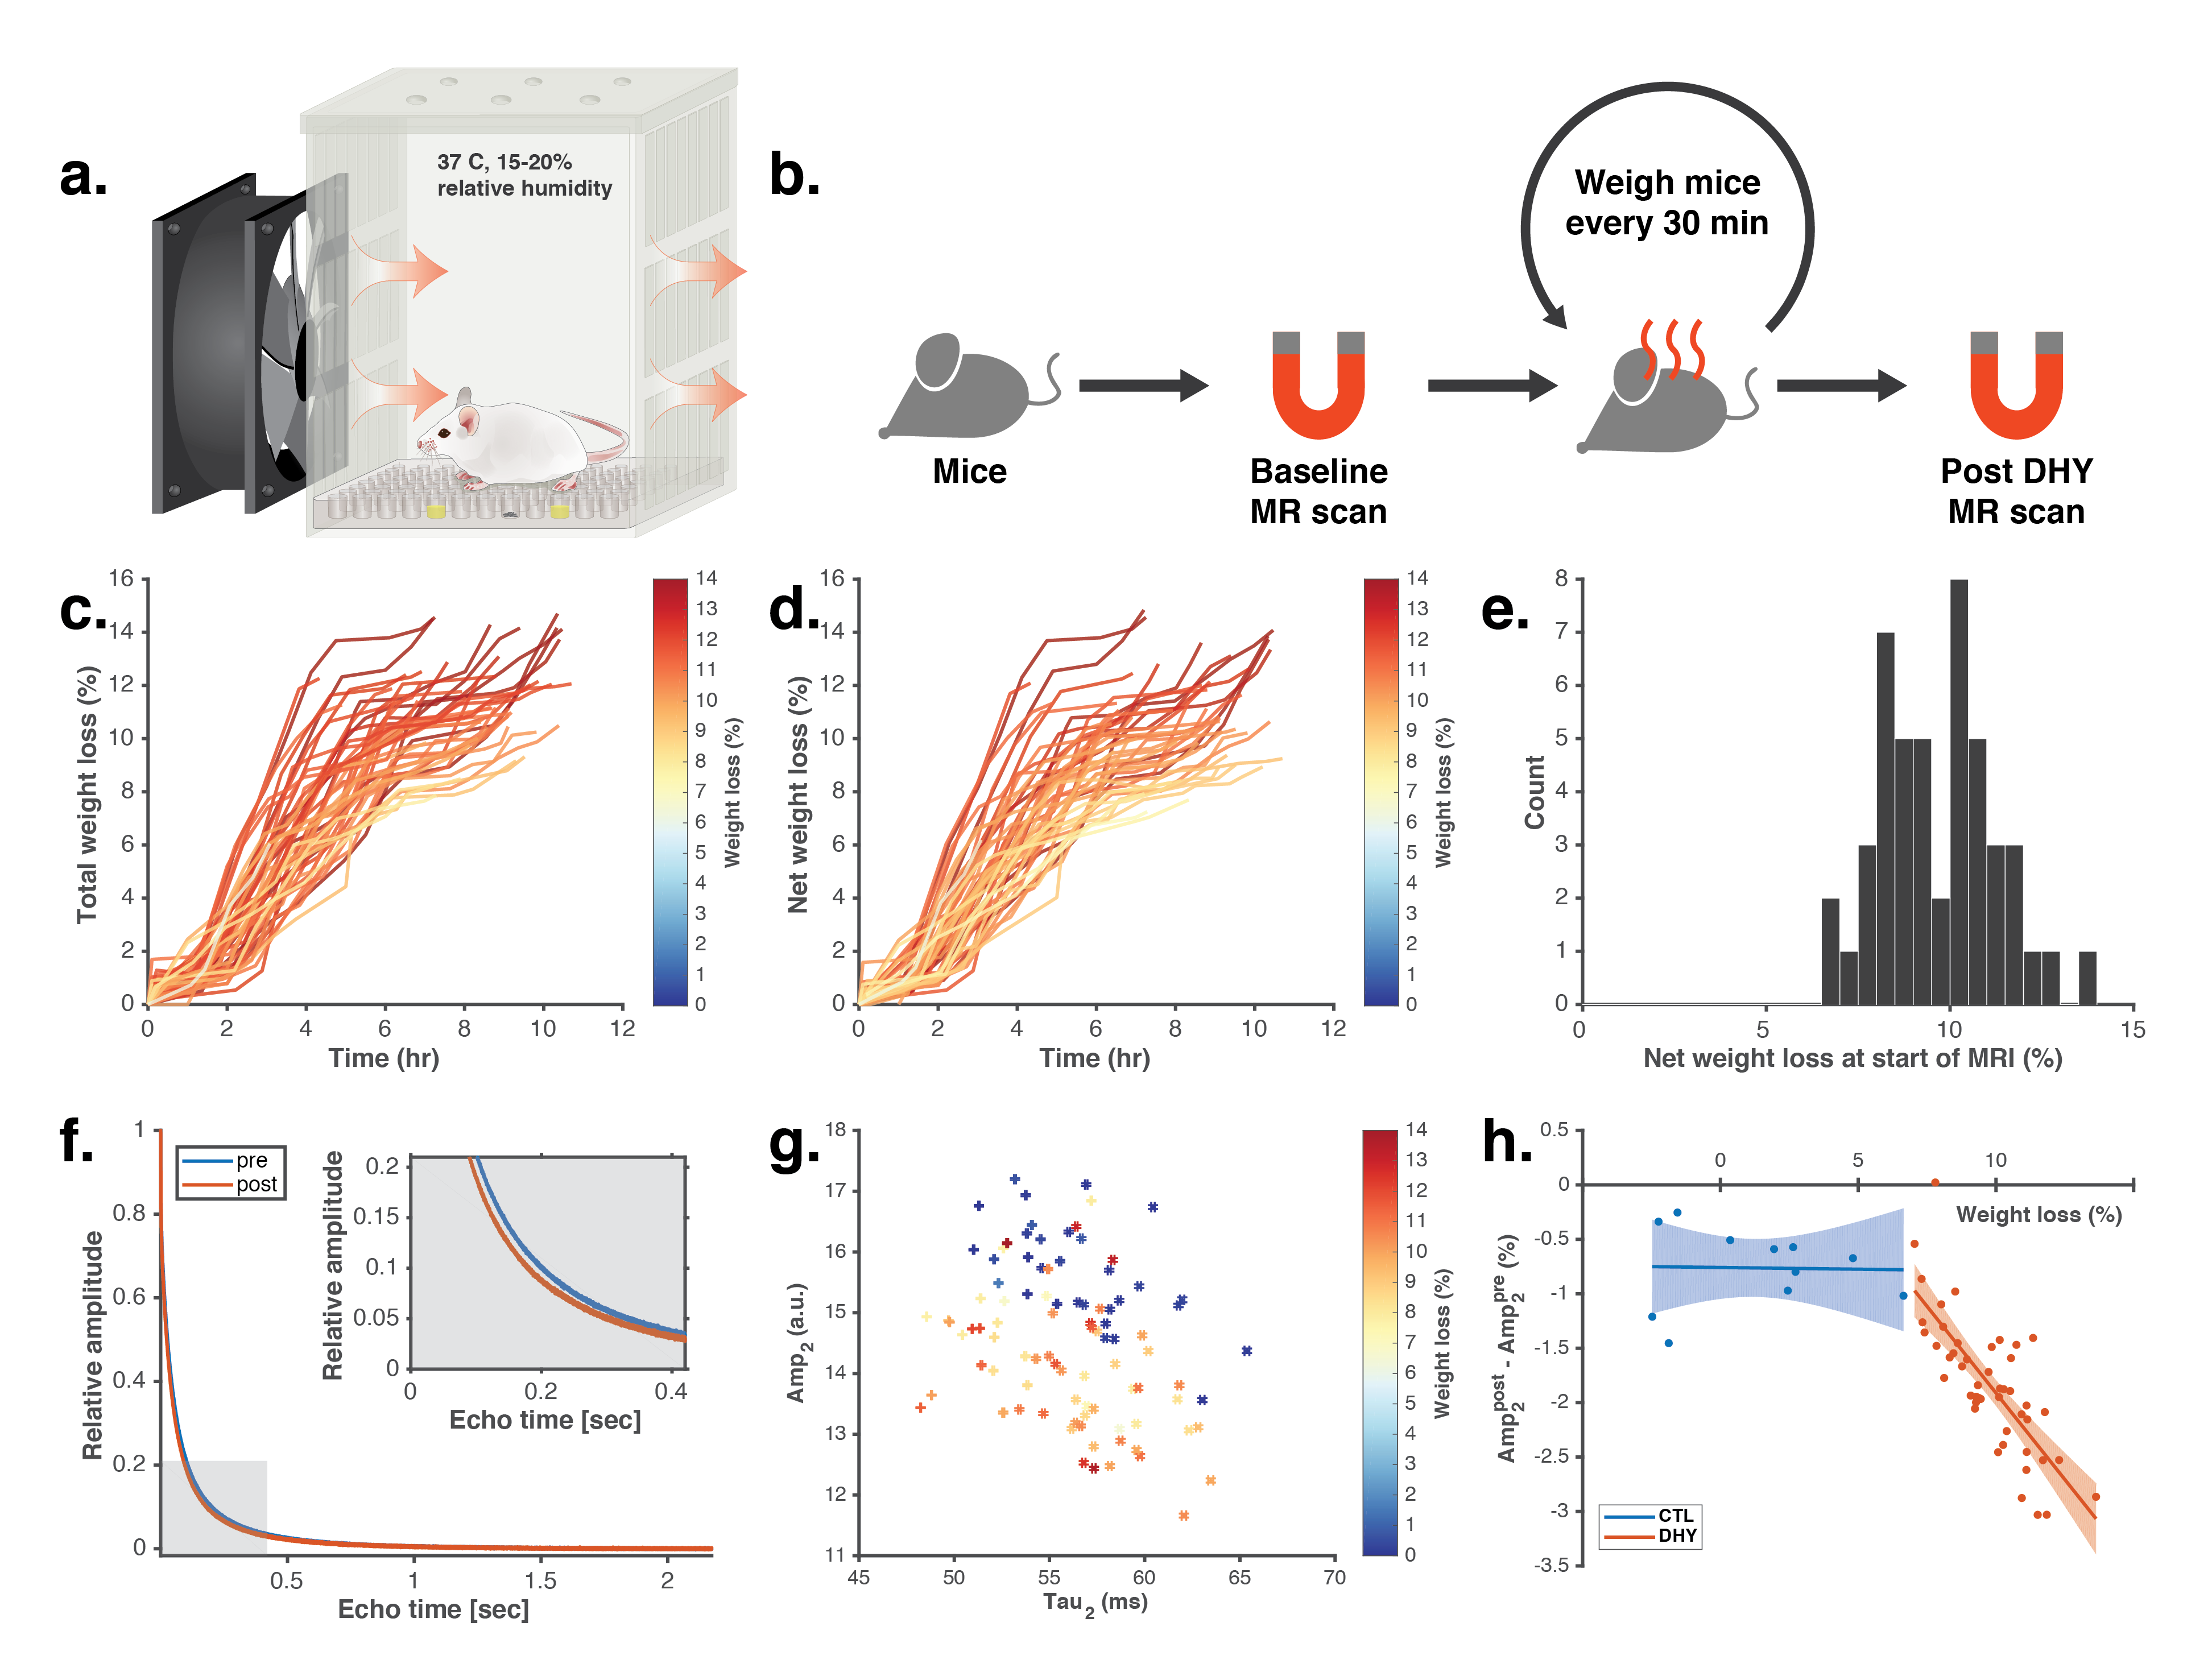
We utilized a mouse model of thermal dehydration via fluid restriction, elevated temperatures, high airflow, and low humidity (Figure 3a-b). This induced between 7 and 14% body weight loss over 5 to 10 hours (Figure 3c-e). Multicomponent T2 relaxometry performed via benchtop NMR relaxometry identified and quantified fluid loss in dehydrated mice via a decrease in the relative amplitude of the relaxation component assigned to lean muscle tissue (Figure 3f-h) [8]. This validated the mouse model and motivated further investigation into a dehydration measurement localized solely to muscle tissue [9].
T2 relaxometry with MRI localized to the muscle quantifies fluid depletion
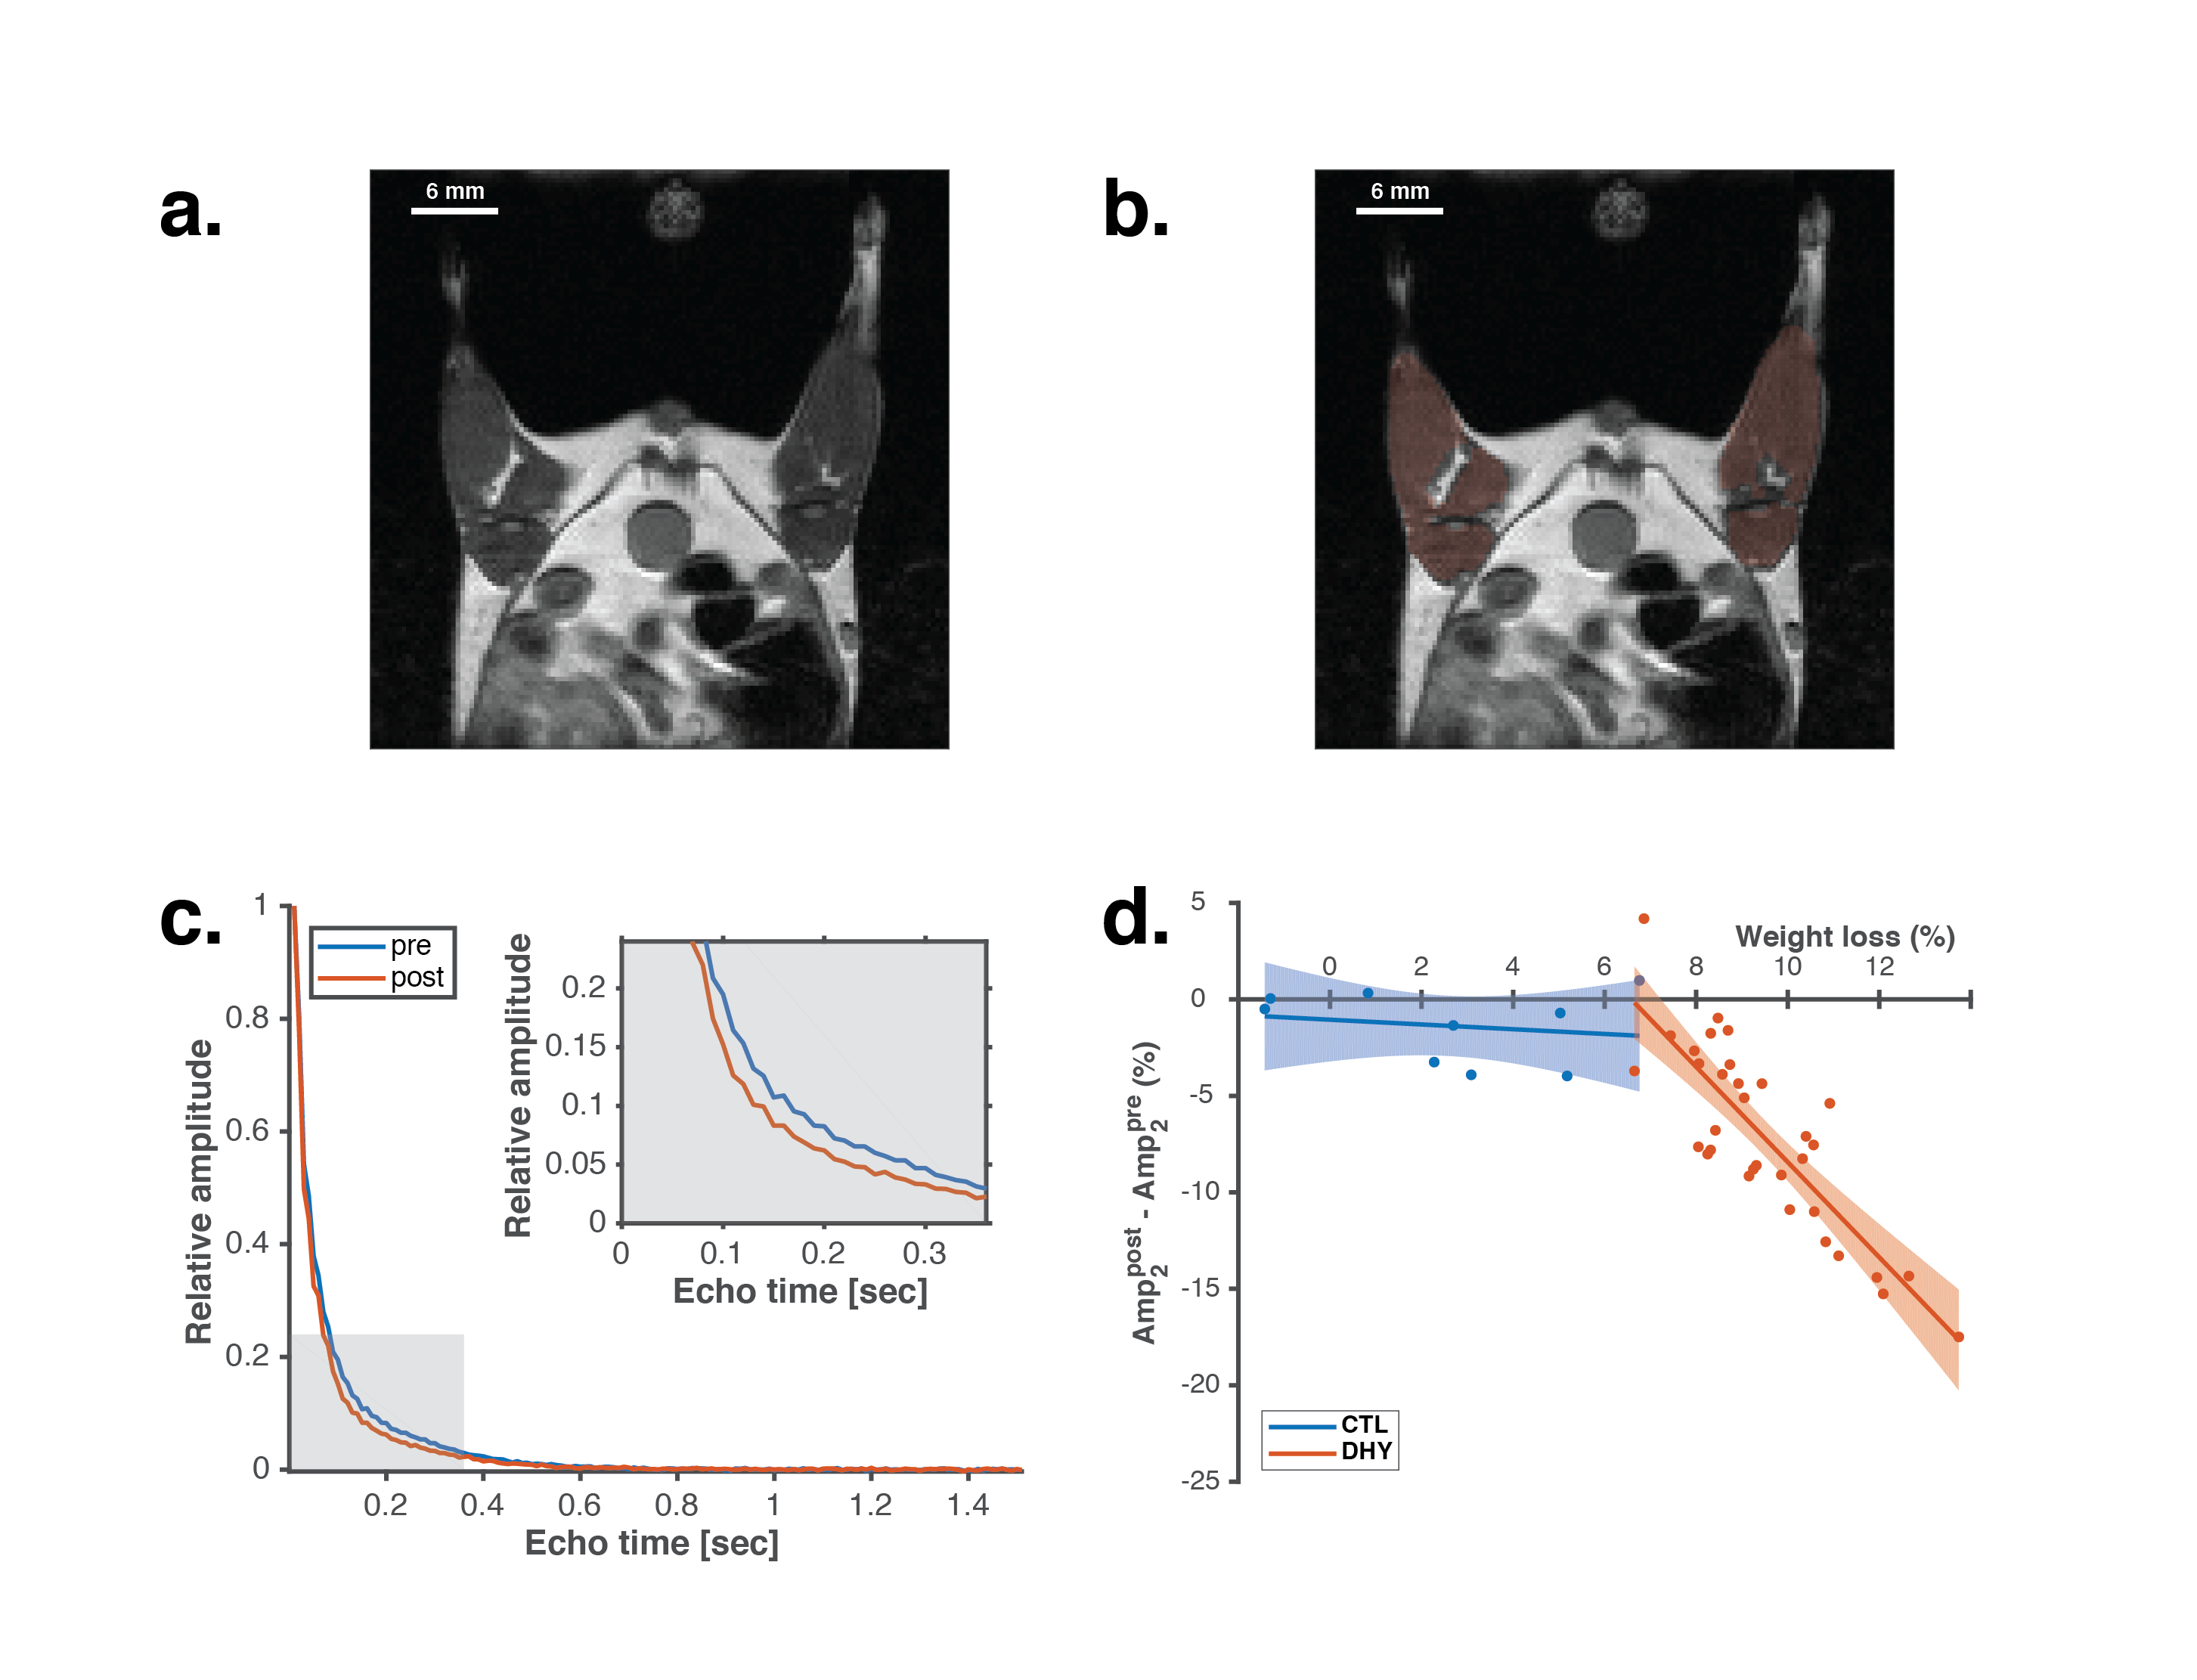
T2-weighted MRI scans of the upper leg of mice were used to draw regions-of-interest on muscle tissue (Figure 4a-b). A composite T2 decay signal was formed from voxels corresponding to muscle tissue (Figure 4c). A decrease in the relative amplitude of the slow component in a biexponential fit predicts fluid loss induced by dehydration (Figure 4d). We demonstrate that a multicomponent T2 measurement localized to the muscle is capable of quantifying dehydration of the entire animal.
T2 relaxometry with portable MR sensor quantifies fluid depletion
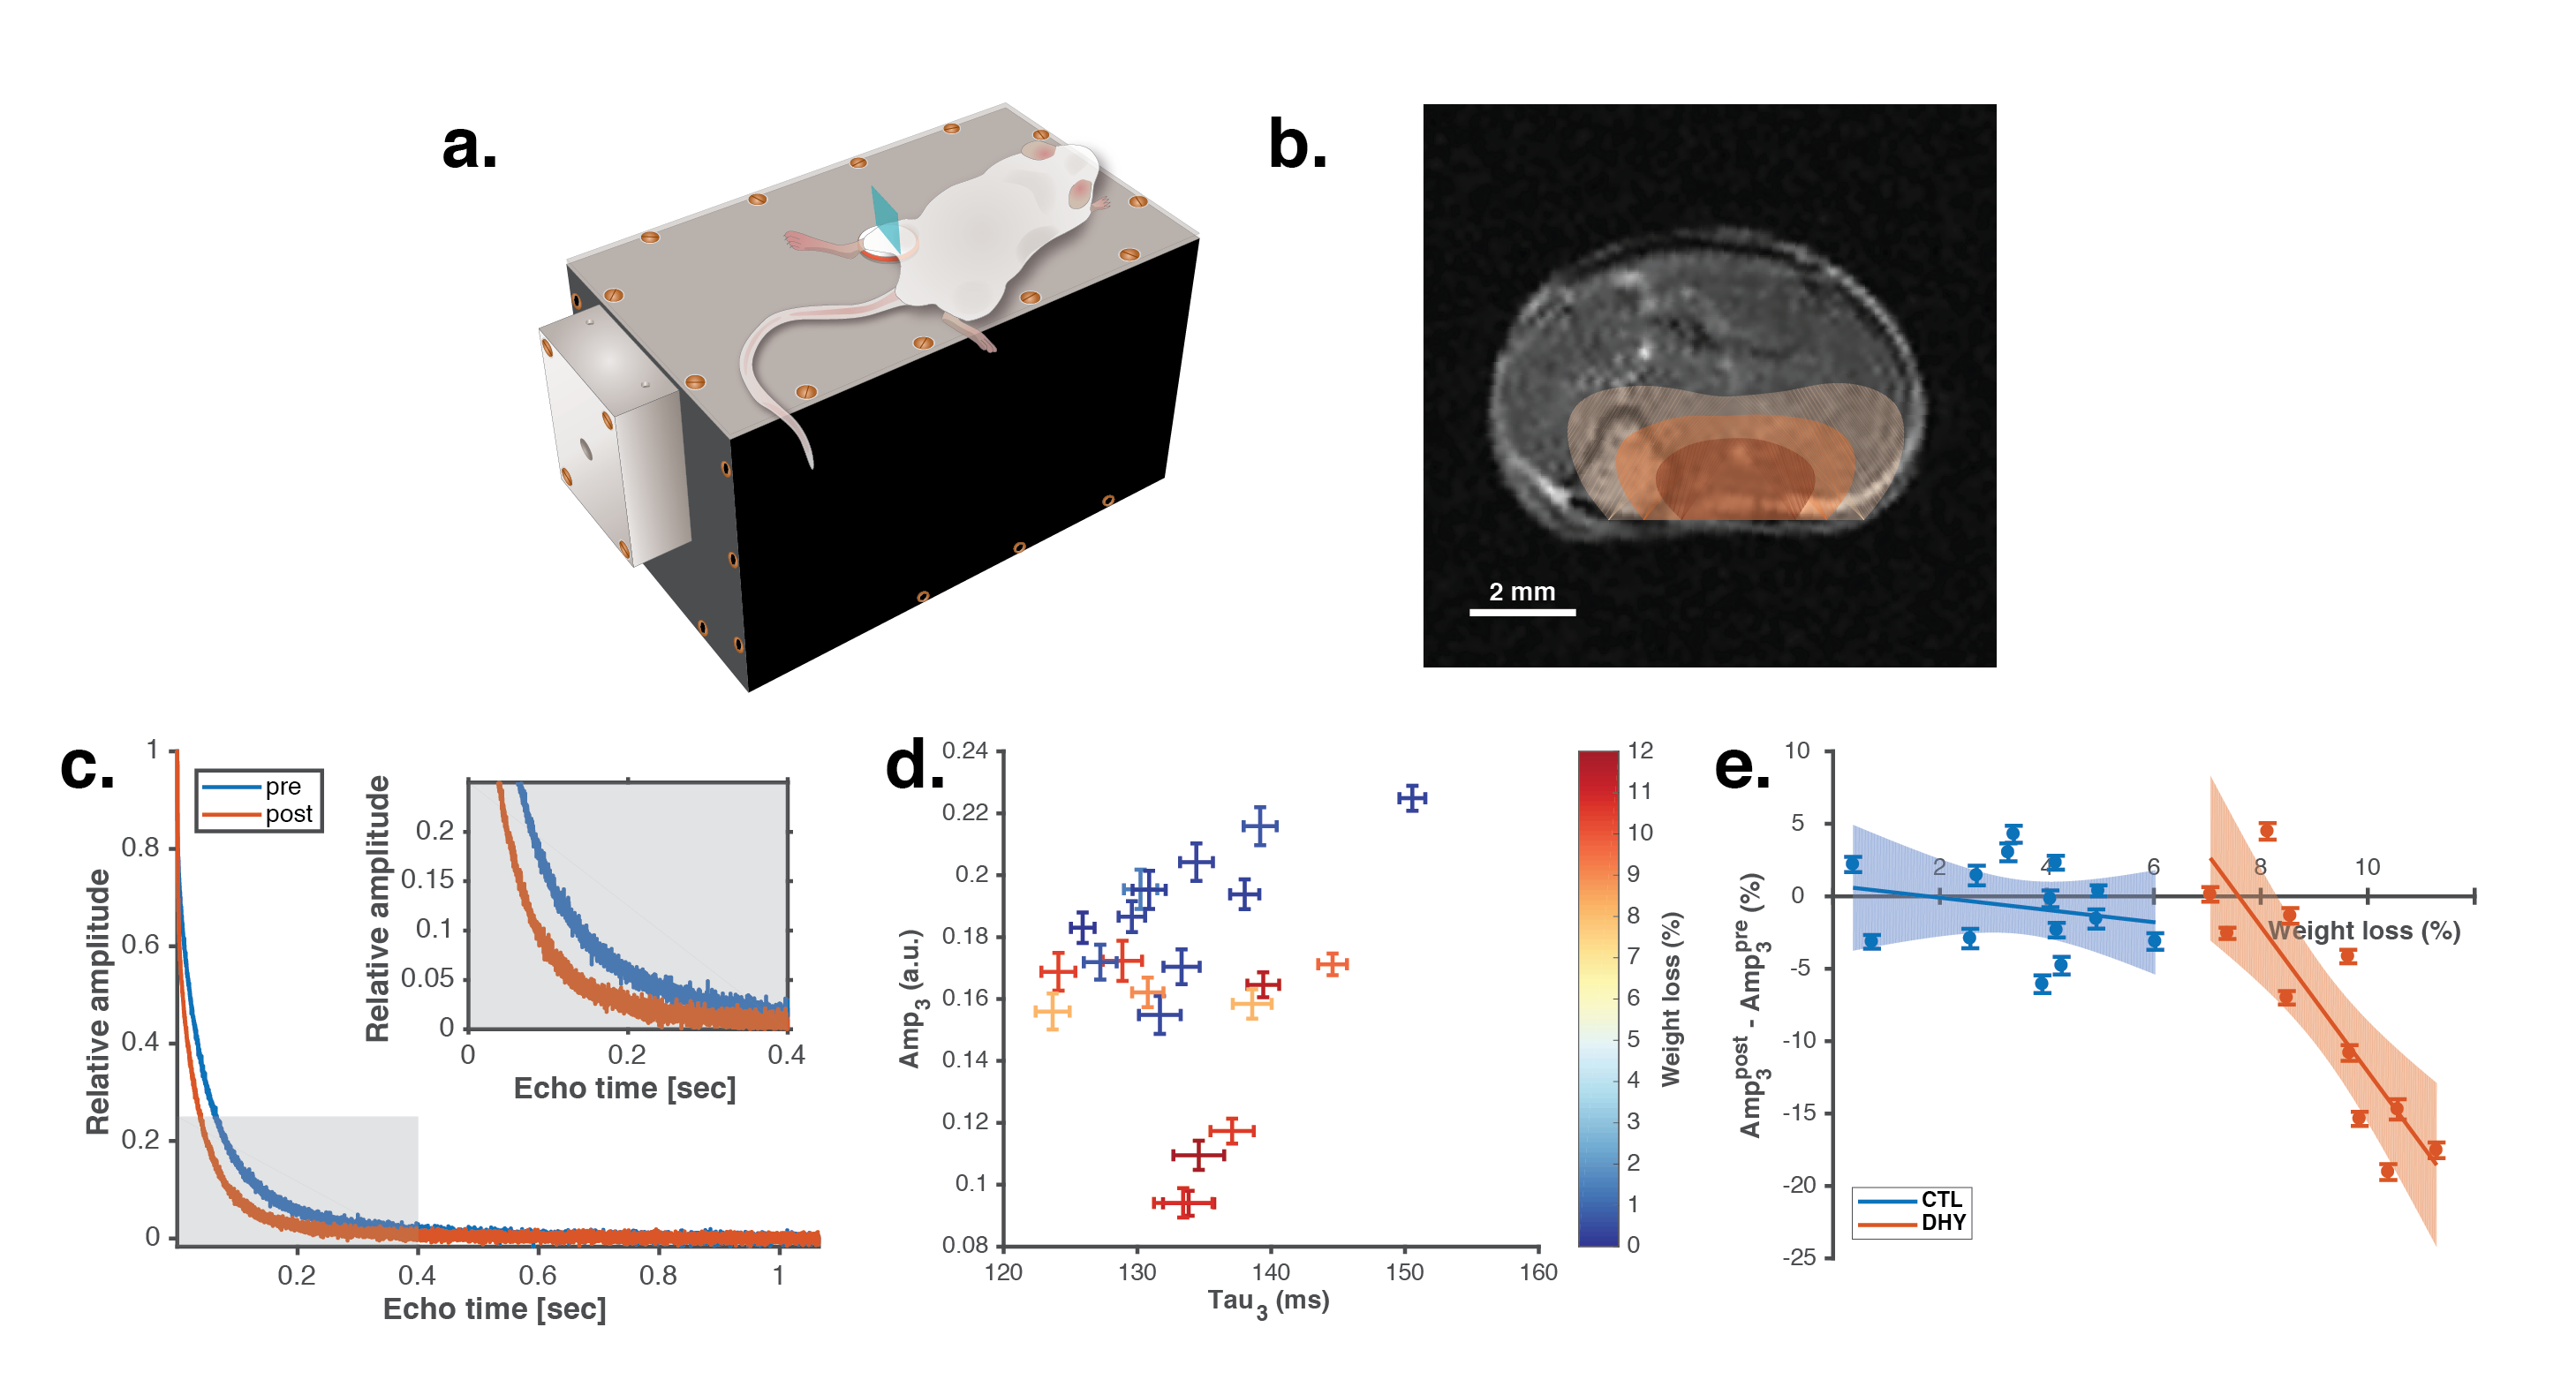
T2 relaxometry was performed using our portable MR sensor on the upper leg of a mouse (Figure 5a). The signal primarily originated from the muscle tissue with some contribution from subcutaneous tissue and bone (Figure 5b). A decrease in the relative amplitude of the slow relaxation component in a triexponential fit of a CPMG measurement localized to the muscle quantified fluid loss induced by dehydration (Figure 5c-e).
Discussion and Conclusion
Our measurement of the relative volumes of tissue fluid compartments provides an indicator of fluid depletion. We first demonstrate that localizing multicomponent T2 relaxometry to muscle tissue, via a standard MRI, is capable of measuring dehydration as a shift in amplitude of the free fluid compartment. We then demonstrate that our portable MR sensor can make a comparable measurement.
Performing multicomponent T2 relaxometry localized to the skeletal muscle with a miniaturized MR sensor provides a novel, portable, non-invasive, physiologically relevant indicator of fluid loss induced by dehydration. Portable MR sensors have the potential for widespread adoption in reliable, real-time fluid volume status monitoring.
Acknowledgements
We thank the Koch Institute Swanson Biotechnology Center for technical support, specifically whole animal imaging core facility. We thank Gregory Ekchian, Richard Joshua Murdock, Max Cotler, Kriti Subramanyam, Jason Stockmann, Matt Rosen, Jacob White, and Elfar Adalsteinsson for helpful discussions; Elizabeth Zhang, Connor Stashko, Alex Lim, and Brooke McGoldrick for assistance with instrumentation and experimental support. Funding: This work was supported in part by MIT Institute for Soldier Nanotechnologies (United States Army Research Office Grant W911NF-13D-0001); National Institutes of Health – National Cancer Institute Centers of Cancer Nanotechnology Excellence Grant U54 CA151884-02, and the Koch Institute Support (core) grant P30-CA14051 from the National Cancer Institute. AB was supported by a Fannie & John Hertz Foundation Graduate Fellowship and a National Science Foundation Graduate Fellowship.References
[1] D.G. Seymour, P.J. Henschke, R.D.T. Cape, A.J. Campbell, Acute confusional states and dementia in the elderly: the role of dehydration/volume depletion, physical illness and age, Age Ageing. 9 (1980) 137–146.
[2] H.Y.L. Chan, A.
Cheng, S.S.S. Cheung, W. Pang, W. Ma, L. Mok, W. Wong, D.T.F. Lee, Association
between dehydration on admission and postoperative complications in older
persons undergoing orthopaedic surgery, J. Clin. Nurs. (2018).
[3] R.
Lavizzo‐Mourey, J. Johnson, P. Stolley, Risk factors for dehydration among
elderly nursing home residents, J. Am. Geriatr. Soc. 36 (1988) 213–218.
[4] D.R. Thomas,
T.R. Cote, L. Lawhorne, S.A. Levenson, L.Z. Rubenstein, D.A. Smith, R.G.
Stefanacci, E.G. Tangalos, J.E. Morley, D. Council, Understanding clinical
dehydration and its treatment, J. Am. Med. Dir. Assoc. 9 (2008) 292–301.
doi:10.1016/j.jamda.2008.03.006.
[5] J.L. Warren,
W.E. Bacon, T. Harris, A.M. McBean, D. Foley, C. Phillips, The burden and
outcomes associated with dehydration among US elderly, 1991., Am. J. Public Health.
84 (1994) 1265–1269.
[6] S.N. Cheuvront,
R.W. Kenefick, Dehydration: Physiology, assessment, and performance effects,
Compr. Physiol. 4 (2014) 257–285. doi:10.1002/cphy.c130017.
[7] A. Bashyam, M.
Li, M.J. Cima, Design and experimental validation of Unilateral Linear Halbach
magnet arrays for single-sided magnetic resonance, J. Magn. Reson. (2018).
[8] M. Li, C.C.
Vassiliou, L.A. Colucci, M.J. Cima, (1)H nuclear magnetic resonance (NMR) as a
tool to measure dehydration in mice., NMR Biomed. 28 (2015) 1031–9.
doi:10.1002/nbm.3334.
[9] J. Journal, H.
Nose, Distribution of Water Losses Tissues under Thermal, (1983) 1019–1029.
Figures
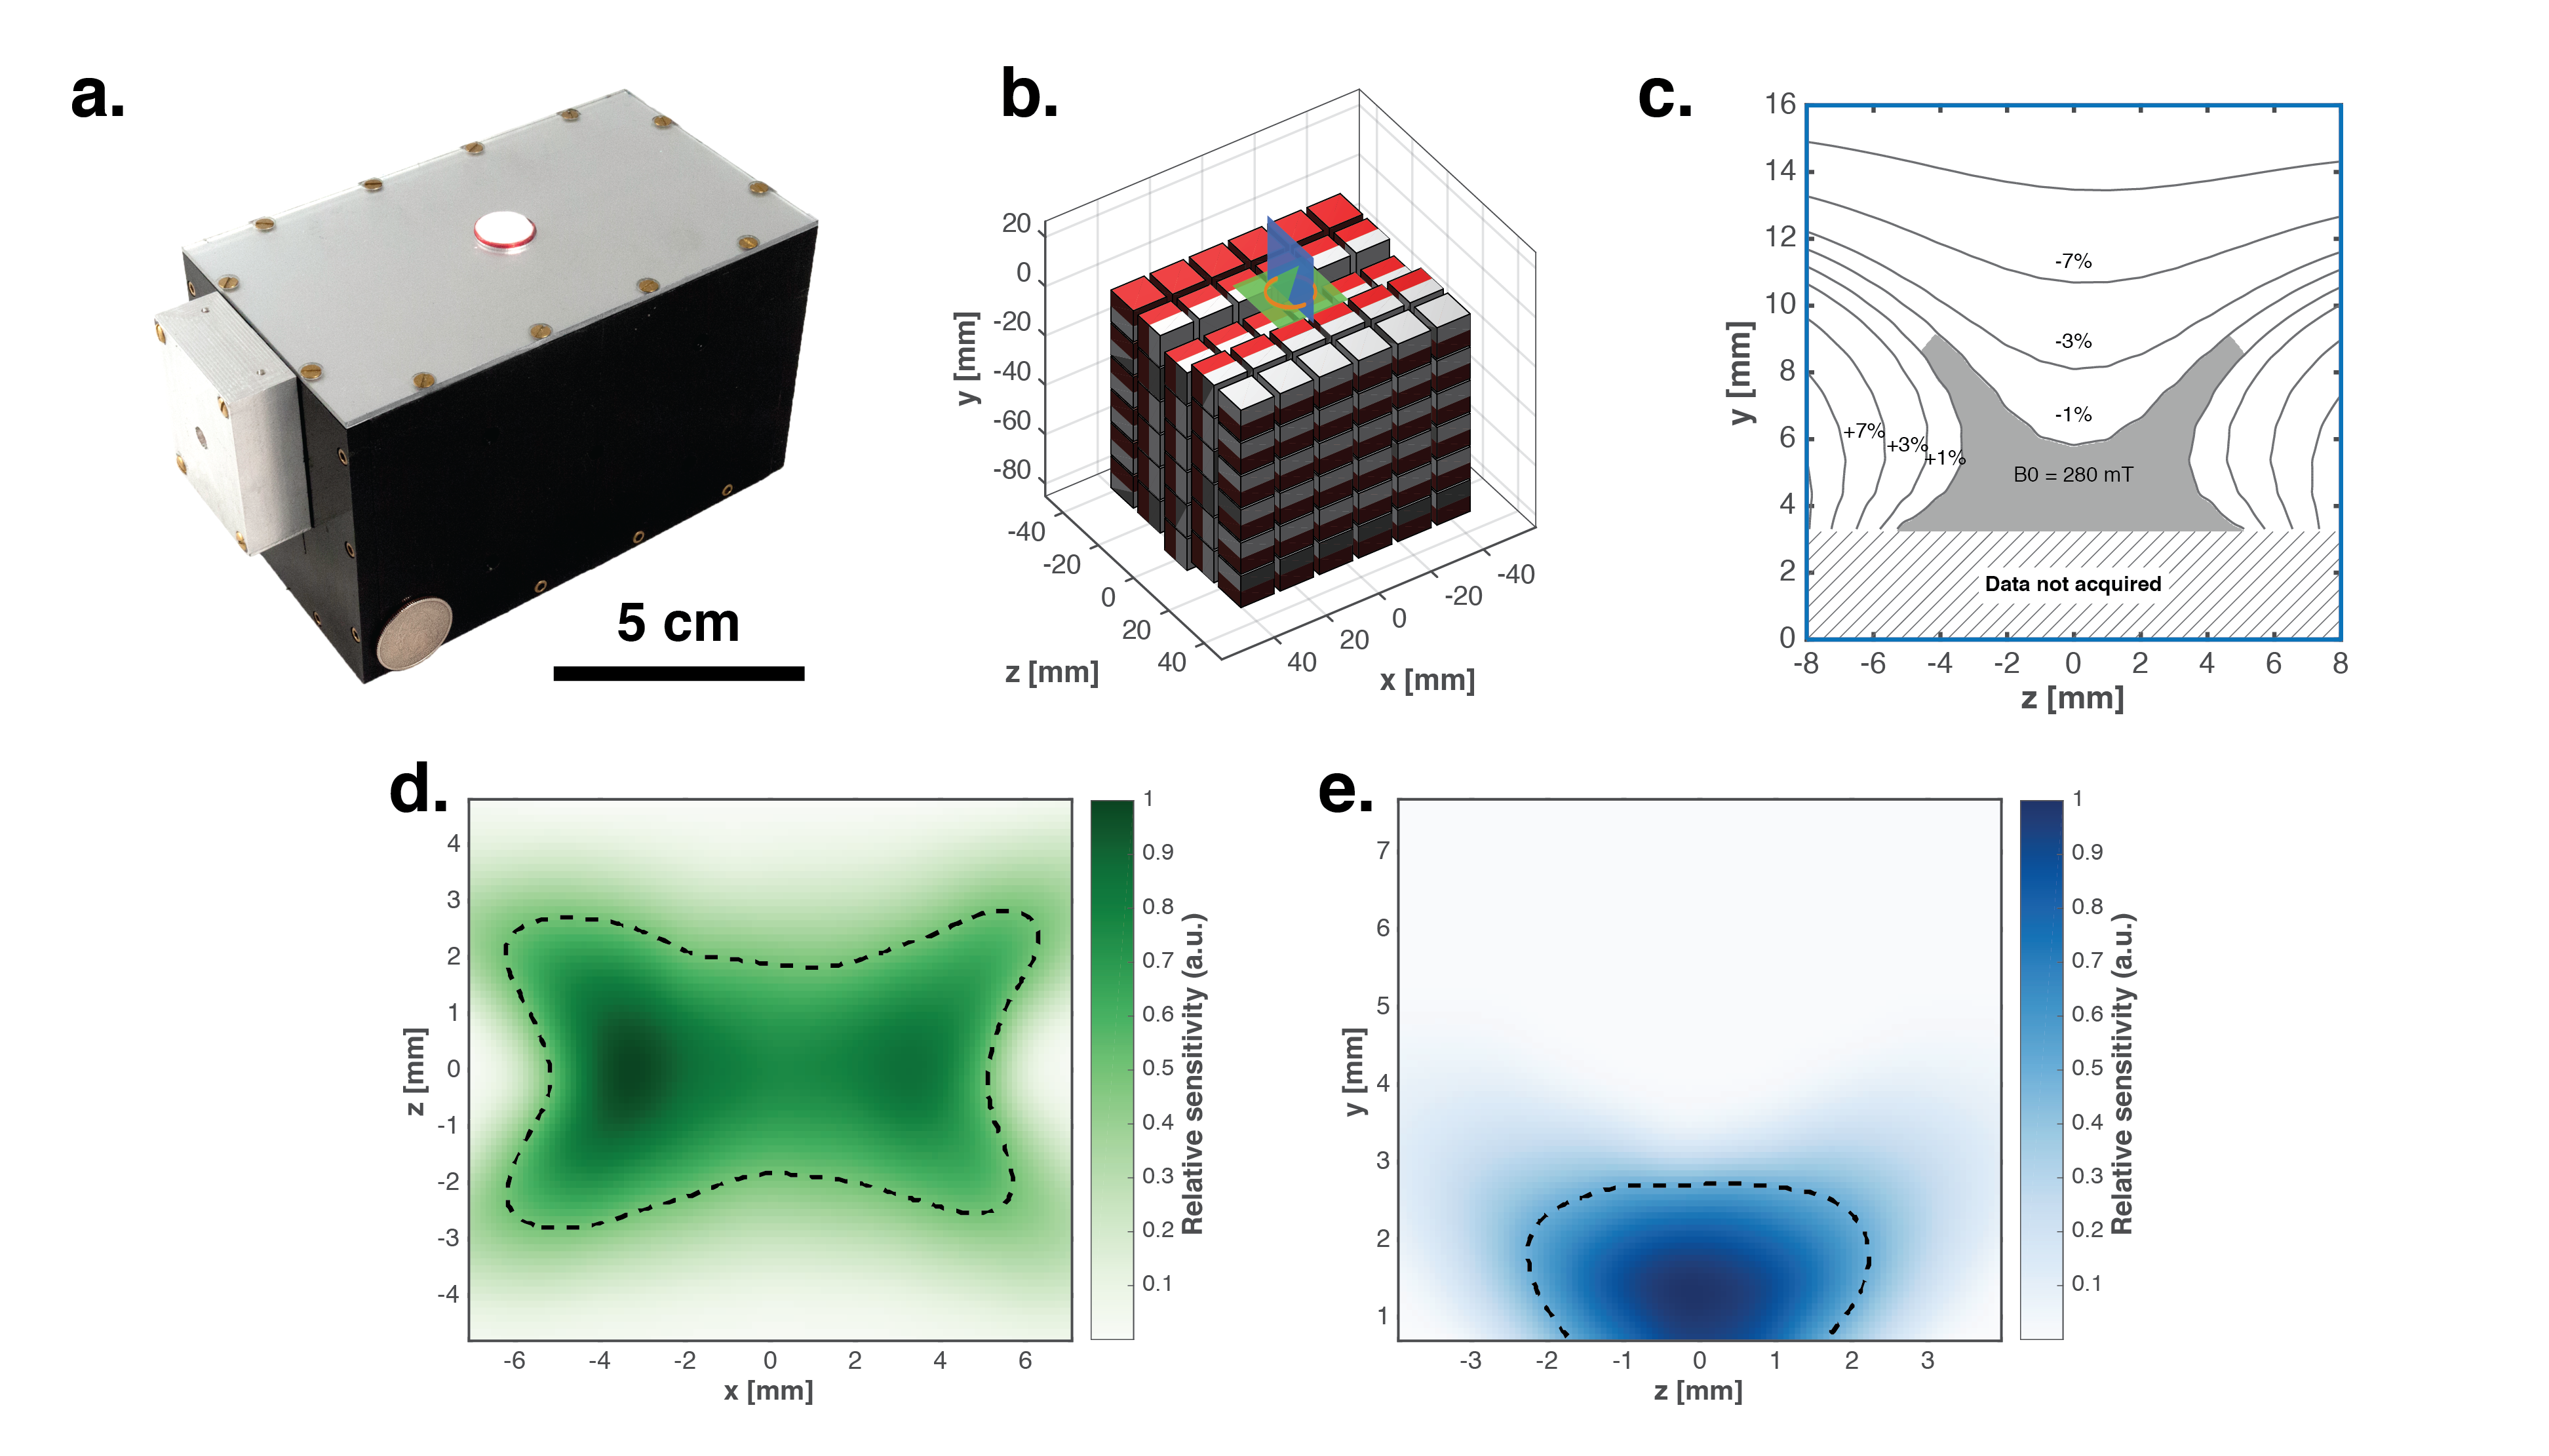
Figure 1. a) Fully assembled sensor with RF matching circuit and solenoidal transceiver coil. b) Illustration of Unilateral Linear Halbach magnet array design with sensor. Red and grey shading indicate positive and negative poles, respectively, of each magnet. c) Measured magnetic field profile directly above center of magnet. Shaded region indicates predicted sensitive region. d-e) Relative sensitivity of sensor across the d) xz-plane and the e) yz-plane demonstrates a 12 × 5 × 2 mm sensitive region. Shaded green and blue planes in (b) indicate relative orientation of measurement planes. Dashed lines indicate 50% relative sensitivity from the peak of the measurement region.