0267
Auxiliary PTx system for active control of induced RF currents in conductive guidewires1School of Biomedical Engineering and Imaging Sciences, King's College London, London, United Kingdom
Synopsis
The risk of RF-induced currents makes use of electrically conductive guidewires for cardiac catheterization procedures potentially unsafe for MRI. By using a parallel transmit coil array (PTx) system it is possible to generate RF field modes that can be utilized for safe imaging, and also guidewire visualization. As the induced RF currents can change with the guidewire position and operator handling, the control modes become a moving target. In this work we present an actively controlled PTx system that enables safe operation during a procedure in which electrical conditions are changing, and demonstrate this experimentally.
Introduction
MRI guidance of interventional procedures using guidewires is limited by potential heating of tissue caused by radio frequency (RF) coupling with the MRI transmit coil 1–3. For a PTx system, RF shim settings that null currents or couple strongly to conductors can be identified from a coupling matrix measurable with a current sensor when individual channels are energised4. Previous implementations measured the coupling matrix separate from the imaging sequence. Hence a procedure in which the electrical conditions are changed, by moving the wire, could result in heating/poor visualisation since out-of-date calibration data is used. In this work we have implemented a real-time architecture for measuring and applying null/coupling modes and demonstrate its capability experimentally, paving the way for safer MRI guided procedures.Methods
System architecture
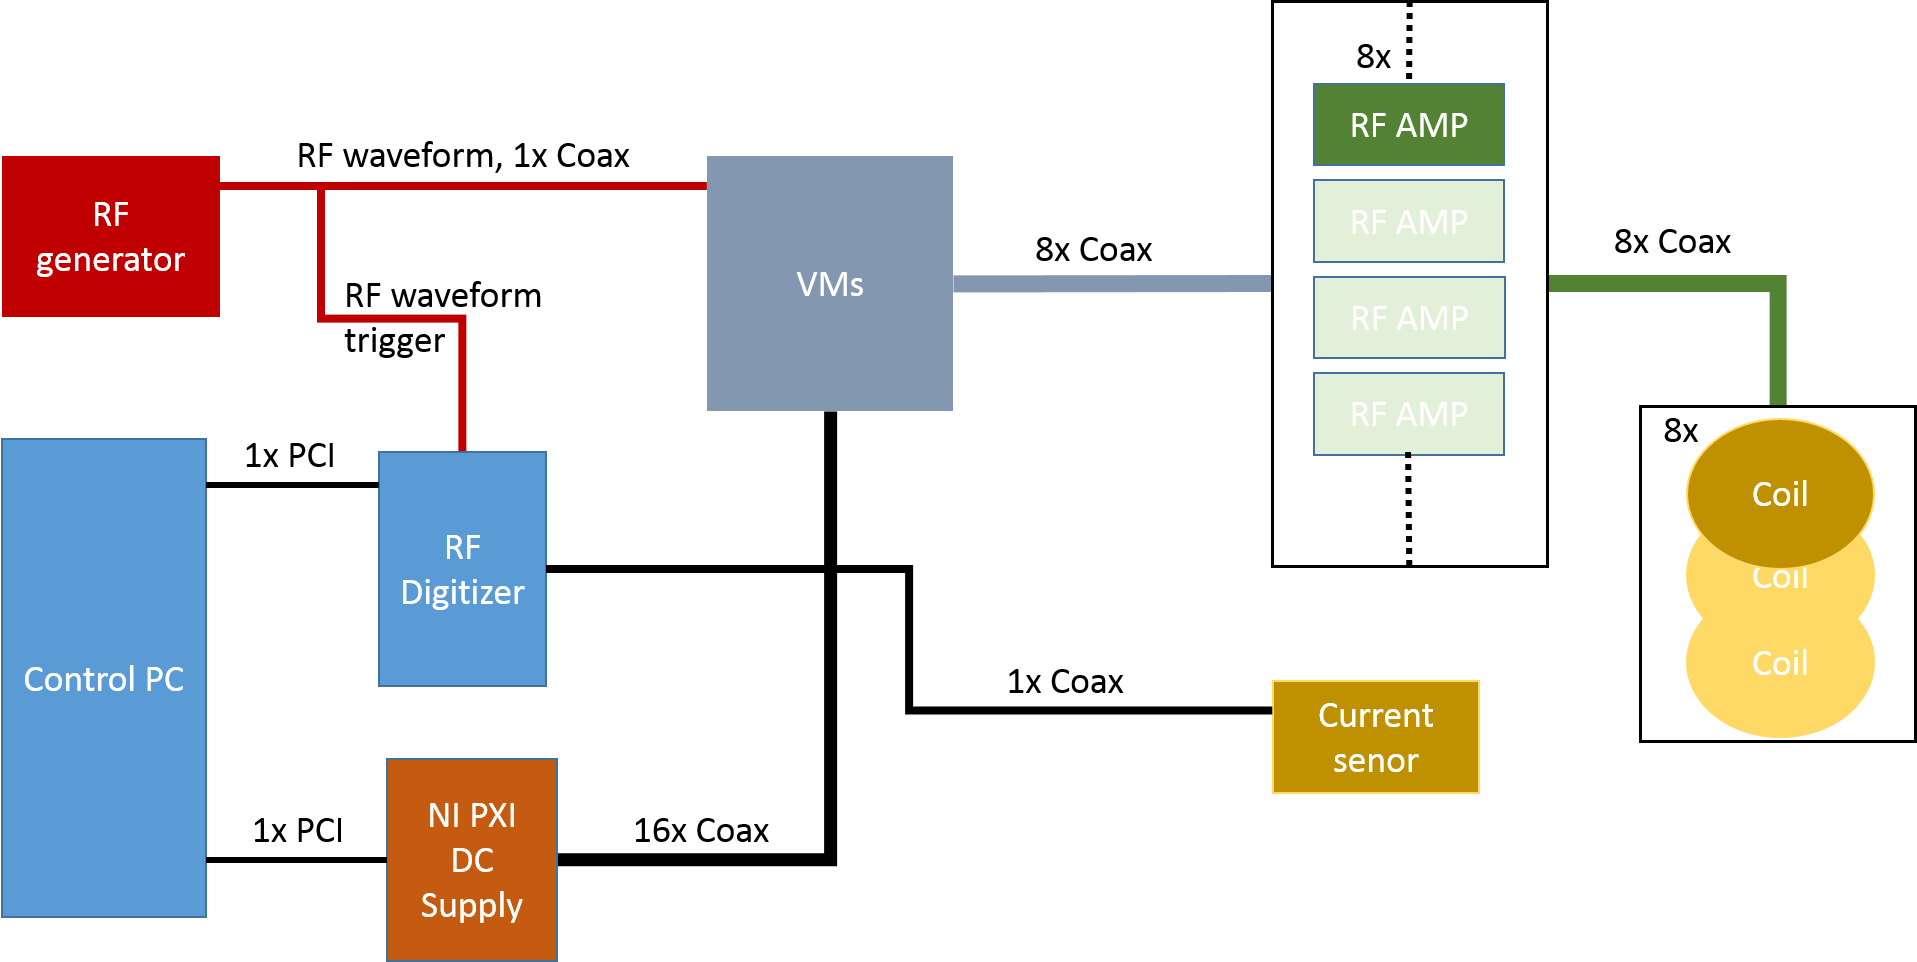
The proposed active-PTx (a-PTx) system depends on a current sensor, RF digitizer, vector modulators (VM), digital to analogue converter, and control PC (Figure 1). The system is designed to sit in-line with a normal single channel TX MRI system. The incoming RF signal is split and then independently amplitude/phase modulated by the VM as required by the measured mode, before being re-amplified and sent to a TX array coil . Current sensor measurements are made directly by the control PC using a digitizer. This PC also controls the VMs. Hence the system can characterise induced currents and respond in real time by adapting RF shims independently of the MRI system on which it is deployed.
Coupling Calibration
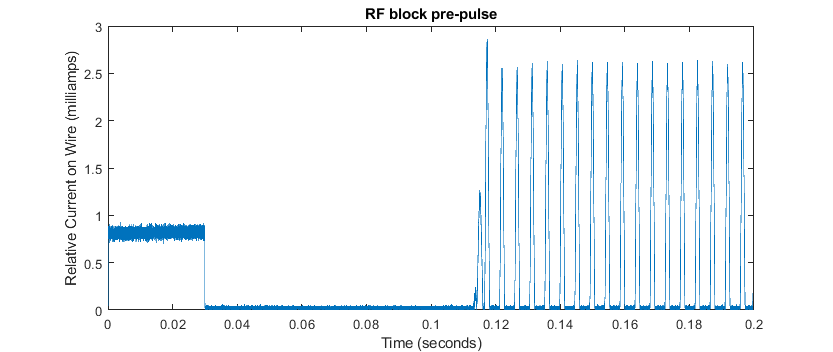
In order to measure the coupling matrix, current sensor measurements need to be made while the PTx system switches each TX channel on and off in turn. The a-PTx system cannot create new RF pulses, it can only modify the RF signal sent by the MR system. Hence the candidate sequence (in this case a TSE pulse sequence) was modified by adding a 30ms off-resonance (5kHz) rectangular RF pulse before the TSE train (Figure 2). Each TX channel was cycled on and off by the VMs during this rectangular pulse with current measurements made at the same time.
Application of modes
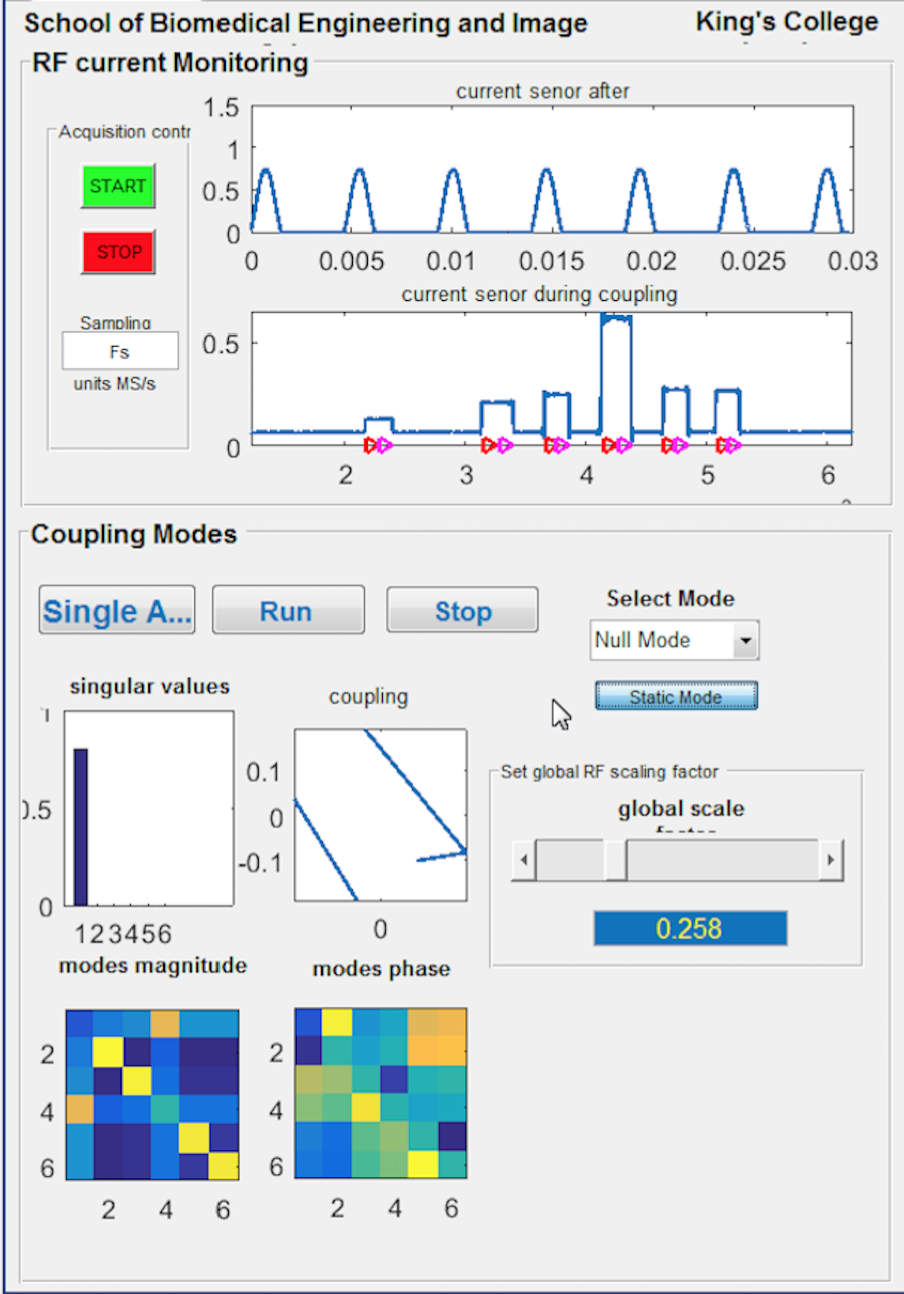
Once the coupling matrix is measured the modes are determined quickly using singular value decomposition4. These modes can then be applied for the subsequent RF pulses that compose the MR sequence. Software was developed to allow modes to be applied in either static (based on fixed coupling measurement) or dynamic (based on the most recent coupling measurement) configuration. A graphic user interface (GUI) and all control software was written in MatLab with supporting instrument libraries (Figure 3).
Experiments
Measurements were performed on a 3T Philips Achieva with an 8-channel PTx TEM coil array . The VM system was calibrated prior to experiments5 using a network analyser; due to calibration issues only 6 of the 8 channels were used in experiments. A TSE sequence running at 100% reported SAR with TR=4s was used.
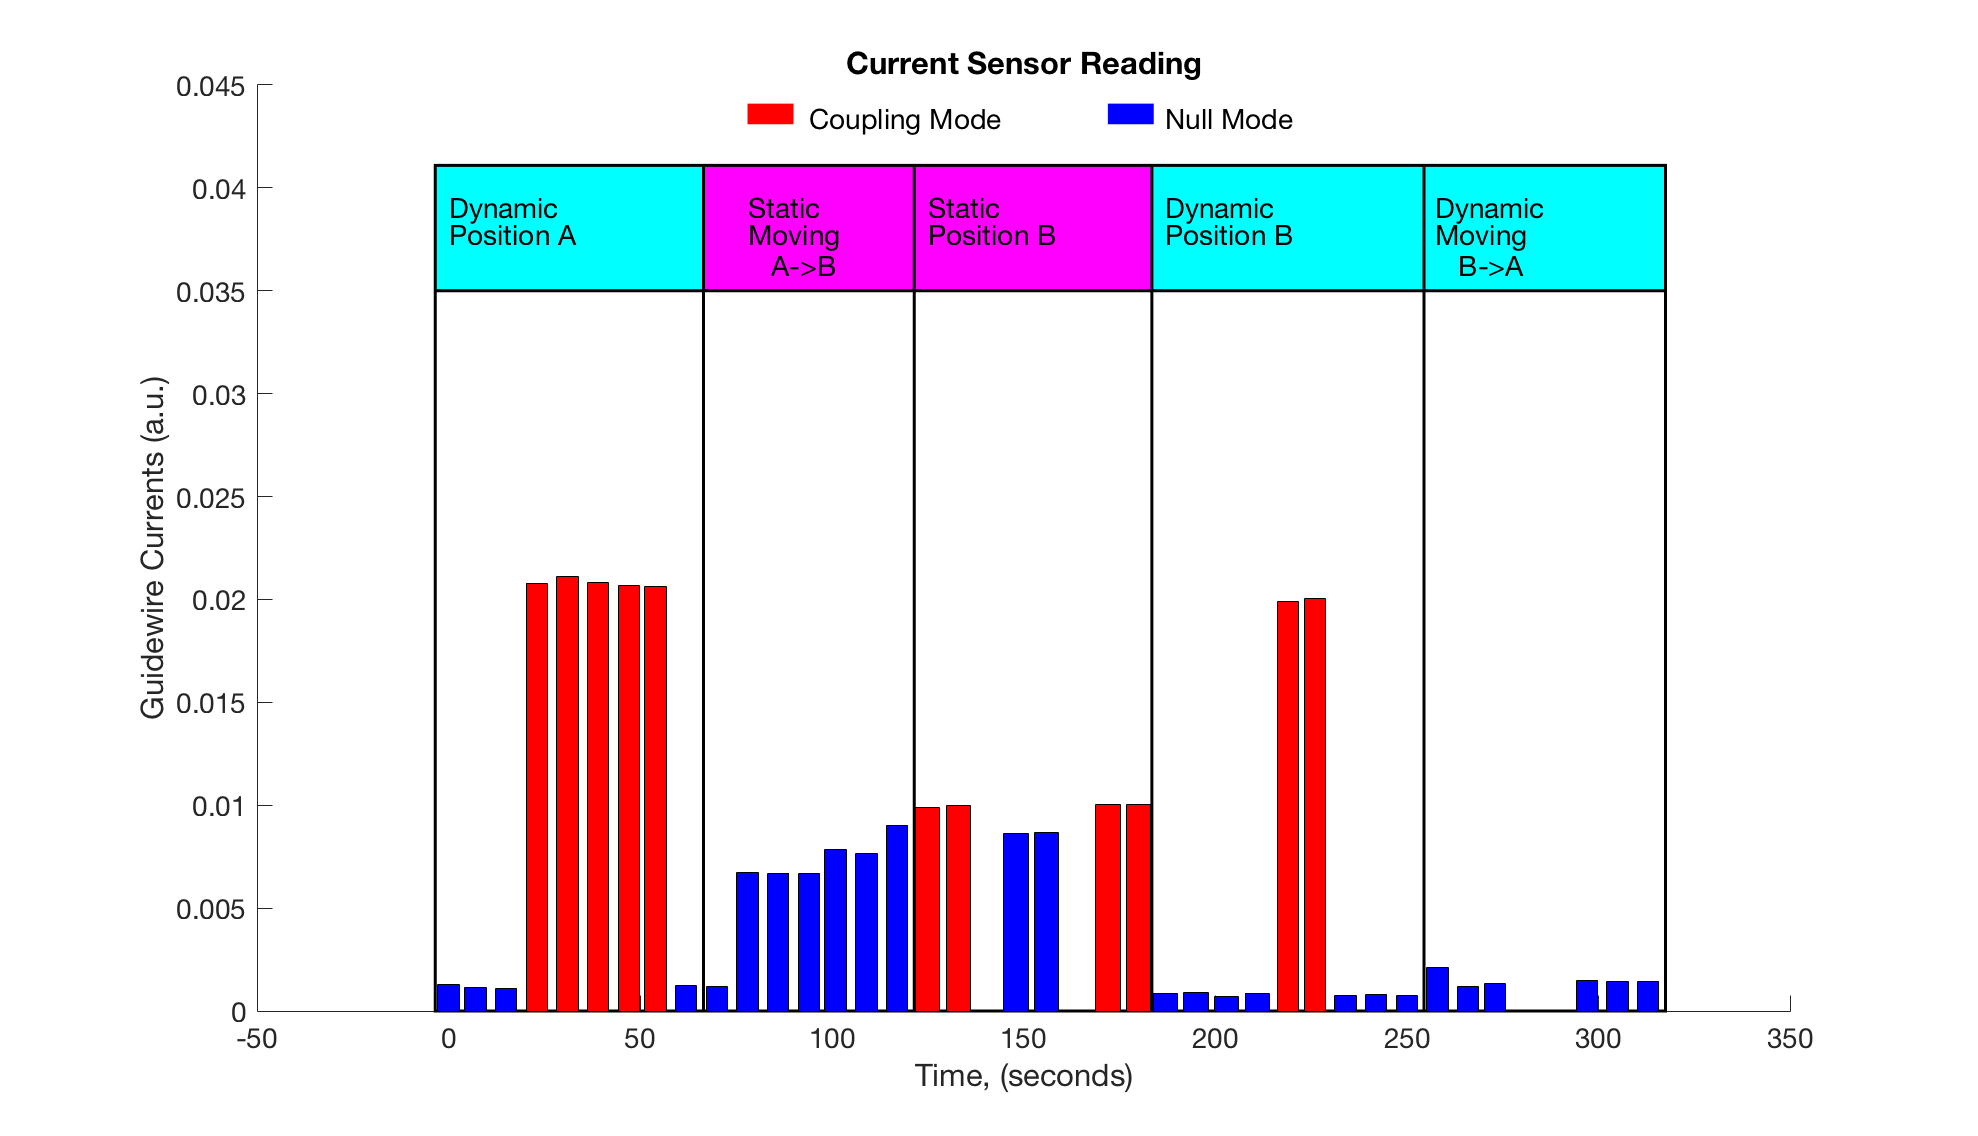
As a proof of concept, a straight wire (90cm long nitinol guidewire, Terumo Corporation, Japan) was placed axially in the scanner’s bore in air, instrumented with a toroidal current sensor. A starting coupling matrix measurement was made at the left-hand position (A) of the scanner (Figure 4). The wire was then moved to the right-hand position (B) without updating the modes (i.e. static control). After some acquisitions at B the system was switched to dynamic control and the measured wire currents where recorded for a 30ms periods. The wire then repeatedly moved between positions A and B while dynamically updating the applied null mode coefficients.
Results
Figure 5 shows the RF induced wire currents at each position for either a coupled or null mode. Starting in position A, the null/coupled mode excitations result in low/high current detected as expected. As the wire starts to move to the right (from 75s) the current readings increase and there is no longer much difference in current measured in coupled and null modes (i.e modes not correctly determined). When dynamic mode was activated the current measurements immediately are as expected and remain correct as the wire is moved back from position B to A.Discussion and Conclusion
A system for active control of RF induced currents in guidewires in MRI has been demonstrated to maintain correctly null/coupled behaviour as a wire is moved, when static calibration methods fail. The method requires an off-resonance pulse to be added to the pulse sequence to facilitate coupling measurement – the necessary frequency of updates and methods for inserting to rapid steady-state sequences are subjects for future work, as is application for a full imaging based study.Acknowledgements
This work was supported by the Wellcome EPSRC Centre for Medical Engineering at Kings College London (WT 203148/Z/16/Z), MRC strategic grant (MR/K006355/1) and developmental pathway funding(MR/N027949) and by the National Institute for Health Research (NIHR) Biomedical Research Centre based at Guy’s and St Thomas’ NHS Foundation Trust and King’s College London. The views expressed are those of the authors and not necessarily those of the NHS, the NIHR or the Department of Health.References
1. Nitz WR, Oppelt A, Renz W, Manke C, Lenhart M, Link J. On the heating of linear conductive structures as guide wires and catheters in interventional MRI. J Magn Reson Imaging. 2001;13(1):105-114. doi:10.1002/1522-2586(200101)13:1<105::AID-JMRI1016>3.0.CO;2-0.
2. Park SM, Kamondetdacha R, Nyenhuis JA. Calculation of MRI-induced heating of an implanted medical lead wire with an electric field transfer function. J Magn Reson Imaging. 2007;26(5):1278-1285. doi:10.1002/jmri.21159.
3. Griffin GH, Anderson KJT, Celik H, Wright GA. Safely assessing radiofrequency heating potential of conductive devices using image-based current measurements. Magn Reson Med. 2015;73(1):427-441. doi:10.1002/mrm.25103.
4. Etezadi-Amoli M, Stang P, Kerr A, Pauly J, Scott G. Controlling radiofrequency-induced currents in guidewires using parallel transmit. Magn Reson Med. 2015;74(6):1790-1802. doi:10.1002/mrm.25543.
5. Padormo F, Malik SJ, Mens G, Hajnal J V. A method for calibrating multi-channel RF systems. In: Proc. Intl. Soc. Mag. Reson. Med.Vol 19. ; 2011:3858.
Figures