0266
Spatial profiling of endogenous cellular iron MRI contrast by machine vision classifies macrophage infiltration in breast cancer models of metabolic- and immune-therapyAvigdor Leftin1,2 and Jason Koutcher1
1Memorial Sloan Kettering Cancer Center, New York, NY, United States, 2Radiology, Stony Brook Medicine, Stony Brook, NY, United States
Synopsis
Tumor macrophage response to therapy is conventionally detected with iron nanoparticle-enhanced MRI. However, endogenous cellular iron detection methods exist that can bypass caveats intrinsic to contrast agent use. We demonstrate that contrast-agent free multi-gradient echo R2* relaxometry iron MRI and machine vision analysis approaches can map tumor macrophage iron deposits and detect cellular response to metabolic and immunotherapy in preclinical models of breast cancer. Feasibility of endogenous macrophage imaging is shown, and the value of the cellular MRI biomarker is demonstrated as a function of treatment and tumor model.
Introduction
Tumor-associated macrophage (TAM) infiltration is associated with negative clinical outcome in most cancers1. Targeting metabolic and immunological function can improve therapeutic response. Iron MRI contrast agents exploit the phagocytotic response of macrophages to track them in vivo, and can be used to monitor TAM infiltration in cancer2-3. However, injections of contrast agents bias the metabolic and immunological function of macrophages and generate off-target contrast via the EPR effect4-6. Moreover, conventional analysis of cellular iron contrast discards local spatial information about the cells reducing specificity of the measurement for TAMs. We have demonstrated an alternative for TAM imaging without contrast agents using multi-gradient echo R2* iron relaxometry combined with machine vision image analysis7-9. Here we evaluate the contrast agent-free cellular imaging approach in murine models of breast cancer, and evaluate how mapping TAM iron deposits relates to metabolic and immune therapy response in vivo.Methods
MRI. Multigradient-echo imaging was conducted at 7T using TR/TE 1.2s/3ms, 16 TEs, flip angle 90, 3cm by 3cm FOV, 1mm slice thickness and in-plane resolution of 0.1 mm by 0.1 mm. Parametric iron MRI maps were generated using linear regression between R2* and aqueous iron concentration in ImageJ. Breast cancer therapy models. Murine TS1 or 99LN MMTV-PyMT mammary tumors were established orthotopically in their syngeneic FVB/N or C57BL/6J hosts. Metabolic iron chelation therapy (Deferiprone, DFP, Sigma) was administered at 150mg/kg per day by oral gavage (n=8), and CSF1R immune therapy (BLZ945, Novartis) was administered at 200mg/kg per day by oral gavage (n=8). Control mice received PBS (n=8) or captisol (n=8). Therapy commenced at 100mm3 tumor volume and continued to control tumors reached approximately 1cm3. MRI image analysis. Tumor iron images were segmented by iron concentration range. High-iron pixel regions were detected and quantified using the ImageJ pixel cluster analysis tool. Spatial integration of high-iron iron MRI clusters was performed by concentric rake sampling patterns projected over regions of interests. TAM infiltration profiles were generated by plotting the number of high-iron clusters as a function of percent tumor infiltration. Histological analysis. TAM hemosiderin deposits were identified by Prussian blue staining. Deposits were quantified using the same analysis approach as the MRI analysis. Statistics. Normalized change in infiltration profile and tumor volumes were compared using Wilcoxian signed rank test with significance values were determined at p<0.05.Results
Figure 1 shows the detection and quantification of TAMs using contrast-agent free iron R2* relaxometry in a murine mammary tumor. Regions of high-iron contrast shown in Figure 1a correspond to deposits of TAMs containing hemosiderin iron indicated by the Prussian Blue iron staining in Figure 1b. The deposits are quantified and mapped using concentric ring integration of the iron MRI regions shown in Figure 1c and plotted as a function of percent infiltration in the tumor in Figure 1d. A similar mapping was conducted in for the Prussian Blue images (data not shown). The high-iron clusters detected by iron MRI in Figure 2a and iron histology in Figure 2b further indicated that the two MMTV-PyMT models differ in the degree of TAM iron deposition. Therapeutic administration of chelation (DFP) or immunotherapy (BLZ945) resulted in significant reductions in tumor growth shown in Figure 3a. Changes in TAM infiltration profiles of the TS1 and 99LN mammary tumor models receiving either iron chelation or immunotherapy (Figures 3b, 3c) exhibited strain and therapy specific differences.Discussion
R2* iron MRI and machine vision analysis allow the detection and quantification of TAM iron deposits in breast cancer models. The two MMTV-PyMT models differed in their TAM iron deposits. This allowed us to test if this metabolic biomarker was associated with differential therapeutic response. While both models exhibited reduced tumor volumes with chelation or immunotherapy, accumulation of TAM iron deposits in high-iron TS1 tumors was unaffected by chelation while TAM iron deposition in low-iron 99LN tumors was significantly inhibited by the chelation therapy. CSF1R immunotherapy inhibited TAM iron accumulation vis a vis a reduction in macrophage accumulation similarly in both models.Conclusion
Imaging TAM infiltration using contrast-agent free iron MRI probes cellular response to therapy. High-levels of iron in TAMs are prognostically associated with inhibition of iron deposition by iron chelation, while TAM iron deposits serve as a general longitudinal response biomarker of the CSF1R immunotherapies’ effect on macrophage accumulation in tumors. These preclinical studies further demonstrate the feasibility of using endogenous iron as a cellular MRI biomarker in cancer, and highlight the contextual nuances of using these cellular imaging measurements in different therapeutic modes and study populations.Acknowledgements
This study was funded by National Institutes of Health PO1 (CA115675) and P30 (CA008748), Department of Defense (BC161705), and the National Cancer Institute Kirschstein National Research Service Award Individual Postdoctoral Fellowship (1F32CA206277).References
1. Gentles, A.J., et al., The prognostic landscape of genes and infiltrating immune cells across human cancers. Nat Med, 2015. 21(8): p. 938-945. 2. Daldrup-Link, H.E., et al., Imaging of tumor associated macrophages with clinically-applicable iron oxide nanoparticles. Clin. Cancer Res., 2011. 17: p. 5695-5704. 3. Weissleder, R., M. Nahrendorf, and M.J. Pittet, Imaging macrophages with nanoparticles. Nat. Mater., 2014. 13: p. 125-138. 4. Laskar, A., et al., SPION primes THP1 derived M2 macrophages towards M1-like macrophages. Biochem Biophys Res Commun, 2013. 441(4): p. 737-42. 5. Zanganeh, S., et al., Iron oxide nanoparticles inhibit tumour growth by inducing pro-inflammatory macrophage polarization in tumour tissues. Nat Nanotechnol, 2016. 11(11): p. 986-994. 6. Maeda, H., Toward a full understanding of the EPR effect in primary and metastatic tumors as well as issues related to its heterogeneity. Adv. Drug. Deliv. Rev., 2015. 30: p. 3-6. 7. Leftin, A., et al., Iron imaging reveals tumor and metastasis macrophage hemosiderin deposits in breast cancer. PLoS One, 2017. 12(9): p. e0184765. 8. Leftin, A., et al., Iron deposition is associated with differential macrophage infiltration and therapeutic response to iron chelation in prostate cancer. Sci Rep, 2017. 7(1): p. 11632. 9. Leftin, A, et al. Quantification of nanoparticle-enhancement in polarized breast tumor macrophage deposits by spatial analysis of MRI and histological iron contrast using computer vision. Contrast Media Mol I, 2018 (in press).Figures
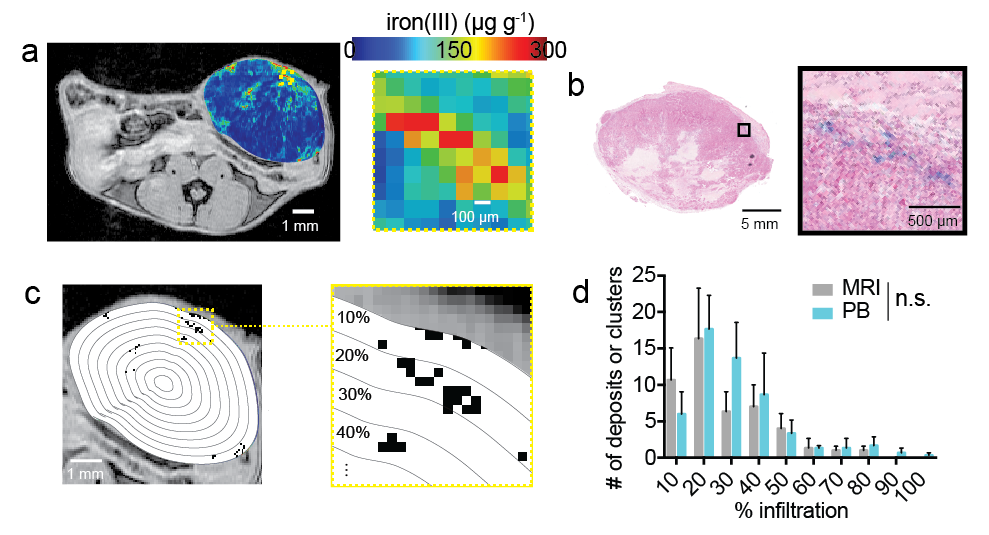
Figure 1. (a)
Parametric iron map of mammary tumor obtained by MGE R2*
relaxometry. (b) Prussian blue iron
histology showing TAM iron deposit. (c)
Machine vision spatial integration scheme. (d) TAM iron deposit infiltration
profile for iron MRI and Prussian blue (PB).
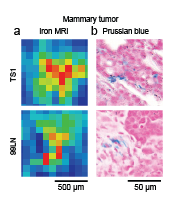
Figure 2. (a)
High-iron MRI clusters and (b) Prussian blue TAM iron deposits in TS1 and 99LN MMTV-PyMT mammary
tumors.
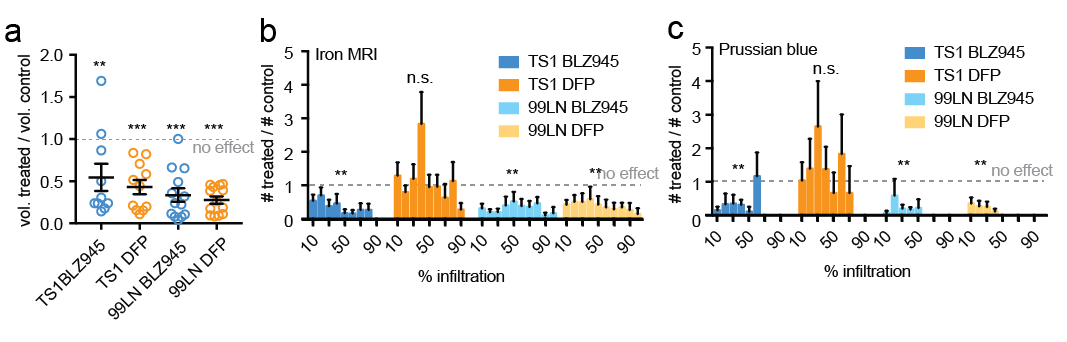
Figure 3. (a) Tumor volumes, (b) iron MRI cluster
infiltration, and (c) Prussian blue TAM iron deposit infiltration for TS1 and
99LN MMTV-PyMT tumor models given either CSF1R inhibitor (BLZ945) or iron
chelation therapy (DFP). Data is
normalized to control measurements.