0264
An MR based PET attenuation correction using a deep learning approach and evaluation in prostate cancer patients1Monash Biomedical Imaging, Monash University, Clayton, Australia, 2Department of Biophysics, Faculty of Mathematics and Natural Sciences, University of Rzeszow, Rzeszow, Poland, 3Monash Institute of Cognitive and Clinical Neurosciences and School of Psychological Sciences, Monash University, Clayton, Australia, 4Department of Electrical and Computer Systems Engineering, Monash University, Clayton, Australia, 5Monash Imaging, Monash Health, Clayton, Australia, 6Department of Surgery, Monash University, Melbourne, Australia, 7Department of Computer Science and Engineering, Indian Institute of Technology, Bombay, India
Synopsis
Accurate Magnetic Resonance (MR) imaging based attenuation correction is crucial for quantitative Positron Emission Tomography (PET) in simultaneous MR/PET imaging. However, due to a lack of robust MR bone imaging methods, MR based attenuation correction remains a critical issue in MR/PET image reconstruction. In this work, we developed and evaluated a deep learning (DL) based MR based attenuation correction method for improved MR/PET quantification accuracy in prostatic cancer imaging.
Introduction:
Accurate patient specific PET attenuation correction is a major issue in MR/PET. It is challenging to obtain bone information from structural MR images since there is little contrast difference between bone and air1. DIXON imaging offers excellent soft tissue contrast and can be combined with a bone atlas for generation of PET attenuation maps (μ-maps) for whole body MR/PET. However, the incomplete bone information in DIXON μ-maps may lead to PET quantification inaccuracies, especially for the lesion closed to bones, such as prostate cancer. Several groups have demonstrated improved PET attenuation correction using DL methods compared to the conventional DIXON method and the zero-echo-time method2,3 . In this work, we further develop a DIXON based DL method for μ-map generation and we evaluate the accuracy of PET image quantification in a cohort of prostate cancer patients.Materials and Methods:
CT and PET/MR images were acquired in a cohort of 17 prostate cancer patients (mean age 65.2 ± 8.5 years; range 46 - 76 years). All patients underwent PET/CT (GE Discovery 710) and PET/MR (Siemens 3T Biograph mMR) studies (approved by the ethics committees of Monash University), using the protocols below.
PET/CT Acquisition: CT datasets of the patients were acquired with image resolution of 1.367 x 1.367 x 3.2 mm3, with an operating energy range of 120 – 140 kV. For the PET scan the average administered dose of Ga-68 was 183 ± 27 MBq (range 140 – 251 MBq).
PET/MR Acquisition: The PET/MR data acquisition were performed approximately 60 mins after the PET/CT scans, including the following sequences: Dixon with resolution 2.604 x 2.604 x 3.12 mm3, TR = 3.96 msec, TE = 1.23 msec, flip angle 9°. Thirty minutes of PET list-mode data were acquired and images were reconstructed using Siemens e7tools software, with ordered-subsets expectation maximization (OSEM) algorithm, 3 iterations, 21 groups, and post- smoothed using a 3mm Gaussian filter.
Data preprocessing: CT images were registered to the DIXON images using the ANTS tool. Attenuation correction μ-maps were calculated by converting CT numbers of the tissues to linear attenuation coefficients4.
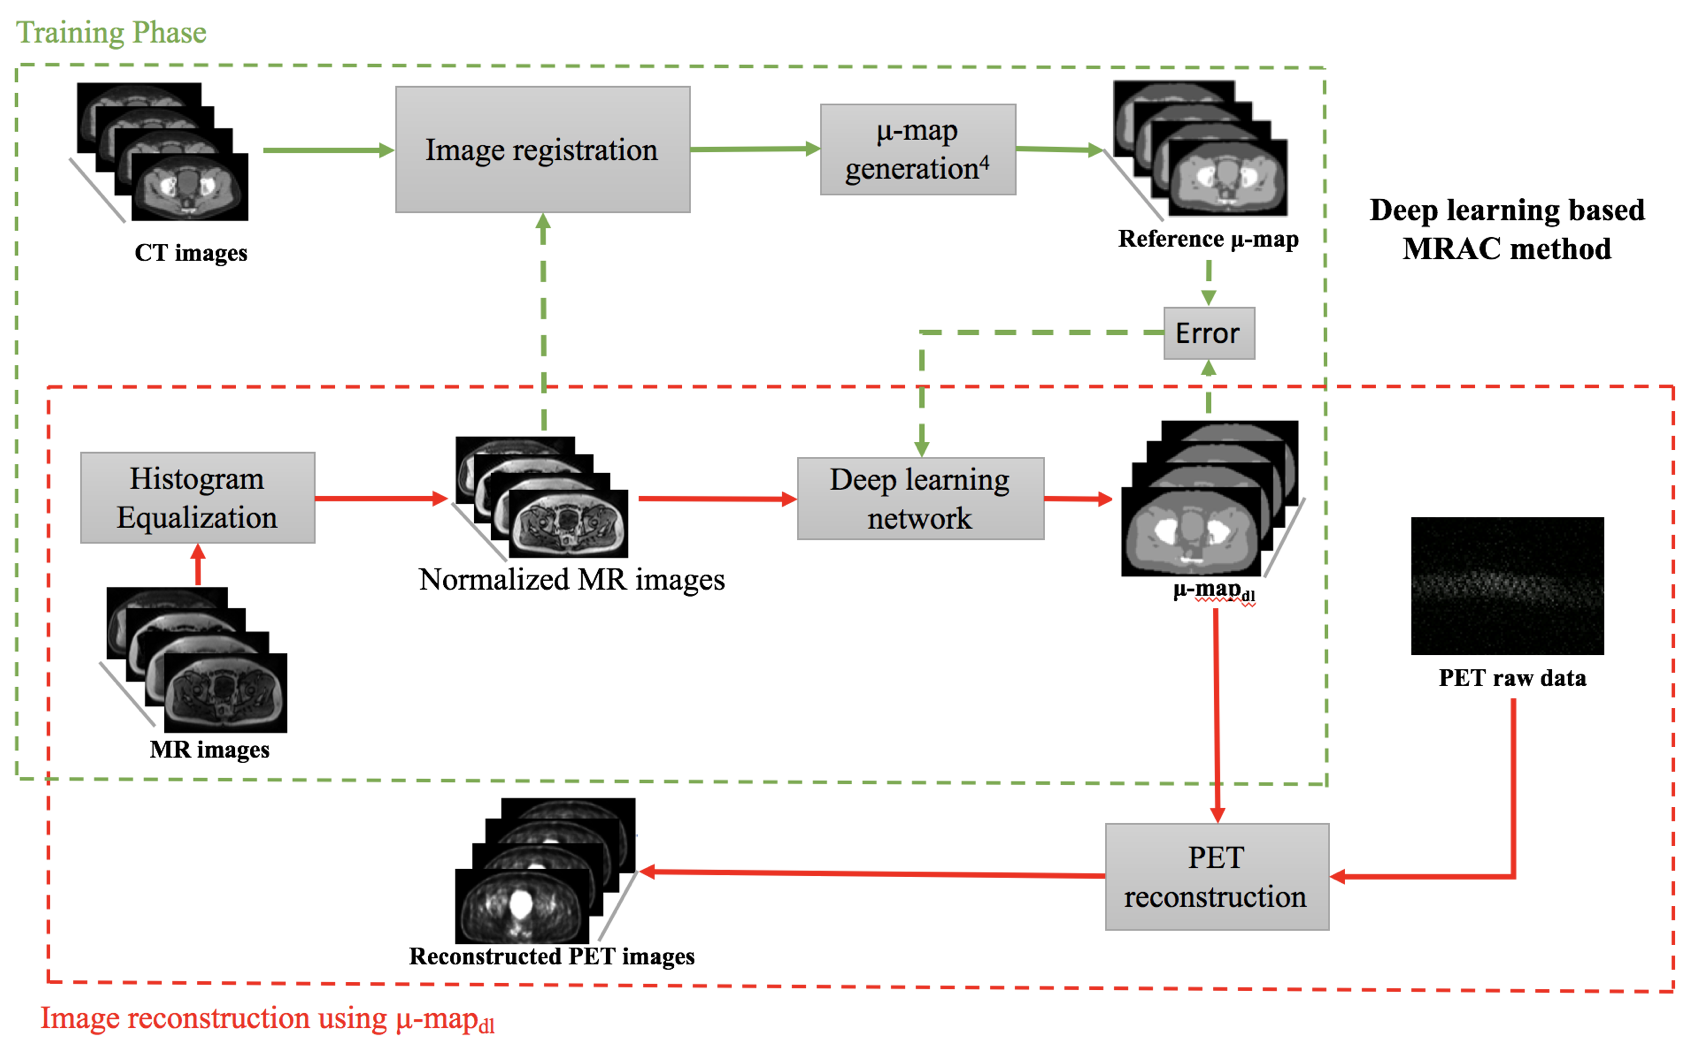
Deep learning training: A variation of U-net5 was designed and trained to estimate four tissue classes (air, fat, soft tissue, and bone) in the μ-maps. The input to the network were the Dixon images including water, fat, in-phase and out-phase images. The reference output for the network was the set of co-registered CT μ-maps. Thirteen datasets were used to train the network, and four datasets were used for evaluation. The DL based MR based attenuation correction workflow is presented in Figure 1.
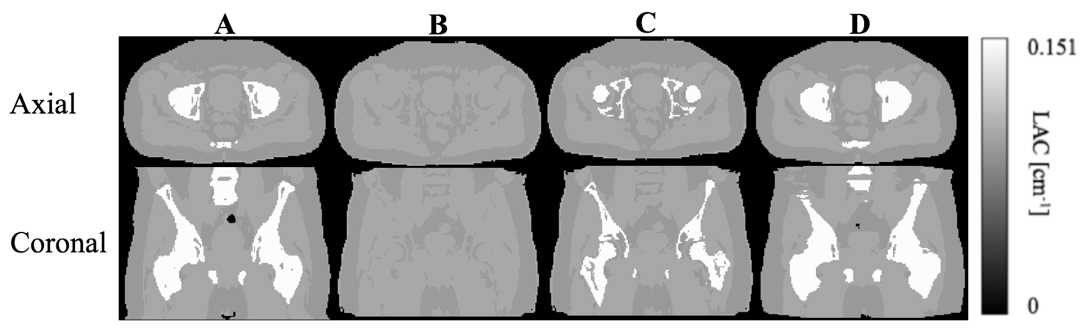
Generation and comparison of μ-maps: The attenuation coefficients (μ-values) for bones, soft tissue, fat and air were set to 0.151 cm-1, 0.1 cm-1, 0.092 cm-1, and 0.0 cm-1, respectively. The DL based method was compared with the following μ-maps:
- Reference (μ-mapct) – co-registered CT images containing 4-tissue classes: bone, soft tissue, fat and air.
- DIXON (μ-mapdixon) – DIXON based μ-map without bone information.
- DIXON (μ-mapdixon+bone) – DIXON based μ-map with bone information.
[(2) and (3) were generated from Siemens MR/PET scanner]
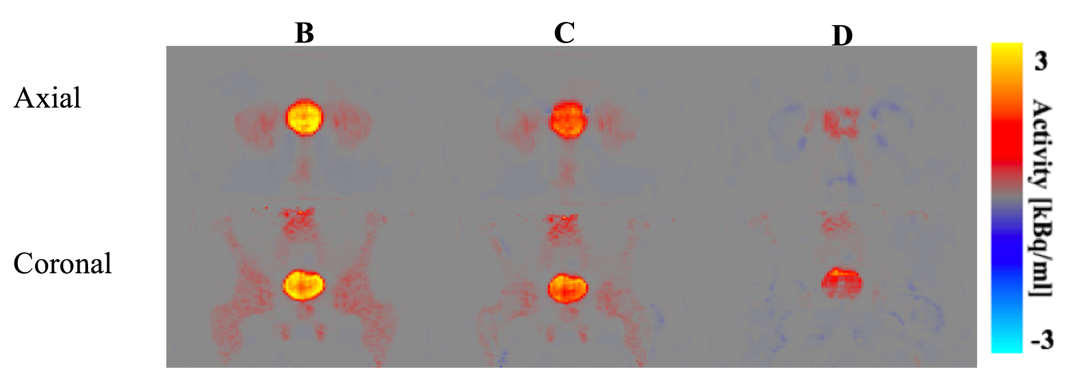
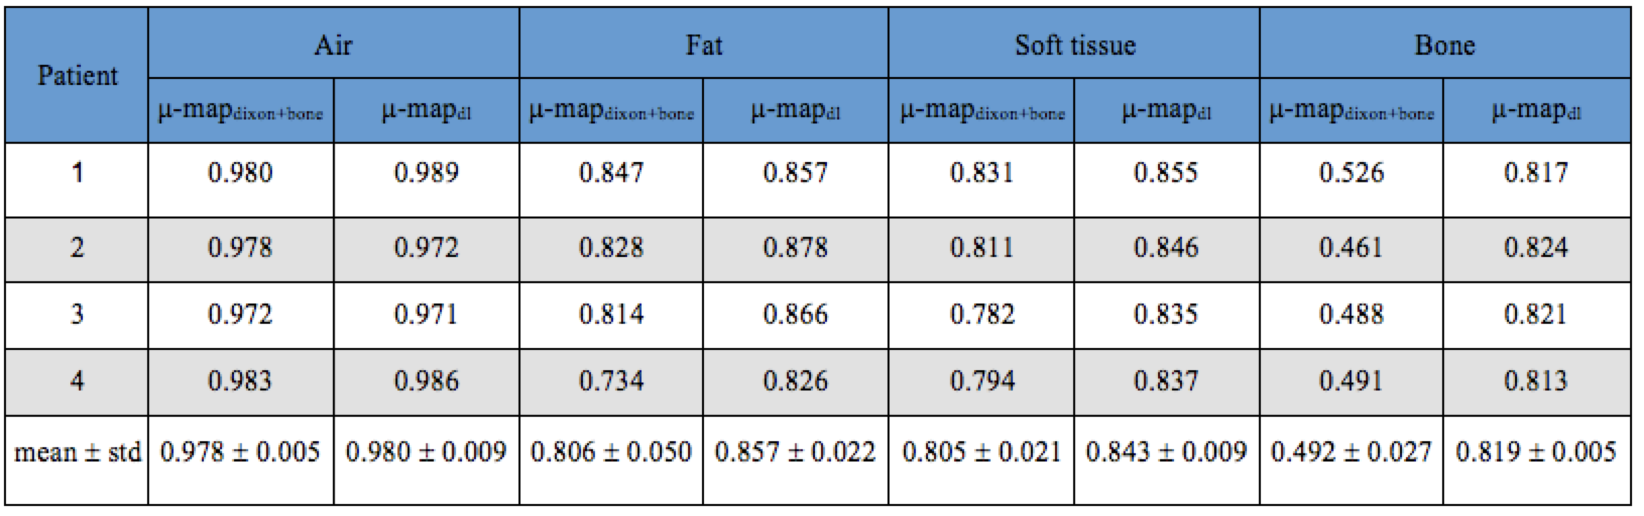
Dice coefficients across all subjects for air, fat, soft tissue and bones were calculated for each of μ-map method. The PET image reconstructed using μ-mapct was taken as the reference, denoted as PETref. The difference between each μ-map and the reference was calculated for comparison.
Results:
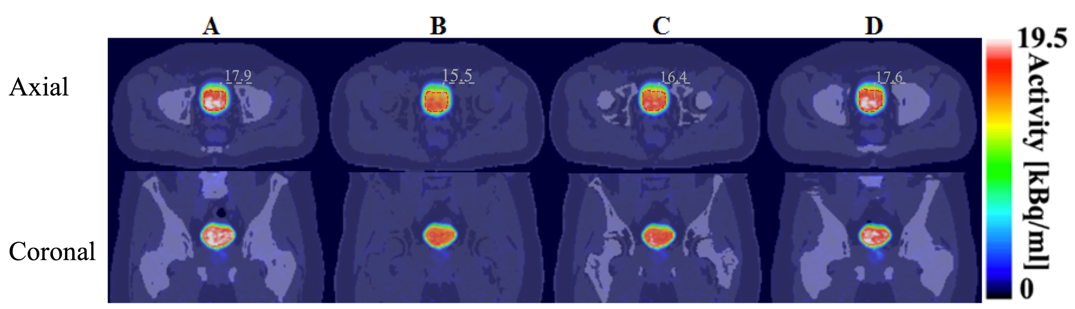
Compared with the reference μ-mapct (see Figure 2A) the μ-mapdl demonstrated more accurate classification of the bones compared with μ-mapdixon+bone where the overall bone structures were significantly underestimated, as confirmed by visual inspection and comparison of DICE coefficients (see Table 1). Across the four testing patients, in the bone region the averaged DICE coefficient was 0.491 for μ-mapdixon+bone, and 0.818 for μ-mapdl, respectively. To evaluate the impact of the attenuation map differences the PET images were reconstructed using the three μ-maps (see Figure 3) and the corresponding error images were calculated (see Figure 4). When compared with the reference PET image reconstructed using μ-mapct, the PET image from μ-mapdl produced the most accurate PET quantification in the prostate region, resulting in only 1.6% error, whereas the image reconstructed using μ-mapdixon+bone had 8.4% error and the image from μ-mapdixon demonstrated a larger error of 13.4%.Discussion and conclusion:
In this work, we have presented an MR based attenuation correction method for PET using a DL approach. The DL method shows significant improvement in identification of bones for PET attenuation correction. Significantly improved PET quantification accuracy was demonstrated using MR/PET data in a prostate cancer patient study.Acknowledgements
No acknowledgement found.References
- Jakub Baran et al Deep learning-based whole head segmentation for simultaneous PET/MR attenuation correction. ISMRM 2018 (2018).
- Gong, Kuang, et al. "Attenuation Correction for Brain PET imaging using Deep Neural Network based on Dixon and ZTE MR images." Physics in medicine and biology (2018).
- Leynes, Andrew P., et al. "Zero-echo-time and Dixon deep pseudo-CT (ZeDD CT): direct generation of pseudo-CT images for pelvic PET/MRI attenuation correction using deep convolutional neural networks with multiparametric MRI." Journal of Nuclear Medicine 59.5 (2018): 852-858.
- Carney, Jonathan PJ, et al. "Method for transforming CT images for attenuation correction in PET/CT imaging." Medical physics 33.4 (2006): 976-983.
- Ronneberger, Olaf et al. "U-net: Convolutional networks for biomedical image segmentation." International Conference on Medical image computing and computer-assisted intervention. Springer, Cham, 2015.
Figures