0263
Efficient Dictionary-based Attenuation Correction for combined PET-MR systems1Department of Physics, University of Pisa, Pisa, Italy, 2IMAGO7 Foundation, Pisa, Italy, 3IRCCS Stella Maris, Pisa, Italy
Synopsis
In many diagnostic applications, a correct photon attenuation correction is crucial for quantifying the uptake of a PET tracer. While in PET/CT scanners attenuation map is readily estimated from CT Hounsfield units, in combined PET/MRI scanners it must be obtained by processing of high resolution images. This map must then be co-registered to low resolution PET map, wasting acquisition time. Here, we propose an efficient approach based on a fast transient-state acquisition and a three-component signal model: this allow to obtain tissue fraction maps, which can be used to estimate attenuation map, directly at PET resolution.
Introduction
Photon attenuation correction is crucial for accurate quantification of PET tracer uptakes in many diagnostic applications. Since MR signal is not related to electronic density, MR Attenuation Correction (MRAC) in PET/MR scanners rely on processing (e.g. segmentation) of high resolution images1,2 which have to be co-registered to low resolution PET images, with waste of acquisition time. Here, we propose an approach based on MR Fingerprinting3. Thanks to the unique signal evolution given from transient-state acquisition, MRF has previously shown sub-voxel quantification capability4–6. Here, we want to use this capability to obtain water, fat and bone fractions, as well as air masks, within a single acquisition directly at PET resolution. We called this approach Dictionary-based Attenuation Correction (DB-AC).Methods
Signal model
A three-component dictionary was created7 combining bone-only, fat-only and water-only dictionaries with weightings from 0 to 1. Tissue fractions maps were obtained by inner product pattern matching between the acquired signals and the dictionary. A cost function was defined as the inner product between normalized MR signals and normalized dictionary entries. Such quantity ranges from 0 (for orthogonal signals) to 1 (perfect match): entries for which the cost function was lower than 0.7 were classified as air.
Acquisition
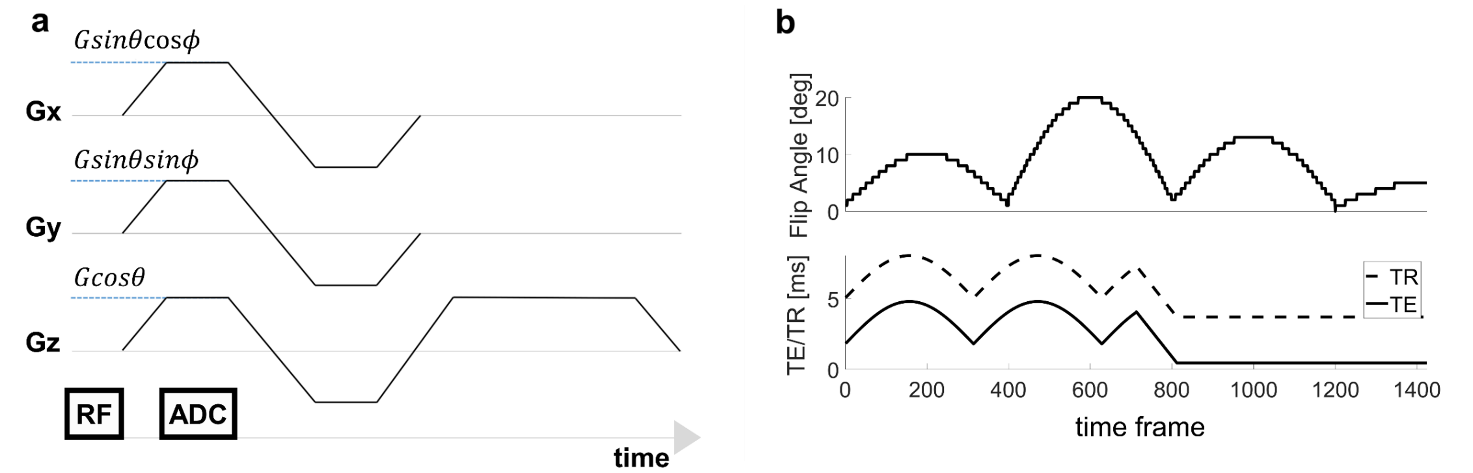
All the acquisitions were performed on a GE HDxt 1.5T scanner. A 3D Radial center-out readout8 with random permutation between spokes was used (resolution: 4mm isotropic), including both gradient and radiofrequency spoiling. The acquisition time was 123s. The acquisition scheme is shown in Figure 1. 3D T1 weighted images (resolution: 1x1x1.3mm) were acquired for comparison: these images were segmented9,10 and downscaled to 4mm isotropic to obtain reference tissue fraction maps.
In vitro Experiment
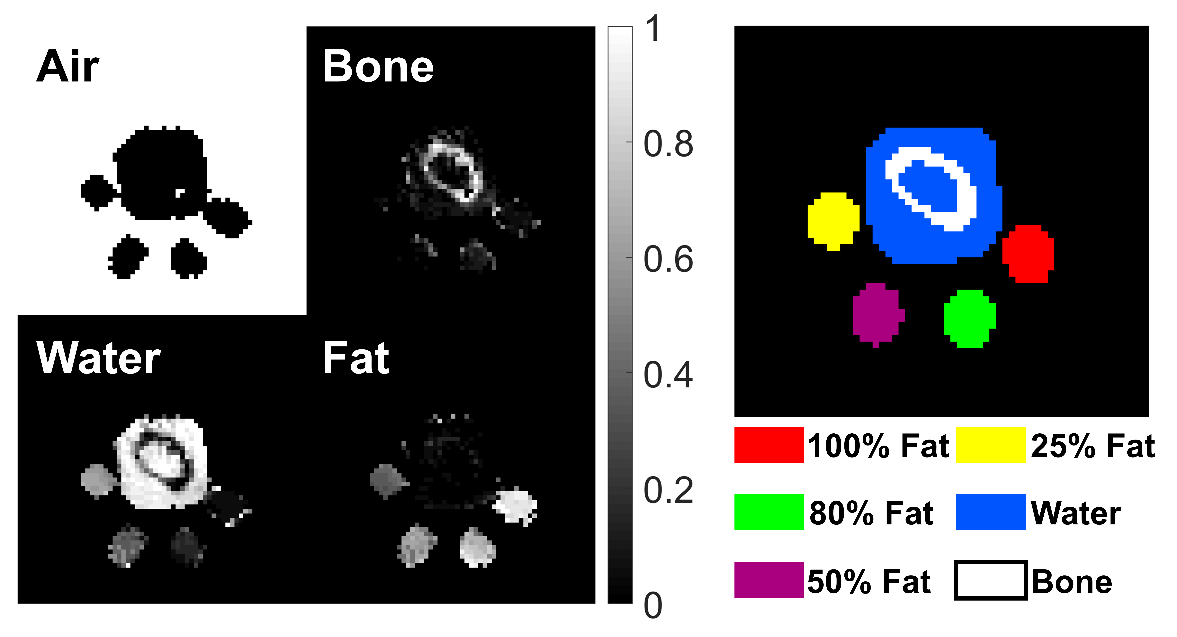
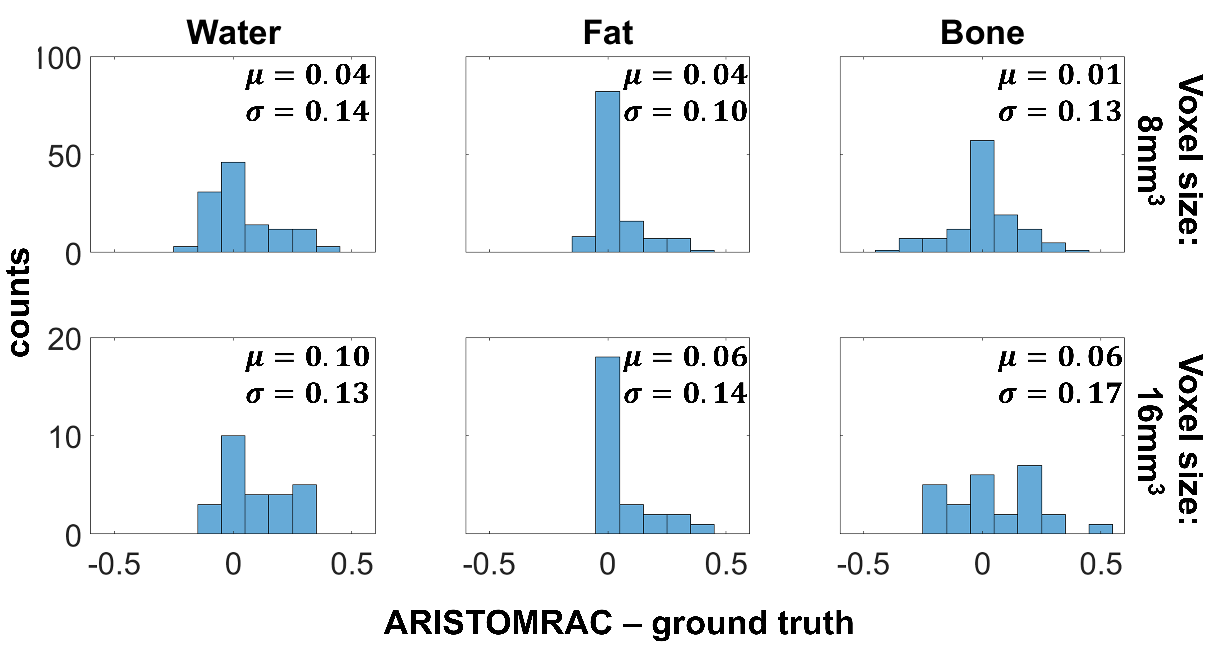
To validate the technique, a phantom consisting of a bovine bone surrounded by a 0.6% agar gel and four oil-water emulsions (nominal concentrations: 25%, 50%, 80%, 100%) was scanned. Concordance Correlation Coefficients11 (CCCs) between DB-AC and reference tissue fractions were calculated, as well as Dice similarity12,13 between DB-AC and reference air masks (taking as reference voxels with tissue content < 0.5). To assess the capability of the technique to estimate tissue partial volumes, we downscaled both reference and DB-AC maps to 8 and 16mm isotropic resolutions. Then, we calculated the differences between DB-AC and reference values and we computed mean and standard deviation of these differences.
In vivo Experiment
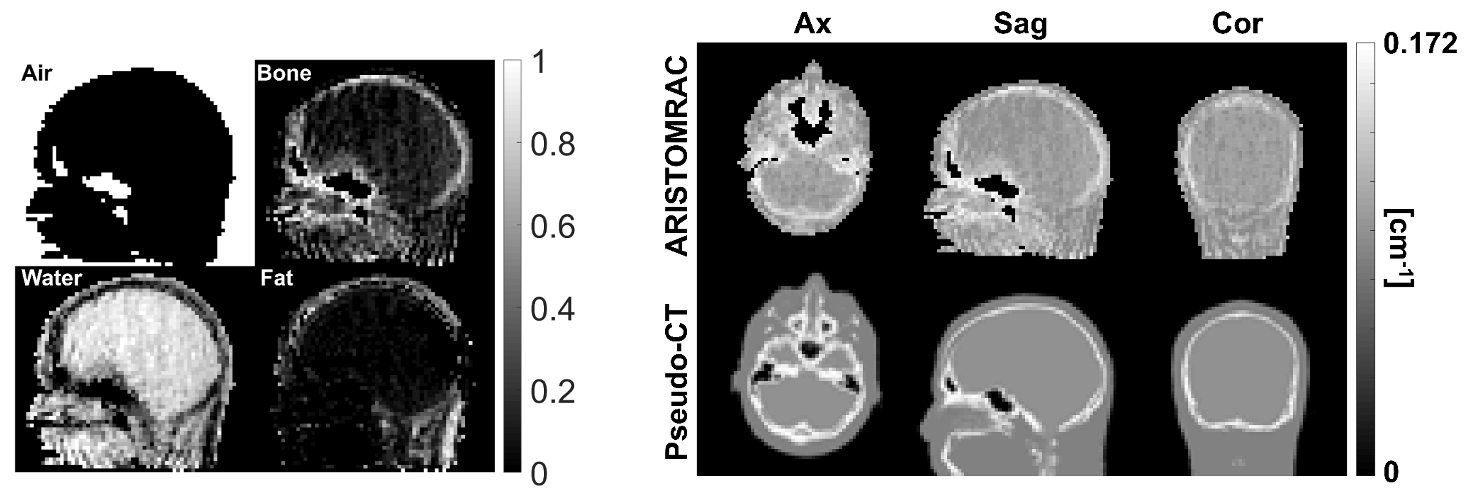
To test the in vivo capability of the technique, a healthy human volunteer was scanned. Attenuation maps were calculated as a weighted sum of the attenuation coefficient of water, fat and bone (respectively2 0.09, 0.1 and 0.172 cm-1), with weightings given from DB-AC and references tissue fractions14.
Results
We successfully obtained tissue fraction maps in vitro, as shown in Figure 2, with good agreement between the measured tissue fractions and the reference values: CCC was 0.90 for bone fraction, 0.94 for water fraction and 0.96 for fat fraction. Using the matching cost function we were able to discriminate air from tissue: despite the low signal, bone was classified as a tissue while the background was classified as air, and the resulting Dice similarity index was 0.99. Histograms in Figure 3 demonstrate sub-voxel quantification capability of the technique. For an artificial resolution of 8mm isotropic, quantification remained accurate (mean error < 0.05). By further degrading the resolution to 16mm isotropic, accuracy decreased. DB-AC tends to slightly overestimate tissue fraction values: this might be interpreted as classification of mixed air-tissue voxels as pure tissue voxels. In the in vivo experiment (shown in Figure 4), mouth and nasal sinus were correctly classified as air; the skull is clearly visible in the bone fraction map, subcutaneous fat is correctly reconstructed in the fat fraction map and the rest of the tissues are mostly classified as soft tissues, as expected. This is reflected in the good visual agreement between the DB-AC attenuation map and the reference one.Discussion
Our technique was able to provide correct tissue fraction maps both in vitro and in vivo. Importantly, the acquisition was performed directly at PET resolution, thus achieving a short acquisition time (123s). The main limitation of the technique is that each voxel is classified either as air or as a mixture of tissues, thus limiting the accuracy of attenuation maps at tissue-air interfaces. Further extension of this work could be dedicated to overcoming this limit and to test the impact of the technique on the accuracy of PET uptakes quantification.Conclusion
We demonstrated a technique to obtain attenuation coefficient maps of the tissues within a single fast acquisition directly at PET resolution.Acknowledgements
No acknowledgement found.References
1. Wagenknecht G, Kaiser HJ, Mottaghy FM, Herzog H. MRI for attenuation correction in PET: Methods and challenges. Magn Reson Mater Physics, Biol Med. 2013;26(1):99-113.
2. Berker Y, Franke J, Salomon A, Palmowski M, Donker HCW, Temur Y, Mottaghy FM, Kuhl C, Izquierdo-Garcia D, Fayad ZA, Kiessling F, Schulz V. MRI-Based Attenuation Correction for Hybrid PET/MRI Systems: A 4-Class Tissue Segmentation Technique Using a Combined Ultrashort-Echo-Time/Dixon MRI Sequence. J Nucl Med. 2012;53(5):796-804.
3. Ma D, Gulani V, Seiberlich N, Liu K, Sunshine JL, Duerk JL, Griswold MA. Magnetic resonance fingerprinting. Nature. 2013;495(7440):187-92.
4. Deshmane A, Ma D, Jiang Y, Fisher E, Seiberlich N, Gulani V, Griswold M. Validation of Tissue Characterization in Mixed Voxels Using MR Fingerprinting. In: Proceedings of the 22th Annual Meeting of ISMRM. Milan; 2014:94.
5. Hamilton JI, Griswold MA, Seiberlich N. MR Fingerprinting with chemical exchange (MRF-X) to quantify subvoxel T1 and extracellular volume fraction. 2015.
6. McGivney D, Deshmane A, Jiang Y, Ma D, Badve C, Sloan A, Gulani V, Griswold M. Bayesian estimation of multicomponent relaxation parameters in magnetic resonance fingerprinting. Magn Reson Med. November 2017.
7. Weigel M. Extended phase graphs: Dephasing, RF pulses, and echoes - Pure and simple. J Magn Reson Imaging. 2015;41(2):266-295.
8. Hennig J, Hodapp M. Burst imaging. Magma Magn Reson Mater Physics, Biol Med. 1993;1(1):39-48.
9. Friston KJ (Karl J., Ashburner J, Kiebel S, Nichols T, Penny WD. Statistical Parametric Mapping : The Analysis of Funtional Brain Images. Elsevier/Academic Press; 2007.
10. Huang Y, Parra LC. Fully Automated Whole-Head Segmentation with Improved Smoothness and Continuity, with Theory Reviewed. Strack S, ed. PLoS One. 2015;10(5):e0125477.
11. Lin LI-K. A Concordance Correlation Coefficient to Evaluate Reproducibility. Biometrics. 1989;45(1):255.
12. Dice LR. Measures of the Amount of Ecologic Association Between Species. Ecology. 1945;26(3):297-302.
13. Sorensen T. A Method of Establishing Groups of Equal Amplitude in Plant Sociology Based on Similarity of Species Content. Det Kong Danske Vidensk, Selesk Biol Skr. 1948;5(1):1-34.
14. Zaidi H, Montandon M-L, Slosman DO. Magnetic resonance imaging-guided attenuation and scatter corrections in three-dimensional brain positron emission tomography. Med Phys. 2003;30(5):937-948.
Figures