0260
Assessment of intracellular lactate relaxation, production and efflux rates in cells using hyperpolarized 13C MR1University of California, Berkeley, Berkeley, CA, United States, 2Department of Radiology, University of California, San Francisco, San Francisco, CA, United States
Synopsis
Enzymatic conversions can now be measured with hyperpolarized 13C MR on a sub-minute time scale. Using this technology we have shown that renal cell carcinoma cells of varying aggressiveness in 3D culture in bioreactors (5mm NMR tube) can monitor both lactate production and its efflux in real time. Using this platform, we have robustly characterized certain parameters that are difficult to measure in vivo, such as intracellular longitudinal relaxation time and kinetic transport rate. Further validation of these measures were obtained by fitting the same model to data from cells treated with transporter inhibitor.
Purpose
We have previously shown in patient derived renal cancer tissue that both lactate production and efflux are hallmarks of aggressive cancers and can be assessed by hyperpolarized 13C MR1 . Our work and others2-5 highlights the differential compartmentation of lactate that occurs during the lifetime of the hyperpolarized signals, and accurate modeling of these signals is difficult. This is due in part to the challenge in measuring the membrane transport rates and intracellular relaxation rates in situ. Here we present comprehensive modeling of the hyperpolarized lactate signals arising from the intracellular (Lin), as well as the extracellular (Lex), compartments to elucidate previously inaccessible parameters of intracellular metabolite longitudinal relaxation and the rate of transport of lactate from the intracellular compartment to outside the cell, KMCT4. This is enabled by a precision engineered continuous perfusion system used to measure dynamic signals in renal cancer cells, after injection with hyperpolarized pyruvate. The measured intracellular longitudinal relaxation time and kinetic transport rate are crucial in facilitating the interpretation and modeling of in vivo hyperpolarized data where currently these parameters are empirical or fixed to values of the extracellular compartment, thereby possibly obscuring important biological information.
Methods
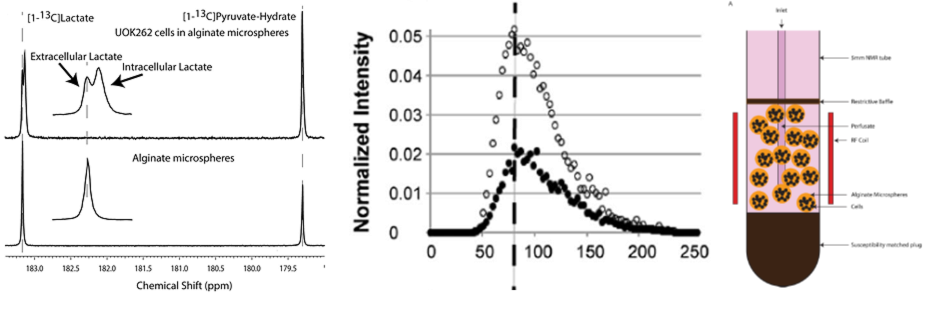
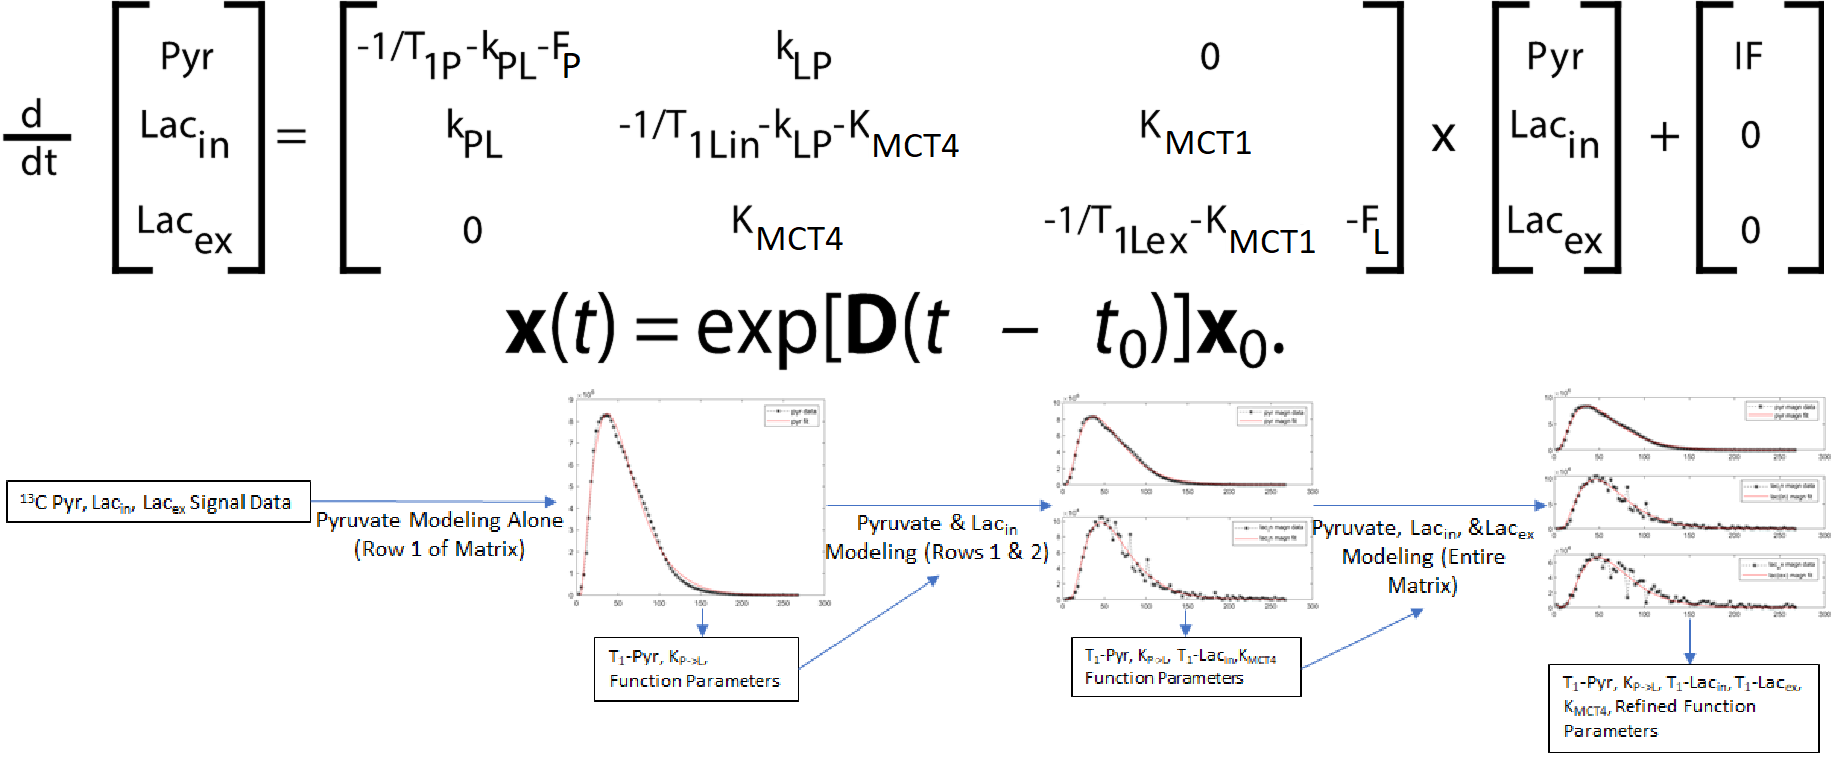
Three human cell lines from the kidney (HK-2 – normal renal epithelial cell (n = 3), UMRC6 – localized renal cell carcinoma (RCC) (n = 3), and UOK262 – metastatic RCC (control: n = 4, DIDS: n = 4) of varying lactate dehydrogenase (LDH enzyme, responsible for interconversion of lactate and pyruvate) and monocarboxylate (MCT4) transporters (facilitate pyruvate and lactate movement across cell membrane), were used. Cells were encapsulated in alginate microspheres in a 5 mm MR compatible bioreactor for HP [1-13C]-pyruvate experiments on the 11.7T Agilent spectrometer (Fig. 1). As previously published6 the intracellular and extracellular lactate peaks were distinguished via the 3 Hz chemical shift difference. The kinetic data was modeled using a 2-compartment model in Matlab in a step-wise manner to reliably estimate the kinetic parameters (Fig. 2), assuming a gamma variate input function. To validate changes in KPL and KMCT4, small molecule inhibition (DiDS, monocarboxylate transporter inhibitor, n = 4) was used to restrict lactate efflux in UOK262 cells. LDH activity and mRNA expression of the MCT4 were obtained from Sriram et al6.Results
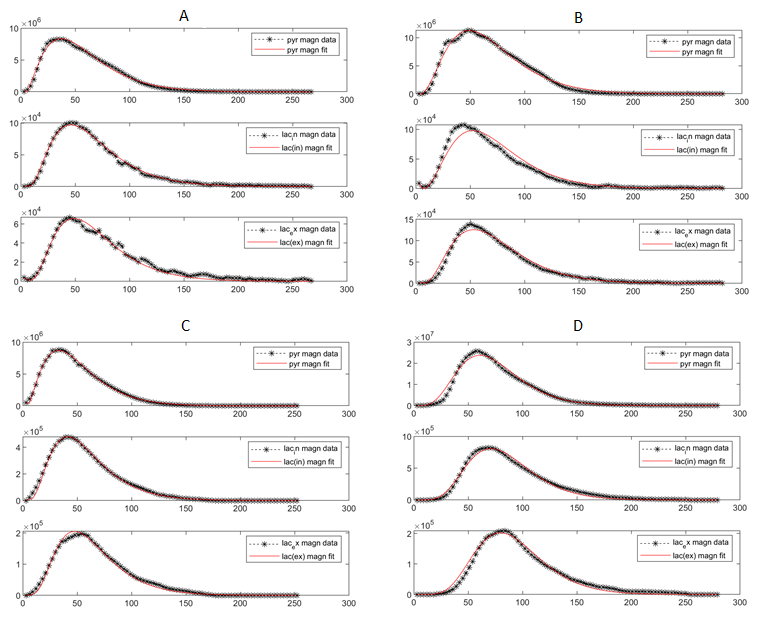
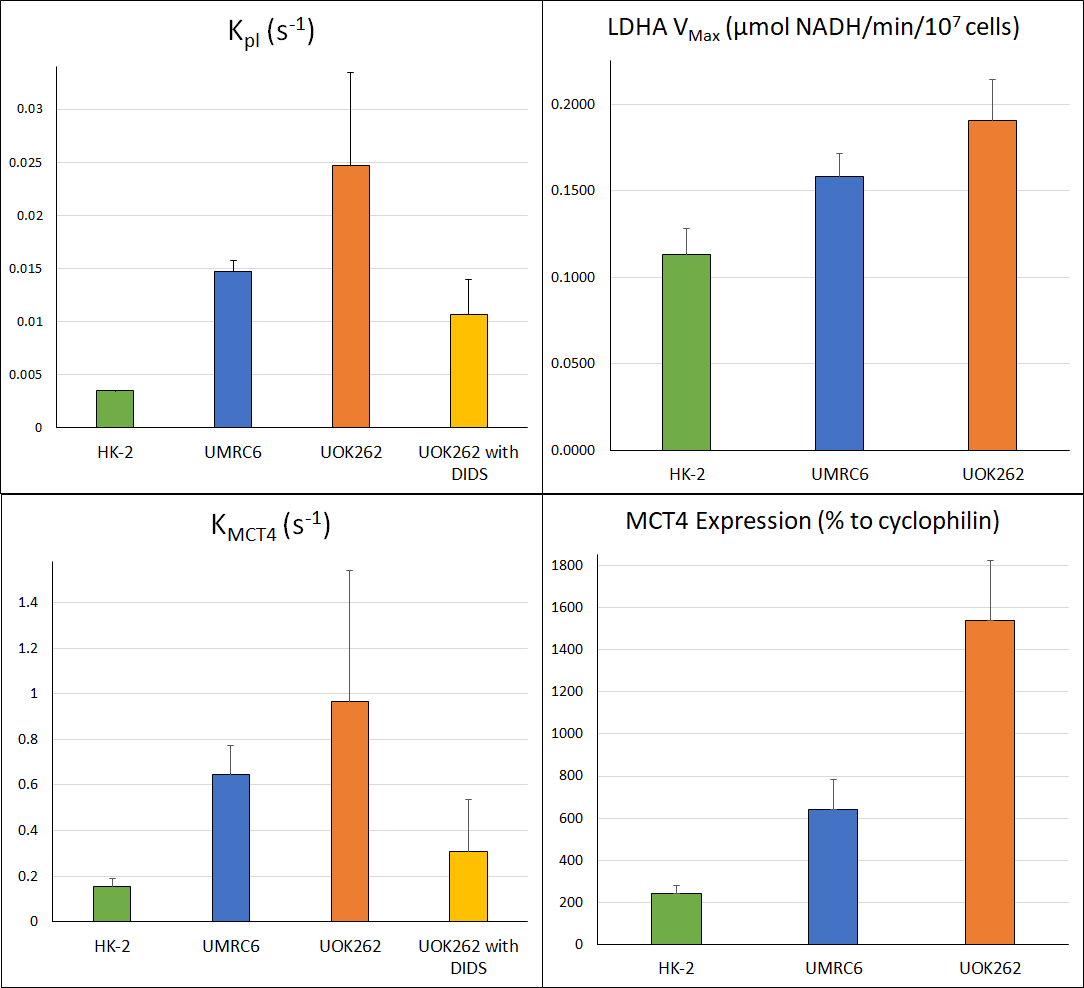
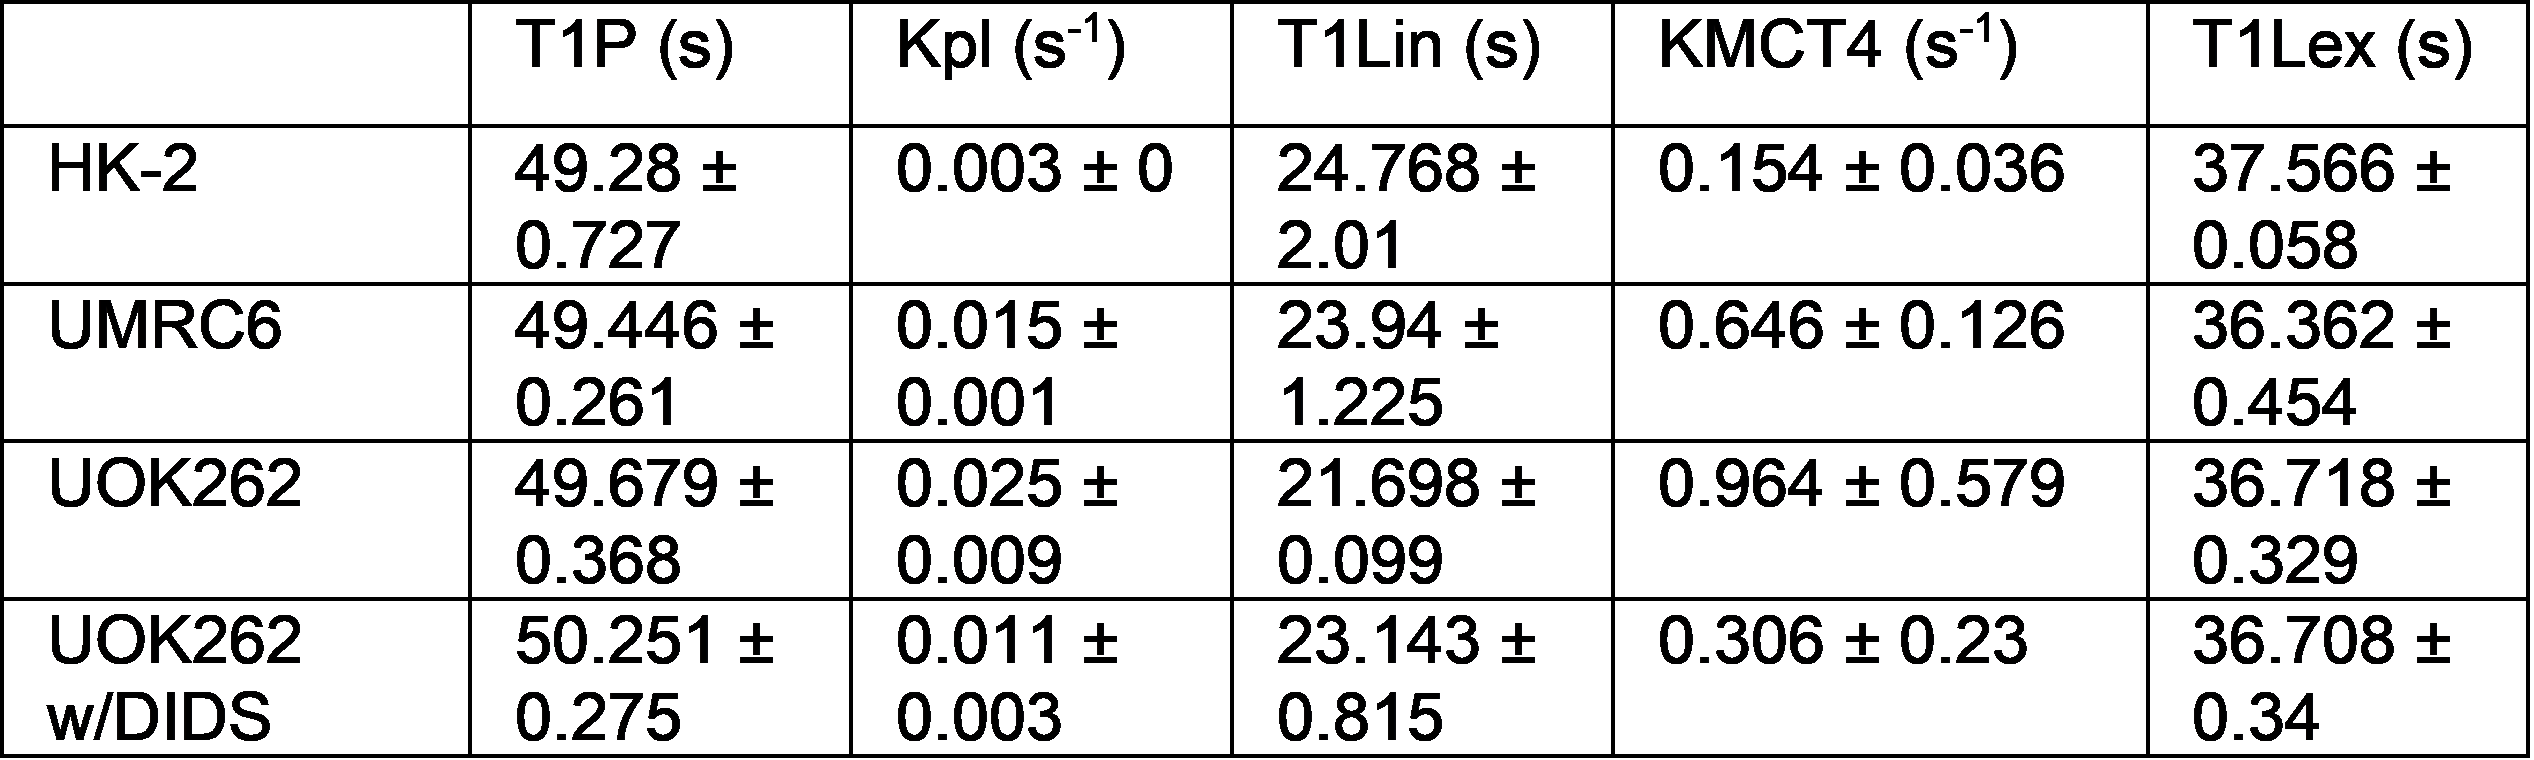
The first-pass optimization using kinetic data obtained from dissolution of hyperpolarized pyruvate and lactate into perfused bioreactors containing cell-free alginate microspheres, yielded initial estimates of T1 values, as well as estimates of the input function and bioreactor flow parameter. Using this as the initial estimate, the kinetic data form the cells were modeled as shown in Fig. 3 and a mean extracellular T1 for pyruvate and lactate of 49.49 ± 0.25 s and 36.87 ± 0.23 s was obtained, similar to published values7. Using the differential equations shown in Fig. 2, we extracted the apparent rate of conversion of pyruvate to lactate, KPL; HK-2=0.0035 ± 4.8*10-5 s-1, UMRC6=0.015 ± 0.001 s-1 and UOK262=0.02 ± 0.008 s-1, mirroring the expected LDH activity trend in these cells (Fig. 4). The intracellular T1 of lactate was consistently estimated in the three cells to be on average 23.29 ± 0.76 s. The rate of lactate efflux also increased from HK-2 (0.154 ± 0.036 s-1) to UMRC6 (0.646 ± 0.126 s-1) to UOK262(0.964 ± 0.579 s-1) cells as expected based on the mRNA expression (Fig. 4). Furthermore, based on the DiDS inhibition data, we found no significant change in the T1 estimates of pyruvate, Lin and Lex. However, we found a significant decrease in KPL (47%, 0.011 ± 0.003 s-1) as well as KMCT4 (68%, 0.306 ± 0.23 s-1) compared to untreated UOK262 cells.Discussion & Conclusion
These results demonstrate the robust multi-parametric modeling of dynamic hyperpolarized signals in their different compartments, with the rate constants KPL and KMCT4 reflecting the biological assays. We have shown a reliable estimate in situ of intact cells in physiologically relevant conditions of intracellular longitudinal relaxation time of 23 s and well within the estimate of prior works based on model systems3,4. Furthermore, we found in the renal cells, the KMCT4 to be 4 to 50 fold higher than the KPL, indicating that lactate efflux rate is a highly significant parameter. These measurements can be critical in interpreting and modeling in vivo hyperpolarized signals, especially in the setting of aggressive disease, which is strongly associated with upregulated MCT4 and lactate efflux.Acknowledgements
UCSF Surbeck Lab and Biomedical NMR Lab –Subramaniam Sukumar PhD, Romelyn DeLos Santos, Jeremy Bancroft Brown, Jinny Sun, Natalie Korn, Justin DeLos Santos, Dave Korenchan, and Jessie Lee. Grant Support: National Institutes of Health (PC160630, U01 CA217456, R01 EB013427, R01 EB017449, R01 CA183071, P41 EB013598, R21 EB005363, R00 EB014328 and R01 CA166655) and Department of Defense (USAMRMC CA110032)References
1.Sriram, R. et al. Non-Invasive Differentiation of Benign Renal Tumors from Clear Cell Renal Cell Carcinomas Using Clinically Translatable Hyperpolarized 13C Pyruvate Magnetic Resonance. Tomography 2, 35–42 (2016).
2. Harris, T., Eliyahu, G., Frydman, L. & Degani, H. Kinetics of hyperpolarized 13C1-pyruvate transport and metabolism in living human breast cancer cells. Proc. Natl. Acad. Sci. U.S.A. 106, 18131–18136 (2009).
3. Reineri, F., Daniele, V., Cavallari, E. & Aime, S. Assessing the transport rate of hyperpolarized pyruvate and lactate from the intra- to the extracellular space. NMR Biomed. 29, 1022–1027 (2016).
4. Karlsson, M. & Jensen, P. R. Difference between Extra‐and Intracellular T1 Values of Carboxylic Acids Affects the Quantitative Analysis of Cellular Kinetics by Hyperpolarized NMR. Angewandte … (2016). doi:10.1002/ange.201607535
5. Koelsch, B. L. et al. Diffusion MR of hyperpolarized 13C molecules in solution. Analyst 138, 1011–1014 (2013).
6. Sriram, R. et al. Real-time measurement of hyperpolarized lactate production and efflux as a biomarker of tumor aggressiveness in an MR compatible 3D cell culture bioreactor. NMR Biomed. 28, 1141–1149 (2015).
7. Keshari, K. R. & Wilson, D. M. Chemistry and biochemistry of 13C hyperpolarized magnetic resonance using dynamic nuclear polarization. Chem. Soc. Rev. 43, 1627–1659 (2014).
Figures