0258
Imaging metabolic heterogeneity in breast cancer using hyperpolarized 13C-MRSI1Department of Radiology, University of Cambridge, Cambridge, United Kingdom, 2CRUK Cambridge Institute, Cambridge, United Kingdom, 3Cambridge Breast Unit, Addenbrooke's Hospital, Cambridge University Hospital NHS Foundation Trust, NIHR Cambridge Biomedical Research Centre, Cambridge, United Kingdom, 4Department of Radiology, Cambridge University Hospitals NHS Foundation Trust, Cambridge, United Kingdom, 5Rapid Biomedical GmbH, Rimpar, Germany, 6Department of Oncology, University of Cambridge, Cambridge, United Kingdom, 7Department of Radiology, Addenbrooke’s Hospital, Cambridge University Hospital NHS Foundation Trust and NIHR, Cambridge, United Kingdom, 8Cambridge Breast Unit, Addenbrooke’s Hospital, Cambridge University Hospital NHS Foundation Trust and NIHR, Cambridge, United Kingdom
Synopsis
13C magnetic
resonance spectroscopic imaging (13C-MRSI)
is a promising technique for elucidating metabolic heterogeneity in breast
cancer. We used 13C-MRSI to evaluate the extent of glycolysis in different
histologic and molecular breast cancer subtypes and correlated these findings
with the expression of a key transmembrane transporter (MCT1) and glycolytic
enzyme (LDHA). In addition to a strong correlation between glycolysis and tumor
volume, there was higher expression of MCT1 and LDHA as well as CAIX, a hypoxia
marker, in the more glycolytic tumors. This is the first study in humans to demonstrate
the relationship between intertumoral heterogeneity on gene expression analysis
and 13C-MRSI.
Introduction
The molecular heterogeneity of breast cancer has important implications for determining appropriate treatment, clinical outcome and prognostication.1 Tumor metabolism offers the potential to stratify tumors in new ways, which are complementary to histological and molecular profiling.2,3 A major metabolic change in most cancer types is a switch to aerobic glycolysis known as the Warburg effect; together with the hypoxic microenvironment, this results in increased tissue lactate formation. 13C magnetic resonance spectroscopic imaging (13C-MRSI) using hyperpolarized [1-13C]pyruvate is an emerging technique that offers the potential for MR imaging of metabolism in vivo with unprecedented sensitivity.4 The hyperpolarized 13C-label exchange between pyruvate and the endogenous lactate pool, catalyzed by lactate dehydrogenase A (LDHA)can be imaged in real time.5Methods
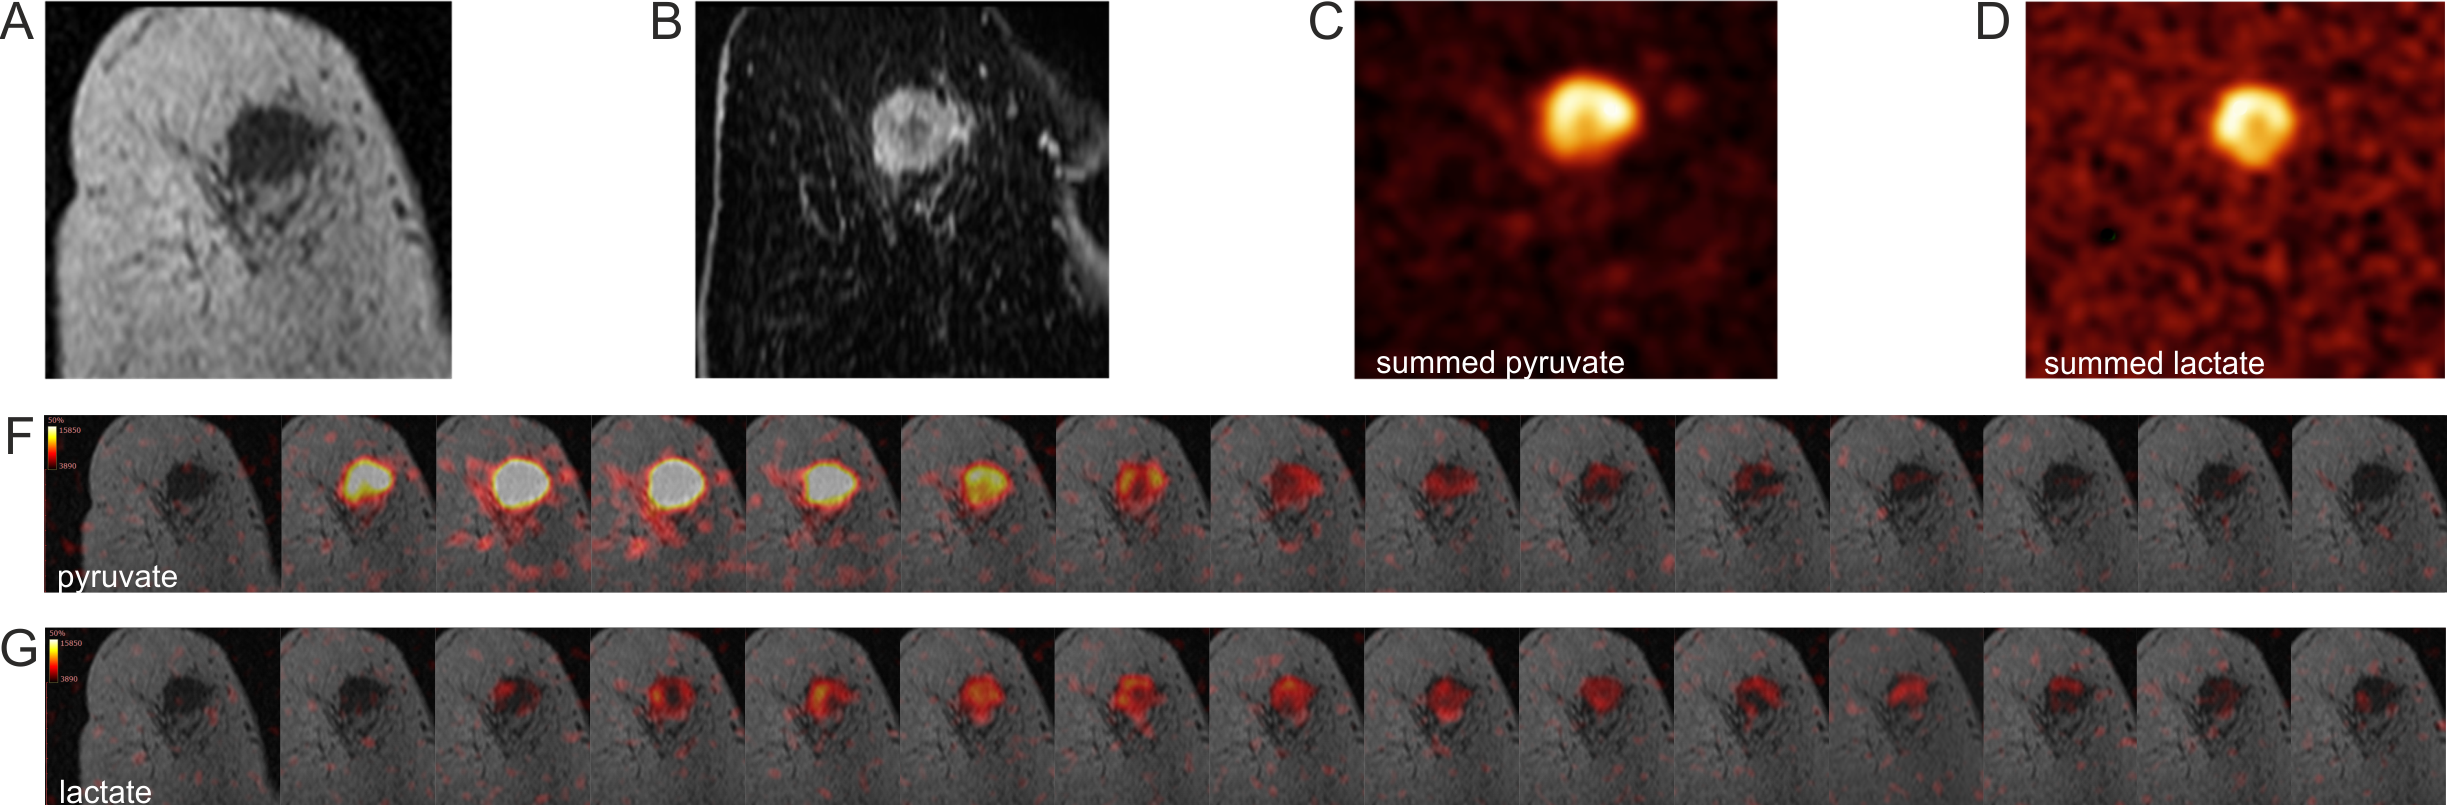
Seven patients diagnosed with breast cancer were imaged on a 3T MRI system (MR750; GE Healthcare, Waukesha, WI, USA), using an 8 channel 13C tuned breast coil (Rapid Biomedical, Rimpar Germany). [1-13C]pyruvate was hyperpolarized in a clinical hyperpolarizer (Research Circle Technology, Albany NY). 13C-MRSI acquisition was performed using a dynamic IDEAL spiral sequence6 (nominal flip angle of 10-15°, acquisition time 60 s, temporal resolution 2-4 s, TR 0.26-0.5 s, slice thickness 3 cm, gap 3 mm, FOV 200-240 mm, an acquired data matrix of 40x40 points interpolated to 128x128 ). Complex data were summed over time and tumor regions of interest (ROIs) were generated based on thresholding of the summed lactate and pyruvate signals. The summed signal-to-noise ratios for lactate (summed SNRLAC) and pyruvate (summed SNRPYR) were calculated using the formula $$ SNR_{metabolite}=\frac{mean SI_{ROI tumor}-meanSI_{noise}}{\sqrt{2} S.D.(SI_{noise})} $$ Mean and standard deviation (S.D.) of noise signal intensity (SInoise) were calculated using entire images of metabolites other than lactate or pyruvate which were visually confirmed not to contain signal. The lactate to pyruvate ratio (LAC/PYR) was then calculated. For six patients, sections of formalin-fixed, paraffin-embedded tumor blocks underwent immunohistochemistry (IHC) for carbonic anhydrase 9 (CAIX), monocarboxyl acid transporter 1 (MCT1) and CD31; RNA from snap frozen tumor tissue sections of six patients was extracted. RNA sequencing libraries were sequenced as paired-ends to a mean coverage of x150. Gene count data were normalized, scaled, and corrected for batch effects. Pearson’s and Spearman’s correlations were used depending on data distribution. P-values ≤0.05 were considered significant.Results
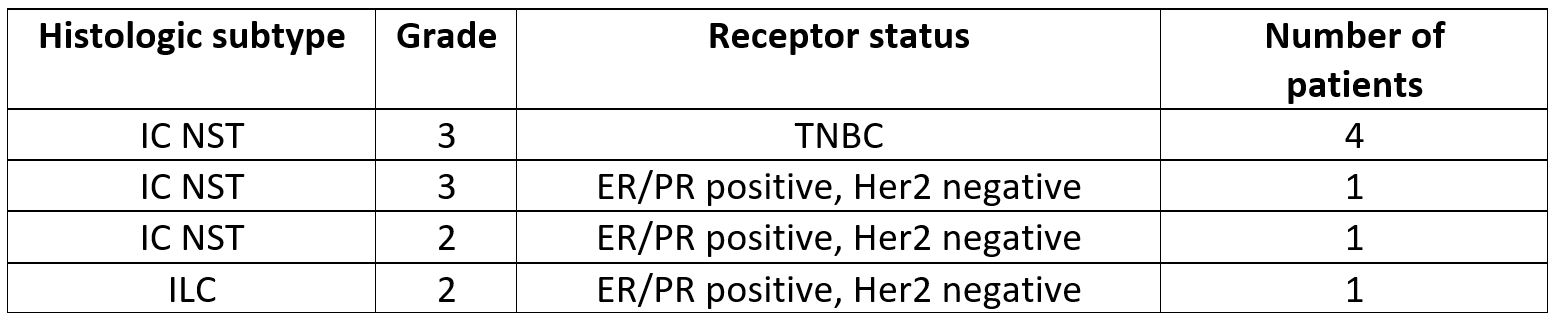
Data acquired in seven patients (Table 1) were included in quantitative analyses.
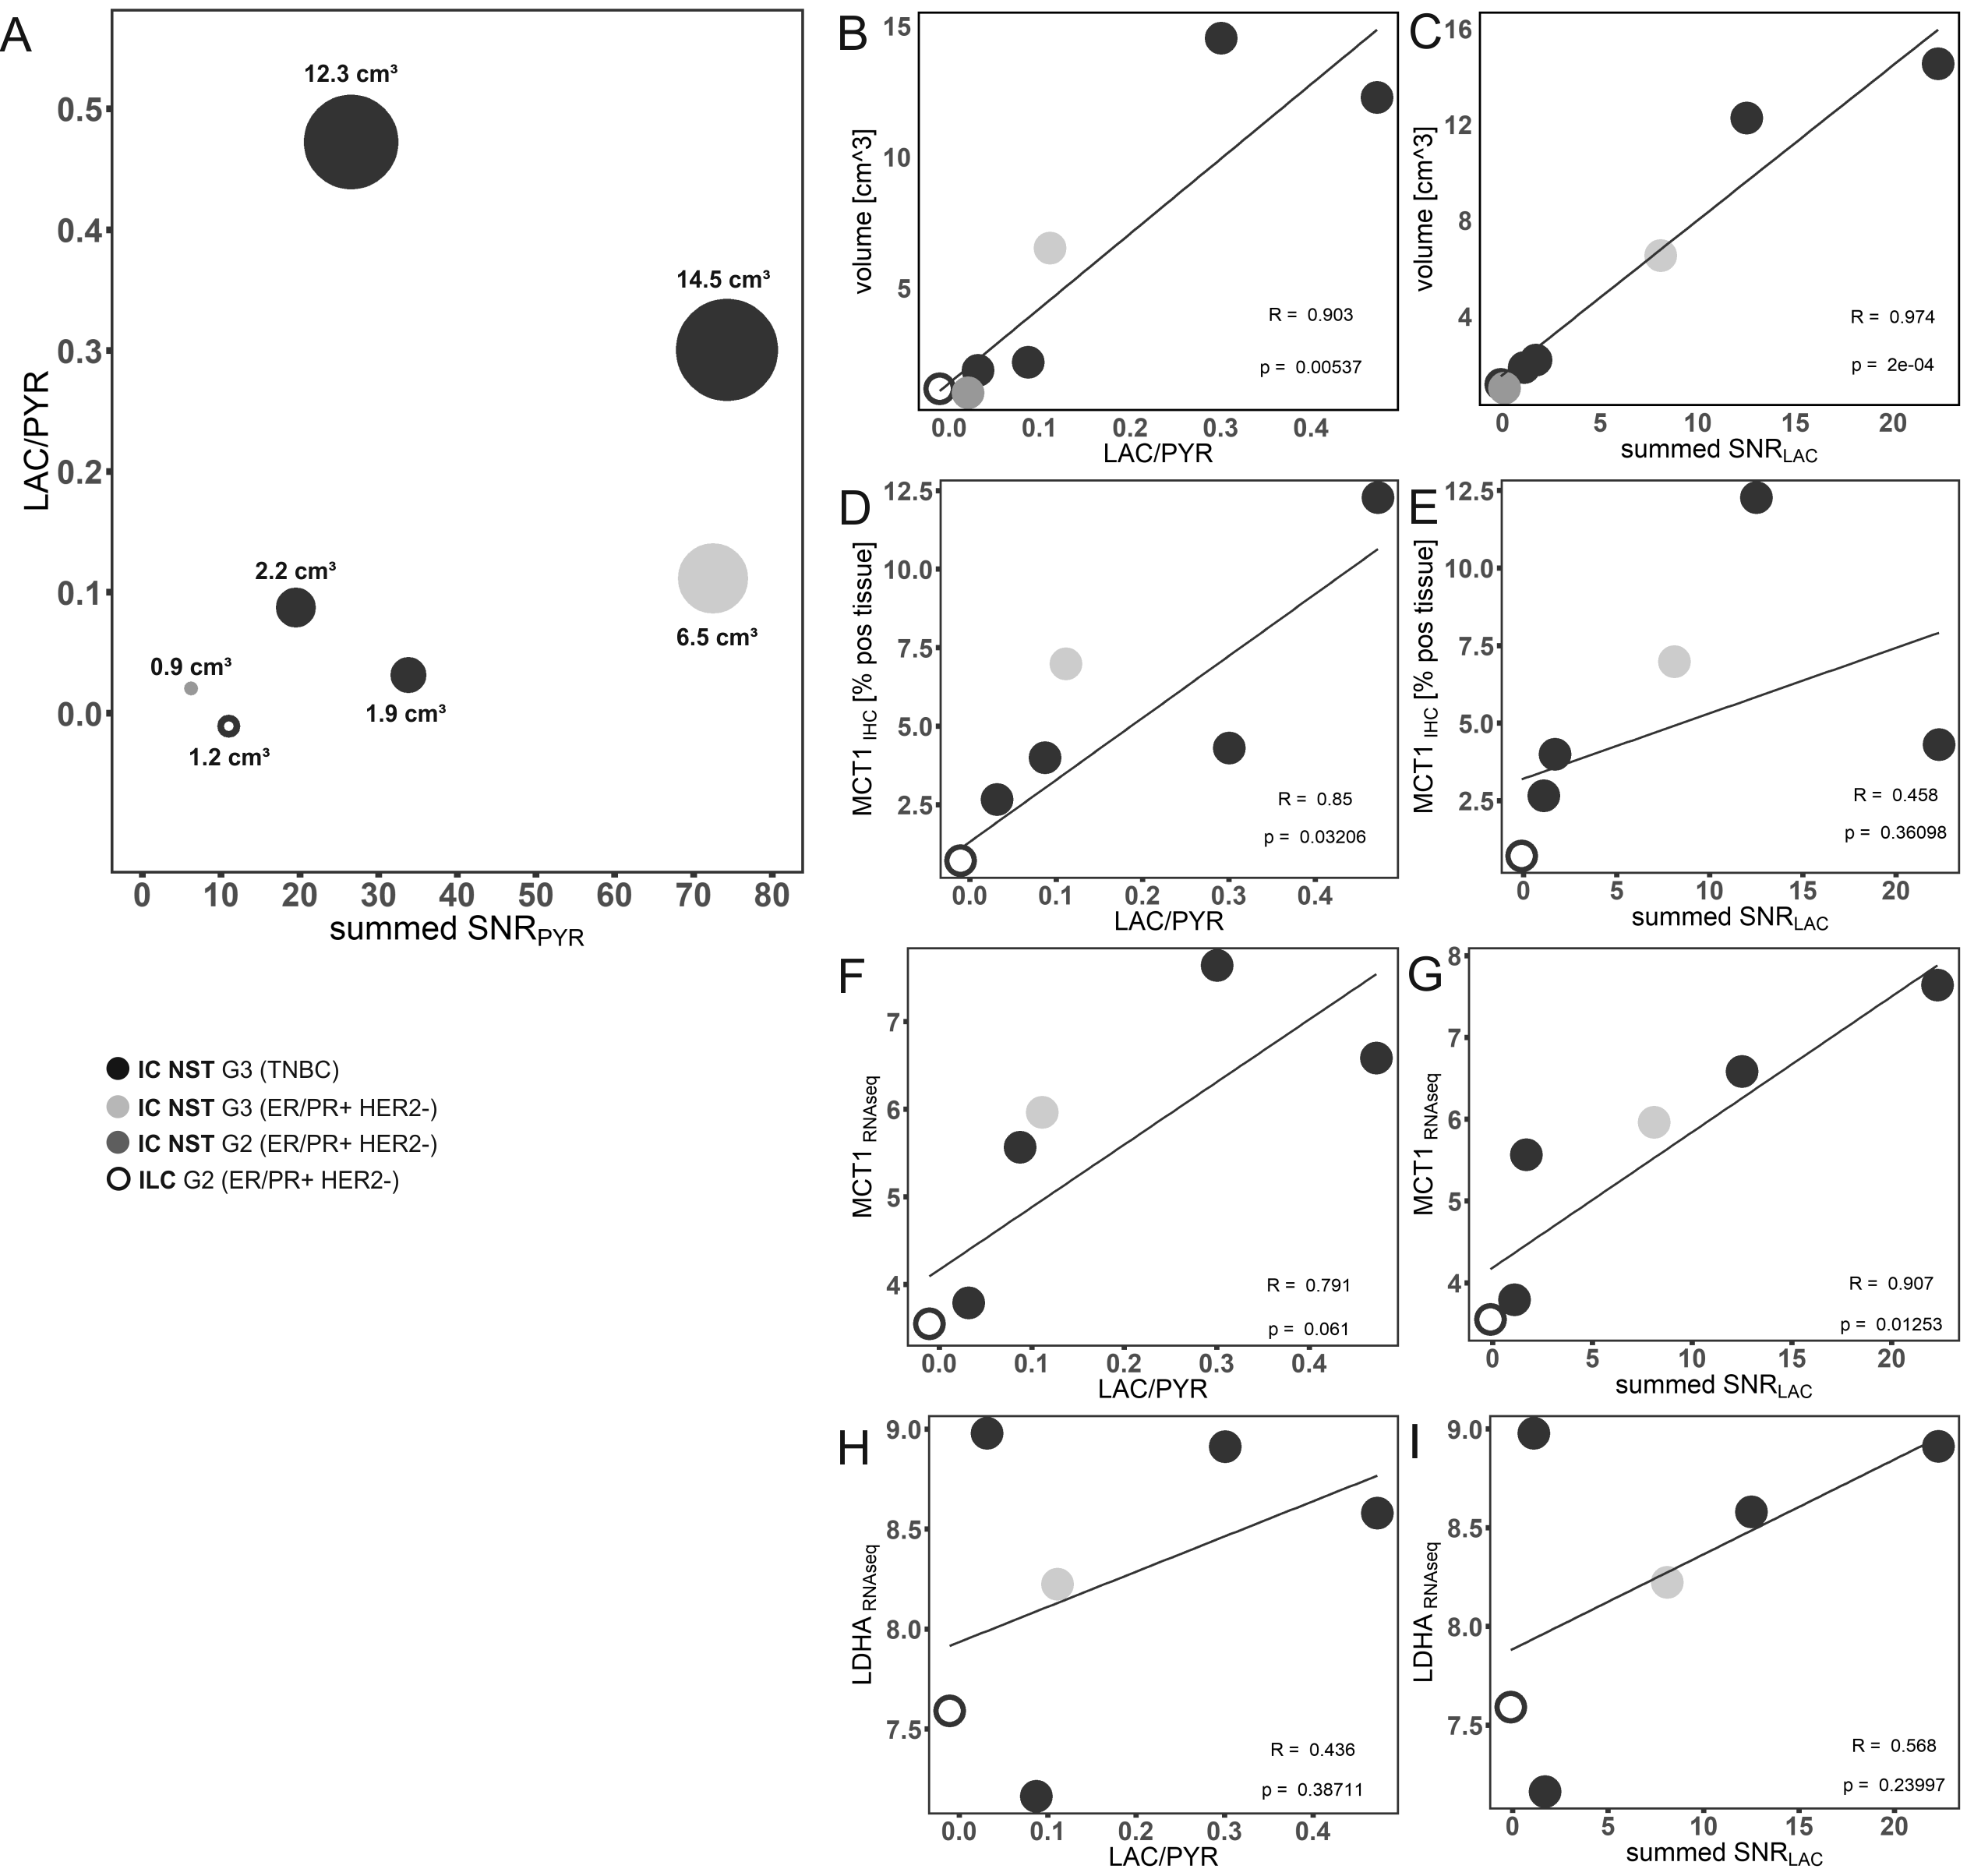
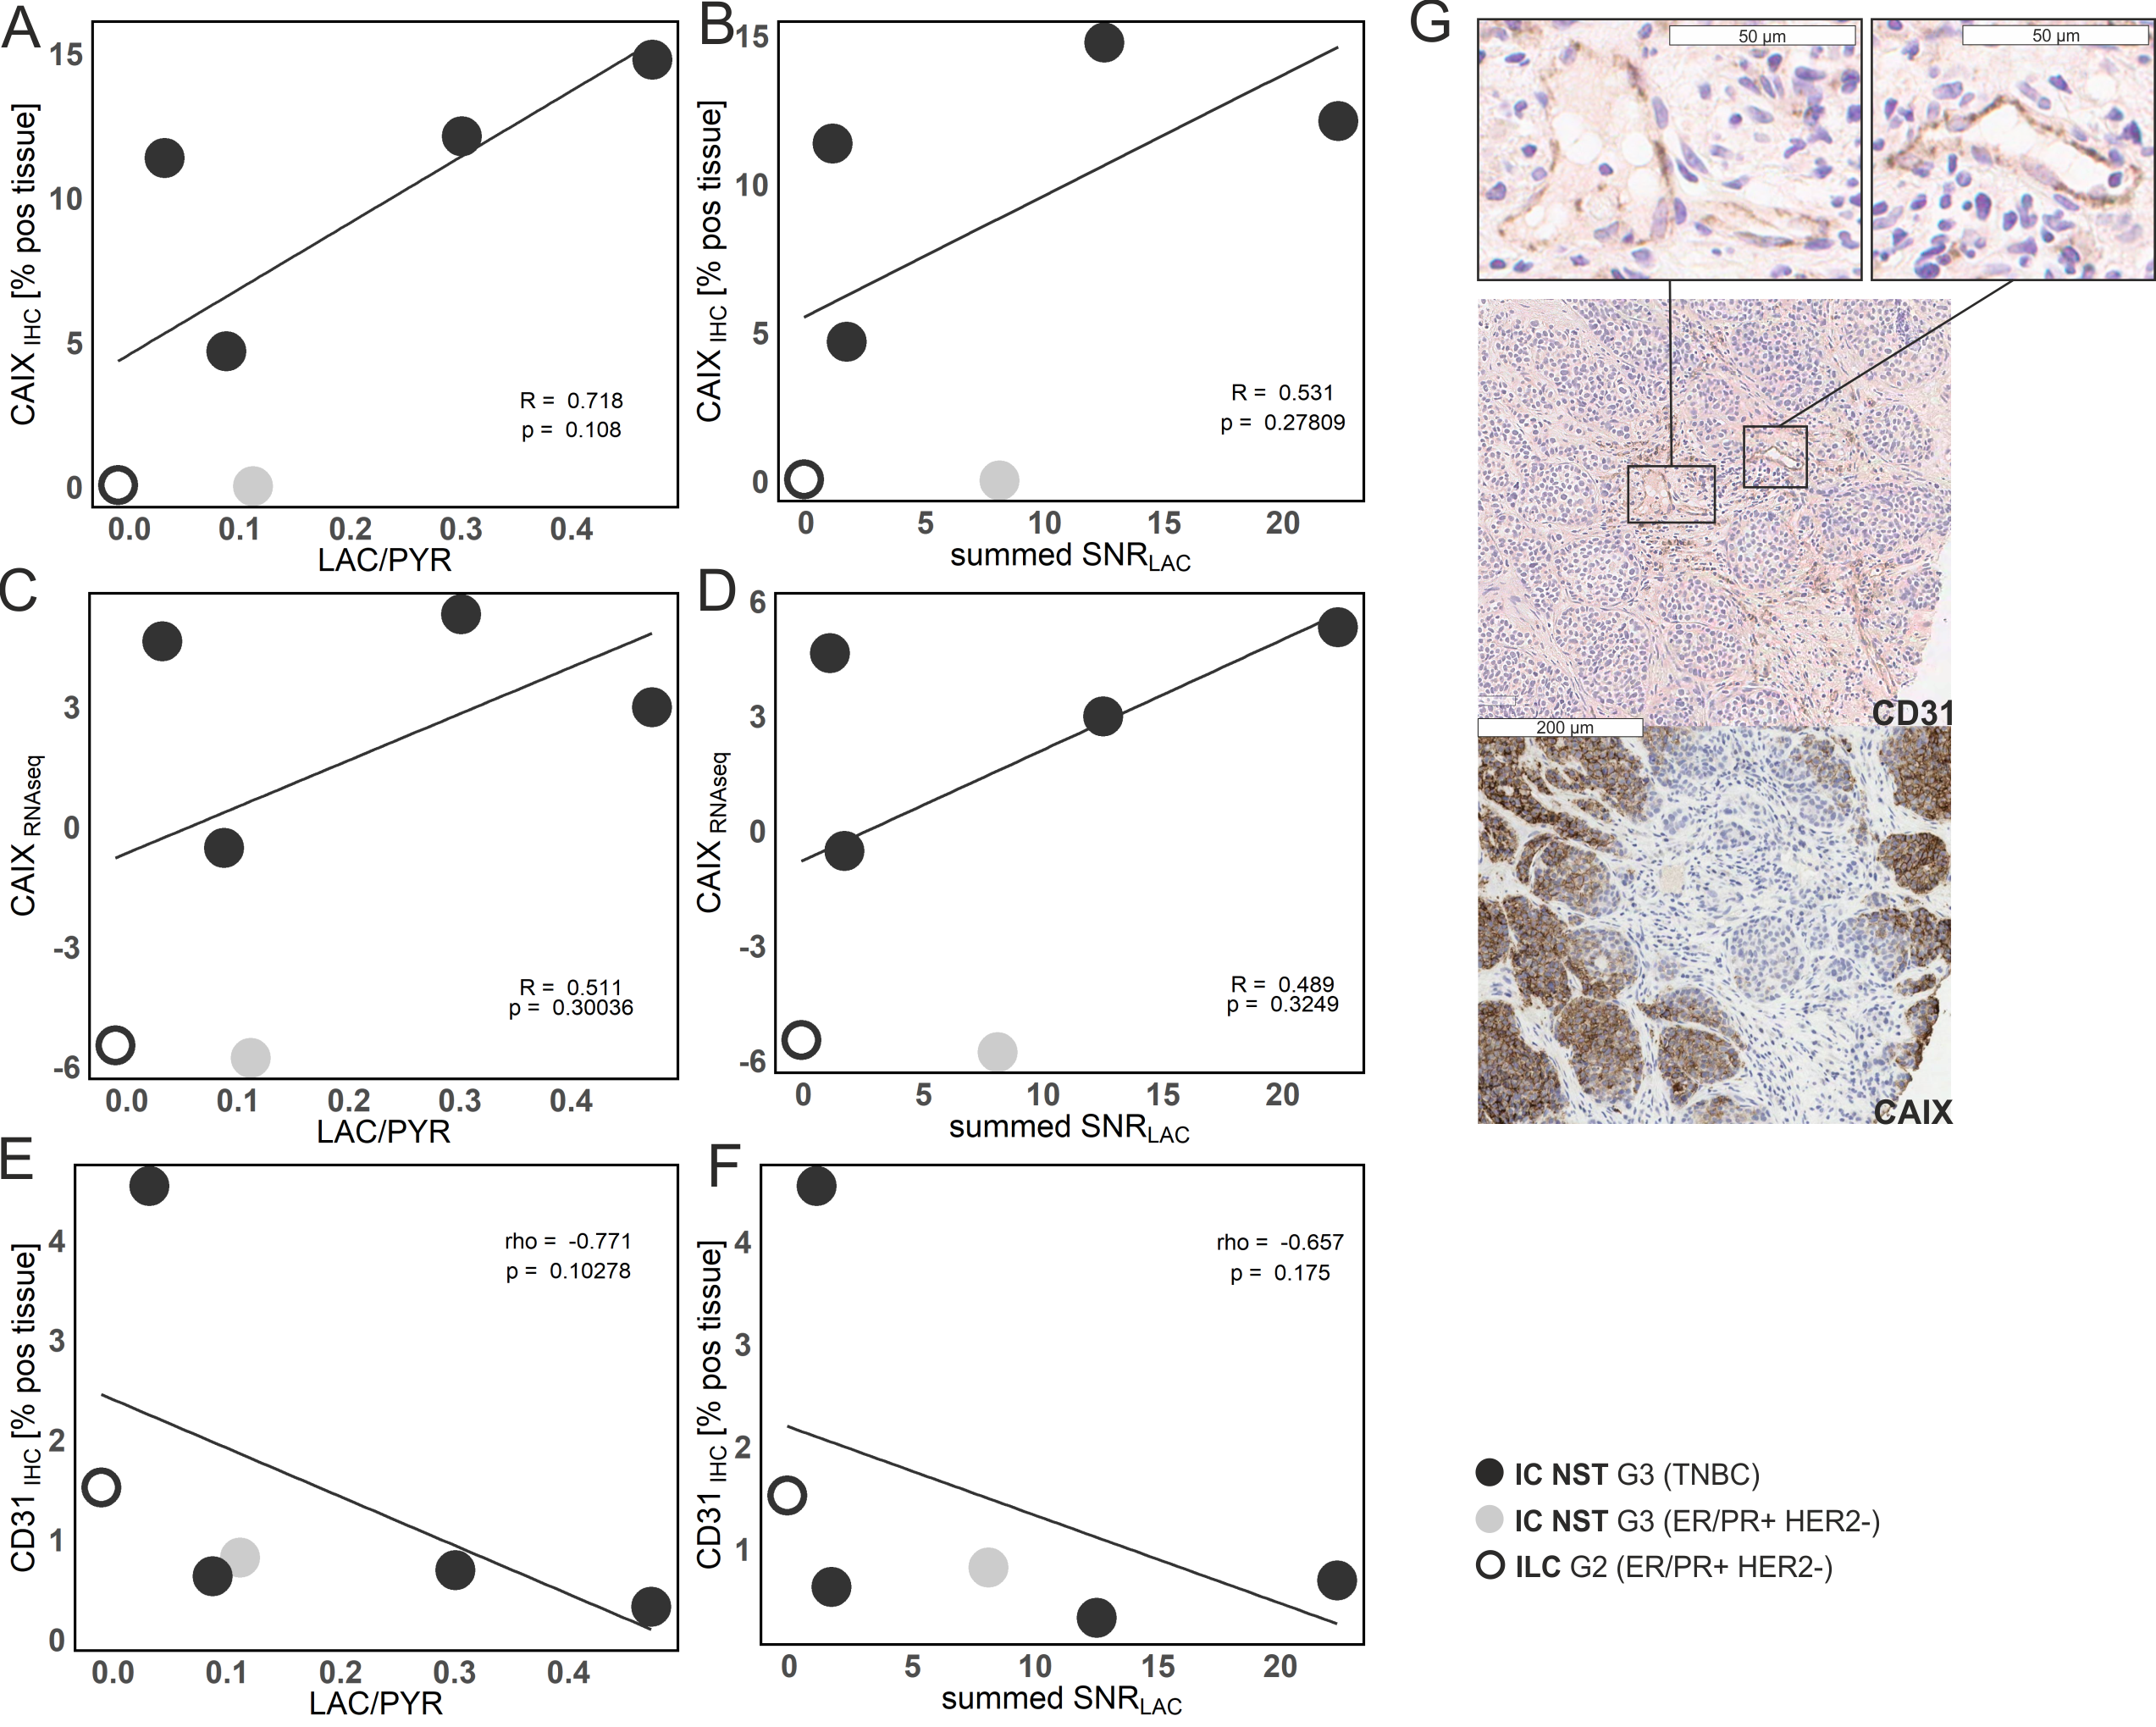
A representative case is shown in Figure 1. Intertumoral heterogeneity in the summed lactate-to-pyruvate ratios (LAC/PYR) was observed across all tumor subtypes (ranges: 0.021 - 0.473; mean ± S.D. = 0.145 ± 0.164) as well as within the subgroup of TNBC patients (ranges: 0.031-0.473). Both, summed SNRLAC and LAC/PYR on 13C-MRSI showed highly significant correlations with tumor volumes (R = 0.974, p <0.001 and R = 0.903, p = 0.005; Figure 2A-C). Correlation of LAC/PYR with the expression of MCT 1 was significant on IHC (R = 0.85, p = 0.032). Summed SNRLAC was significantly correlated with MCT1 on RNA sequencing (R = 0.907, p = 0.013; Figure 2D-G). Furthermore, a trend towards higher expression of LDHA and CAIX but lower CD31 in tumors with high levels of LAC/PYR and summed SNRLAC was observed (Figure 2H,I; Figure 3A-F).
Discussion
This study showed that the exchange of hyperpolarized 13C label between [1- 13C]pyruvate and the endogenous lactate pool can be imaged in real-time with 13C-MRSI across a range of breast tumors. Significant intertumoral metabolic heterogeneity was demonstrated, particularly in TNBC. This is the first clinical study to correlate hyperpolarized 13C-MRSI parameters with tumor expression of MCT1 and LDHA as well as markers of hypoxia and vascularity. The trend towards high CAIX and low CD31 in tumors with high LAC/PYR indicates that hypoxia might be a driver of glycolysis in breast cancer accounting also for the correlation of LAC/PYR with tumor volume and an increased lactate pool in hypoxic tumors.Conclusion
This study has shown that hyperpolarized 13C-MRSI is a promising technique to evaluate tumor metabolism in breast cancer. It has demonstrated metabolic heterogeneity among TNBC and emphasized the role of hypoxia in the promotion of glycolysis in breast cancer.Acknowledgements
Wellcome Trust, CRUK, Austrian Science Fund (J4025-B26)References
1. Curtis C, Shah SP, Chin S-F, et al. The genomic and transcriptomic architecture of 2,000 breast tumours reveals novel subgroups. Nature. 2012;486(7403):346-352. doi:10.1038/nature10983.
2. Cappelletti V, Iorio E, Miodini P, Silvestri M, Dugo M, Daidone MG. Metabolic Footprints and Molecular Subtypes in Breast Cancer. Dis Markers. 2017;2017:1-19. doi:10.1155/2017/7687851.
3. Kim S, Kim DH, Jung W-H, Koo JS. Metabolic phenotypes in triple-negative breast cancer. Tumor Biol. 2013;34(3):1699-1712. doi:10.1007/s13277-013-0707-1.
4. Nelson SJ, Kurhanewicz J, Vigneron DB, et al. Metabolic imaging of patients with prostate cancer using hyperpolarized [1-13C]pyruvate. Sci Transl Med. 2013;5(198):198ra108. doi:10.1126/scitranslmed.3006070.
5. Golman K, in ’t Zandt R, Thaning M. Real-time metabolic imaging. Proc Natl Acad Sci U S A. 2006;103(30):11270-11275. doi:10.1073/pnas.0601319103.
6. Wiesinger F, Weidl E, Menzel MI, et al. IDEAL spiral CSI for dynamic metabolic MR imaging of hyperpolarized [1-13C]pyruvate. Magn Reson Med. 2012;68(1):8-16. doi:10.1002/mrm.23212.
Figures