0256
Imaging the circumferential hyperpolarized 13C-bicarbonate distribution in the normal heart1University of Toronto, Toronto, ON, Canada, 2GE Healthcare, Toronto, ON, Canada, 3Medical Biophysics, University of Toronto, Toronto, ON, Canada, 4Physical Sciences Platform, Sunnybrook Research Institute, Toronto, ON, Canada
Synopsis
A typical observation in hyperpolarized 13C cardiac imaging is that the bicarbonate images are not circumferential, near the apex, even in healthy subjects, which precludes interrogation of metabolism in the posterior myocardium. A common explanation for the signal drop-off is anterior receive coil sensitivity. In this abstract, we demonstrate that this is not necessarily the case. A significant source of reduced signal results from B0 inhomogeneity in the posterior wall. Shortened readout durations which achieve higher kmax are shown to enable high resolution imaging of the circumferential bicarbonate distribution in pigs.
Introduction
Hyperpolarized 13C MRI is a promising tool for non-invasive characterization of in vivo metabolism[1]. The feasibility of acquiring hyperpolarized 13C data from human hearts following injections of HP [1-13C]pyruvate solution has been recently demonstrated[2,3]. A typical observation is that the 13C-bicarbonate images (which index PDH flux) are not completely circumferential even in healthy subjects, which precludes interrogation of metabolism in the posterior myocardium. A common explanation for the signal drop-off is anterior receive coil sensitivity [4]. In this abstract, we demonstrate that this is not necessarily the case. Instead, a significant source of reduced signal results from B0 inhomogeneity in the posterior wall. Shortened readout durations which achieve higher kmax are shown to enable high resolution imaging of the circumferential bicarbonate distribution in pigs.Methods
All scans were performed at 3T (GE MR750, GE Healthcare, Waukesha, MI). A Yorkshire pig was used in this experiment (weight 30 kg, HR 90 bpm). [1-13C]pyruvic acid (Isotec) was mixed with 15 mM AH111501 and polarized in a GE SpinLab DNP polarizer. Following dissolution and neutralization, 15 mL at 0.80 mmol/kg of [1-13C]pyruvate were injected at a rate of 1 mL/s, followed by 5 mL saline flush. 13C imaging was started 35 seconds after the start of injection, based on maximum bicarbonate signal in previously acquired dynamic data in the same pig. Two 13C-pyruvate infusions (~20 minutes apart) were performed.
Short-axis images of 13C-bicarbonate, [1-13C]lactate, and [1-13C]pyruvate were obtained using a multi-slice, spectrally-selective sequence covering the left ventricle (6 slices, scan duration 30 cardiac cycles, 3 slices/cardiac cycle, volume transmit coil, 2x4 channel 13C receive coil, placed on the anterior chest wall) [6]. The metabolite acquisition order is shown in Figure 1. In the new scheme (labeled “high-resolution”), a reduced flip angle is used for bicarbonate excitation along with finer spatial resolution. The original scheme (labeled “standard”) used a metabolite order previously used for clinical studies of the human heart with the same scan time. For a heart rate of 90 bpm, the total breath-held imaging time was 20 seconds. Following 13C imaging, dynamic 13C MRS (18° flip angle, 2 s temporal resolution) was used to monitor residual metabolic signals from the entire heart.
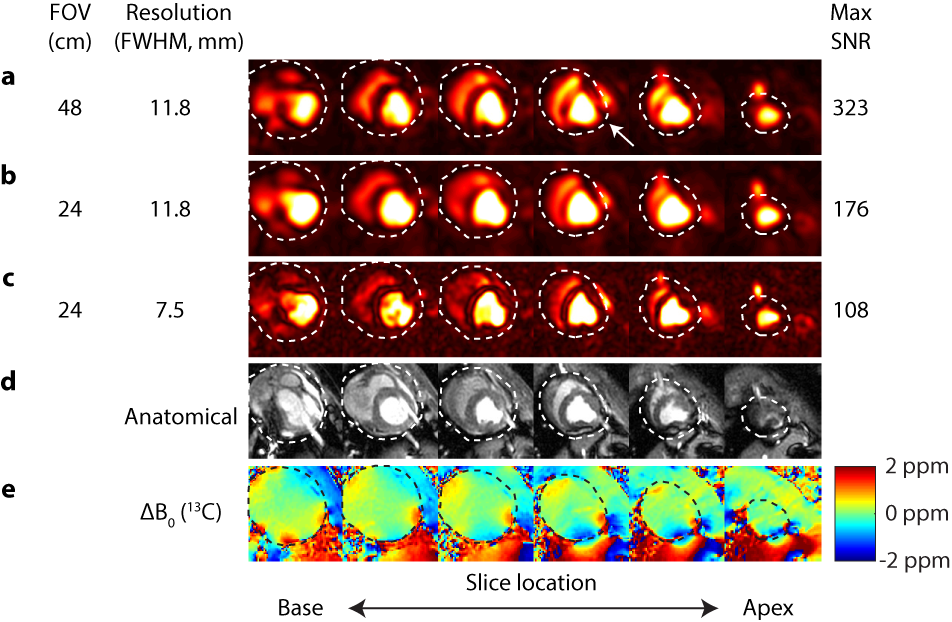
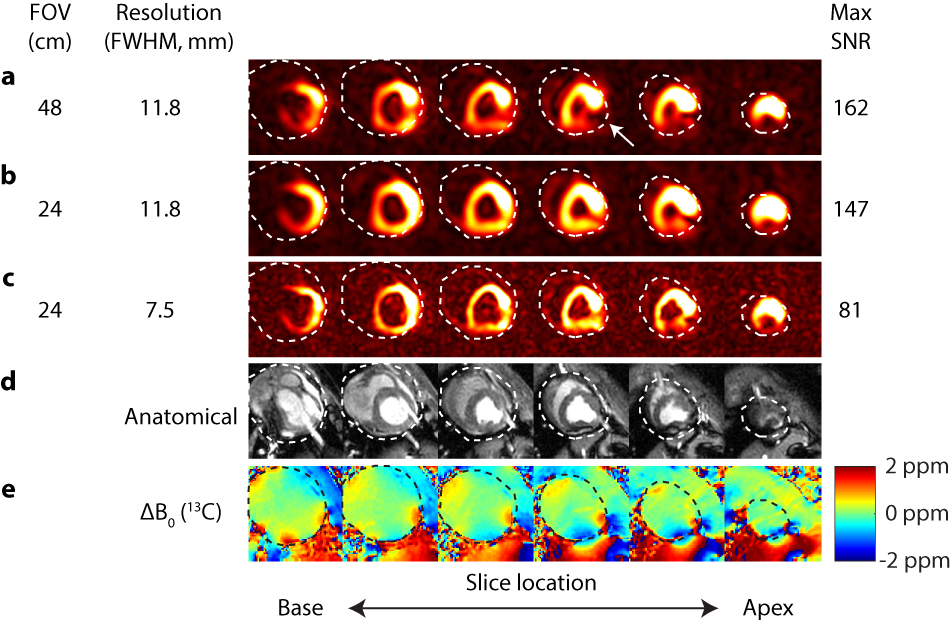
Images of bicarbonate and pyruvate were reconstructed with exponential filtering of the FID followed by gridding. Images from the high-resolution infusion were reconstructed either at 11.8 mm2 in-plane resolution (to match the reference resolution) or at 7.5 mm2 in-plane resolution (to keep the same time-domain weighting). Maximum SNR was used as an image quality metric.
Results and Discussion
Figures 2 and 3 shows pyruvate and bicarbonate images reconstructed using data from the two infusions. The maximum pyruvate SNR is reduced by 2-fold relative to the reference scheme. This is presumably due to obtaining images at different time points after injection. The arrow indicates the posterior wall. The receive coil sensitivity drop-off is not apparent in this subject.
The maximum bicarbonate SNR is reduced by less than 10% relative to the reference scheme. The arrow shows posterior signal loss in the reference scheme, which is recovered by using the shortened readout with matched spatial resolution (31 Hz apodization vs. 10 Hz for reference). This is consistent with inhomogeneities in the proton B0 map (rescaled to the 13C frequency) as well as the position of the SSFP banding artifacts on the anatomical reference [6,7].
Figure 4 shows 13C MRS data obtained following imaging. Both scans were initiated at 1 minute 4 seconds after the start of injection. The lactate and bicarbonate peak SNRs were similar between high-resolution and reference schemes (lactate: 311 vs. 308, bicarbonate: 232 vs. 244). The metabolite to substrate ratios were also found to be similar from the MRS data obtained from these two experiments.
Conclusions
We show that circumferential myocardial bicarbonate images can be obtained using shortened readout durations, reduced flip angles, and increased signal averaging, in order to overcome B0 inhomogeneity in the posterior wall.Acknowledgements
The authors acknowledge funding support from NSERC and NVIDIA.References
- Ardenkjaer-Larsen JH et al. Increase in signal-to-noise ratio of > 10,000 times in liquid-state NMR. PNAS 2003 Sep 2;100(18):10158-63.
- Nelson SJ et al. Metabolic imaging of patients with prostate cancer using hyperpolarized [1-¹³C]pyruvate. Sci Transl Med. 2013 Aug 14;5(198):198ra108.
- Cunningham CH et al. Hyperpolarized 13C Metabolic MRI of the Human Heart: Initial Experience. Circ Res. 2016 Sep 15.
- Dominguez V et al. Intensity correction for multichannel hyperpolarized 13C imaging of the heart. Magn Reson Med. 2016 Feb;75(2):859-65. doi: 10.1002/mrm.26042. Epub 2015 Dec 1.
- Lau AZ et al. Rapid multislice imaging of hyperpolarized 13C pyruvate and bicarbonate in the heart. Magn Reson Med. 2010 Nov;64(5):1323-31.
- Reeder SB et al. In vivo measurement of T*2 and field inhomogeneity maps in the human heart at 1.5 T. Magn Reson Med. 1998 Jun;39(6):988-98.
- Atalay MK et al. Cardiac susceptibility artifacts arising from the heart‐lung interface. Magn Reson Med. 2001 Feb;45(2):341-5.
Figures