0255
Hyperpolarized C-13 bSSFP Imaging of the Human Brain1Athinoula A. Martinos Center for Biomedical Imaging, Department of Radiology, Massachusetts General Hospital and Harvard Medical School, Charlestown, MA, United States, 2Harvard Medical School, Boston, MA, United States, 3Department of Radiology and Biomedical Imaging, University of California San Francisco, San Francisco, CA, United States, 4GE Healthcare, Dallas, TX, United States
Synopsis
Current early phase clinical trials of hyperpolarized C-13 imaging of the brain, prostate, and liver have demonstrated the exceptional ability to rapidly visualize metabolism of pyruvate at high spatiotemporal resolutions. Prior human studies have used MRSI, EPSI, EPI, and spiral MRI and MRSI. In this study, we investigated for the first time the bSSFP sequence with its high SNR efficiency for human hyperpolarized C-13 imaging of pyruvate and lactate. This research showed the ability to acquire dynamic 1-1.5cm isotropic bSSFP images of the human brain in a clinical setting.
Introduction
Refocused C-13 acquisitions via balanced SSFP (bSSFP) has been shown to enable hyperpolarized (HP) C-13 imaging at spatial resolutions approaching 1mm isotropic,1 a significant boost over the demonstrated capability of more commonly utilized spoiled acquisitions (e.g. EPSI or EPI), owing to the long T2’s of 13C nuclei. Recent HP 13C human studies in brain, liver, and prostate,2-5 have shown the ability of imaging and quantifying the conversion of pyruvate to other metabolites in a rapid fashion. The objective of this study was to show the initial feasibility of HP 13C bSSFP imaging in human subjects for the first time. 1cm and 1.5cm isotropic imaging of both pyruvate and lactate was achieved in the human brain.Methods
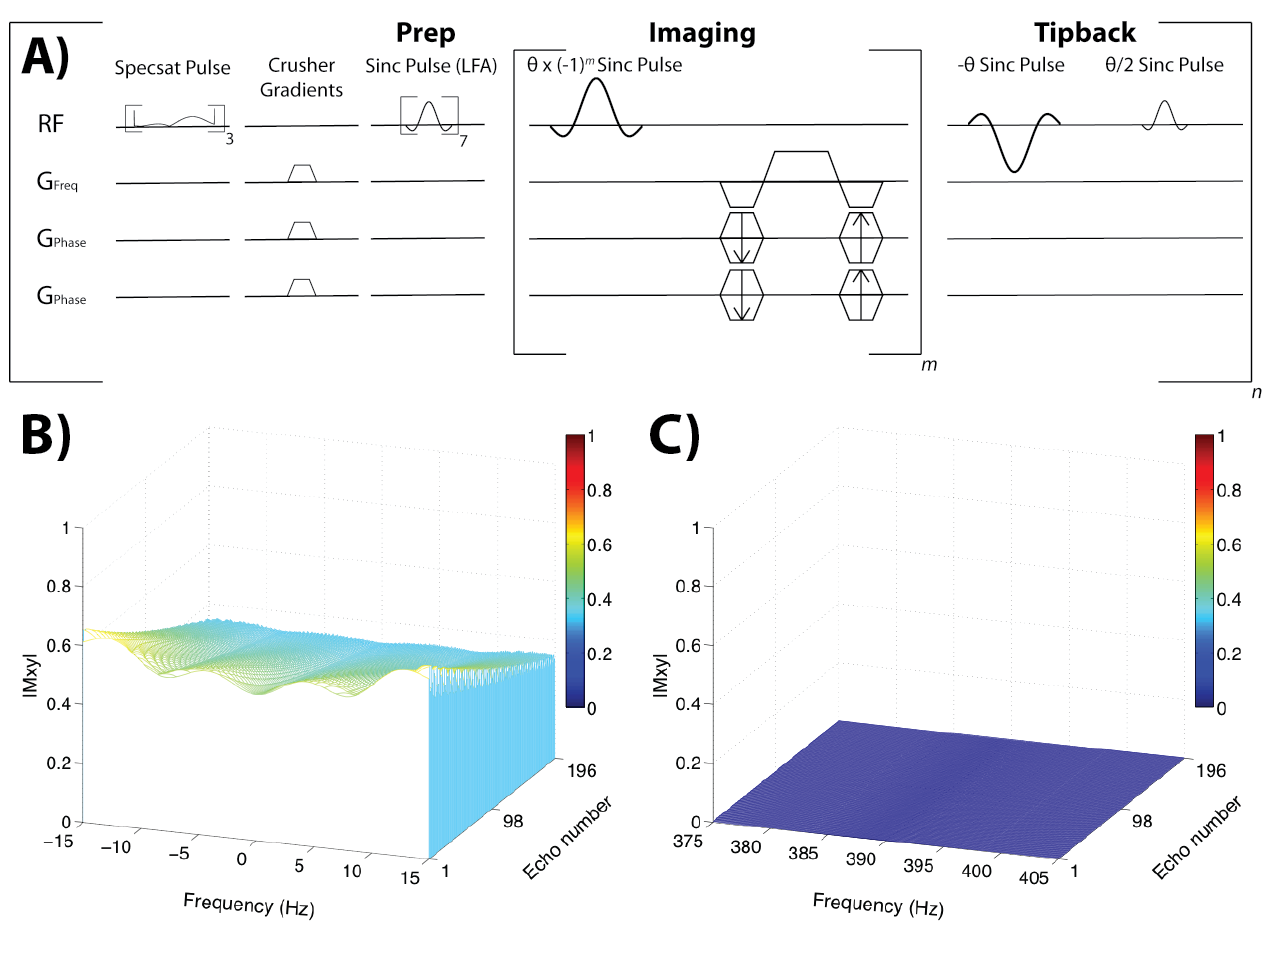
Two normal adult subjects were scanned using a 13C bSSFP sequence following antecubital venous injection of HP [1-13C]pyruvate, with spatial resolutions of 1.5cm and 1cm isotropic, respectively. The bSSFP sequence (Figure 1A) was configured as previously described6 for alternating selective excitation of [1-13C]pyruvate and [1-13C]lactate resonances, using a combination of spectrally selective excitation pulses (6.8ms sinc pulses with a time-bandwidth of 2) with carefully chosen TR/TE (15.3/7.65ms), and three 20ms spectral pre-saturation pulses applied to quench additional HP resonances (pyruvate-H2O and alanine). The calculated spectral profile for this sequence is shown in Figure 1B/C for a 40° flip angle on-resonance. The bSSFP flip angle was a constant α=40° for pyruvate and 60° for lactate for one subject and a variable increasing ramp for the second subject, with an initial catalyzation step of 7 pulses (linear ramp). The matrix size was 16x16x16 (1.5cm isotropic) and 24x18x24 (1cm isotropic) for the two subjects. The 1.5cm isotropic acquisition was acquired using 75% partial Fourier, while the 1cm isotropic acquisition was 3-fold undersampled and reconstructed using calibrationless parallel imaging.7 The total scan time per metabolite per volume was ~3s for the 1.5cm isotropic acquisition and ~2.2s for the 1cm isotropic acquisition, yielding total scan times of ~62s. HP data was acquired with a 13C birdcage coil for RF transmit and a 32-channel head coil with surface receiver elements conforming to the shape of the head for receive.8 A 1H axial spoiled gradient echo and B0 map were acquired for each subject. HP pyruvate media was generated using a GE SpinLab polarizer operating at 0.8K and 5T, with an integrated QC system. All 13C scanning was started at 5s after the end of injection with a 0.42mL/kg dosage and injection rate of 5mL/s. All human studies were approved by the Institutional Review Board (IRB) at UCSF.Results and Discussion
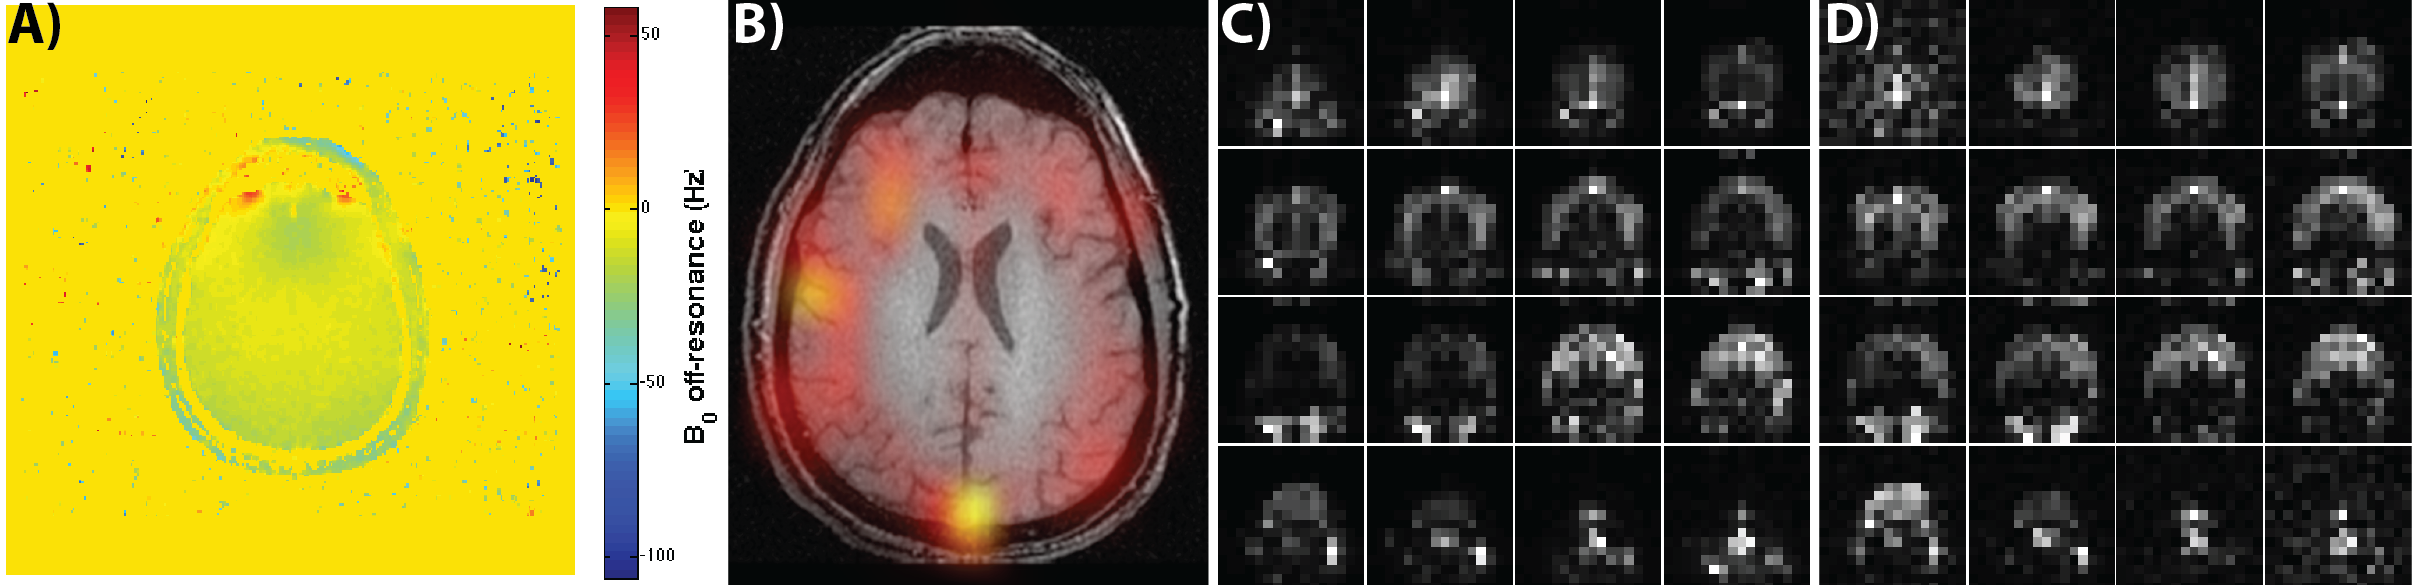
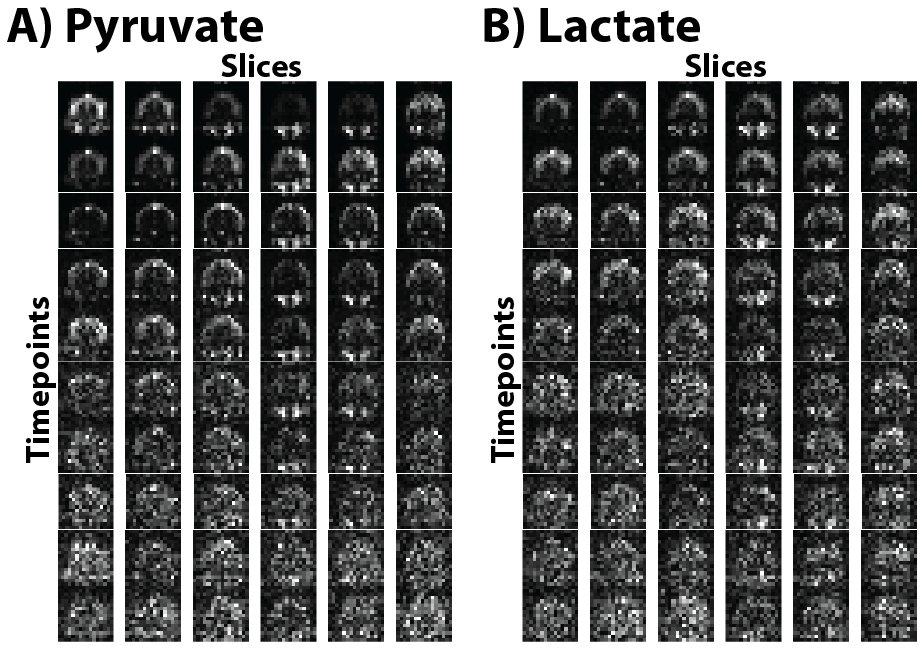
All multi-channel 13C data was combined using the Roemer method as described previously9 by using the pyruvate area under the curve (AUC) images for sensitivity maps. Figure 2 shows the results from the 1.5cm isotropic acquisition. Figure 2A shows the resulting 13C B0 map (GE IDEAL-IQ sequence) of an axial slice with a measured off-resonance of -9.7 ± 7.0 Hz, indicating minimal B0 inhomogeneity and 13C signal evolutions that should closely match the ideal calculated responses shown in Figure 1B and 1C. Figure 2B shows an overlay of pyruvate (AUC) on the same representative slice as in part A, with Figures 2C and 2D showing all the slices of the pyruvate and lactate AUC, respectively. Figures 3A and 3B show all the timepoints for the 6 center slices of pyruvate and lactate, respectively. Pyruvate signal was detected first, initially well-localized to the cerebral arteries, followed by enhancement of brain parenchyma and the venous system, and emergence of product lactate signal. The max SNR of the pyruvate was 2443 and max SNR of the lactate was 160, with enough SNR to visualize both metabolites in all timepoints.
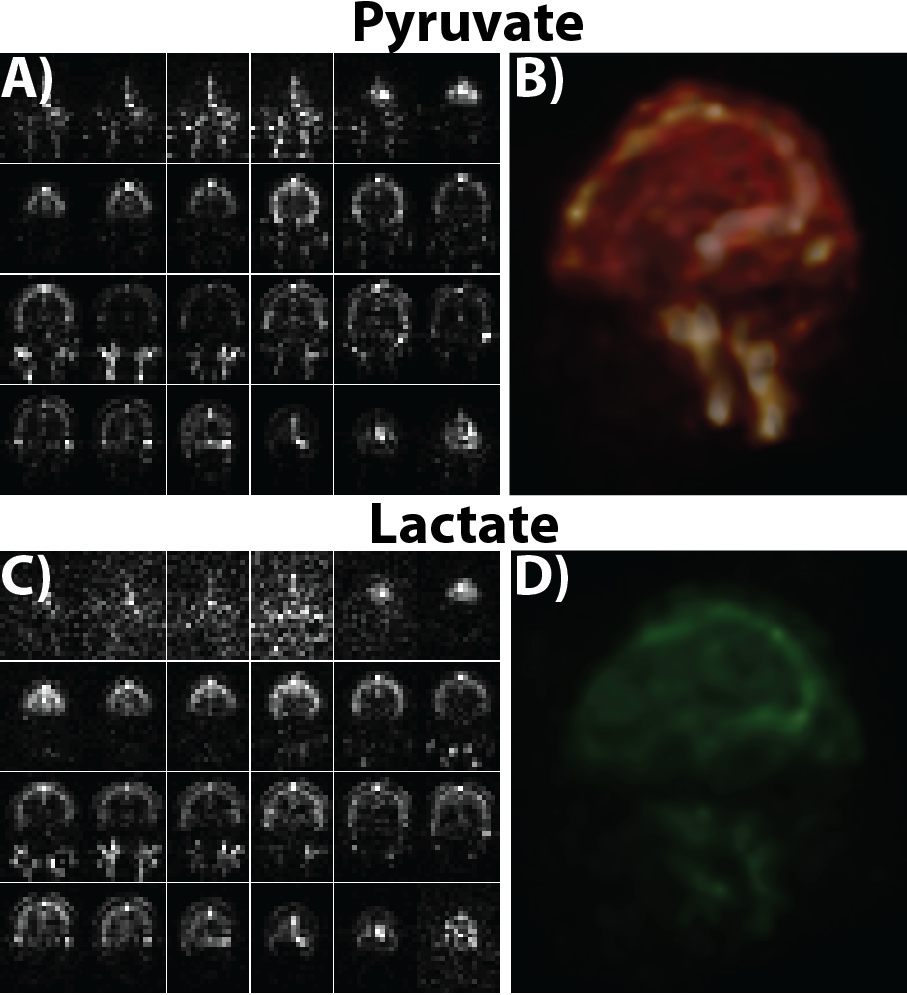
The 1cm isotropic acquisition results are depicted in Figure 4, with the pyruvate AUC and 3D rendering in shown in parts A and B, and lactate AUC and 3D rendering in parts C and D. Even with the more than 3-fold improvement in spatial resolution, the SNR was high enough to visualize both metabolites, indicating the capability of the sequence to achieve high spatiotemporal resolutions in clinical 13C acquisitions.
Conclusion
These initial results in humans indicate great potential for the application of bSSFP sequence methods for high spatiotemporal resolution HP 13C imaging. Future studies will focus on improving the acquisition (imaging bicarbonate and implementing shorter, more selective RF pulses10) and reconstruction (utilizing a local low rank plus sparse reconstruction with a multi-channel setup11,12) to achieve sub-centimeter resolution.Acknowledgements
This work was supported by funding from the NIH (R01EB017449, P41EB013598) and the NICO project.References
1. Reed GD, Von Morze C, Bok R, Koelsch BL, Criekinge M Van, Smith KJ, Shang H, Larson PEZ, Kurhanewicz J, Vigneron DB. High Resolution 13C MRI With Hyperpolarized Urea: In Vivo T2 Mapping and 15N Labeling Effects. IEEE Trans Med Imaging 2014;33:362–371.
2. Chen H, Larson PEZ, Gordon JW, et al. Phase II Clinical Hyperpolarized 13C 3D-Dynamic Metabolic Imaging of Prostate Cancer using a B1-insensitive Variable Flip Angle Design. In: Proc. Intl. Soc. Mag. Reson. Med. 25 (2017) 0725.
3. Gordon JW, Chen H-Y, Autry A, et al. Translation of Carbon‐13 EPI for hyperpolarized MR molecular imaging of prostate and brain cancer patients. Magn Reson Med 2018:1–8.
4. Zhu Z, Gordon JW, Chen H, et al. Human Hyperpolarized 13C MR of Liver and Bone Metastases using both EPSI and EPI Acquisitions. In: Proc. Intl. Soc. Mag. Reson. Med. 26 (2018) 0126.
5. Zhu Z, Marco-rius I, Ohliger MA, et al. Hyperpolarized 13C Dynamic Breath-held Molecular Imaging to Detect Targeted Therapy Response in Patients with Liver Metastases. In: Proc. Intl. Soc. Mag. Reson. Med. 25 (2017) 1115.
6. Milshteyn E, Larson PEZ, Morze C Von, Gordon JW, Zhu Z, Vigneron DB. High spatiotemporal resolution bSSFP imaging of hyperpolarized [1-13C] pyruvate and [1-13C] lactate with spectral suppression of alanine and pyruvate-hydrate. Magn Reson Med 2018:1–13.
7. Shin PJ, Larson PEZ, Ohliger MA, Elad M, Pauly JM, Vigneron DB, Lustig M. Calibrationless parallel imaging reconstruction based on structured low-rank matrix completion. Magn Reson Med 2013;970:959–970.
8. Mareyam A, Carvajal L, Xu D, Gordon J, Park I, Vigneron DB, Nelson SJ, Jason P. 31-Channel brain array for hyperpolarized 13C imaging at 3T. In: Proc. Intl. Soc. Mag. Reson. Med. 25 (2017) 1225.
9. Zhu Z, Zhu X, Ohliger M, et al. Coil Combination Methods for 16-channel Hyperpolarized 13C Spectroscopic Imaging Studies of Liver Metastases Patients. In: Proc. Intl. Soc. Mag. Reson. Med. 26 (2018) 3881.
10. Shang H, Sukumar S, Morze C Von, et al. Spectrally Selective Three-Dimensional Dynamic Balanced Steady-State Free Precession for Hyperpolarized C-13 Metabolic Imaging With Spectrally Selective Radiofrequency Pulses. Magn Reson Med 2016.
11. Milshteyn E, Morze C Von, Reed GD, Shang H, Shin PJ, Larson PEZ, Vigneron DB. Using a local low rank plus sparse reconstruction to accelerate dynamic hyperpolarized 13C imaging using the bSSFP sequence. J Magn Reson 2018;290:46–59.
12. Otazo R, Candès E, Sodickson DK. Low-rank plus sparse matrix decomposition for accelerated dynamic MRI with separation of background and dynamic components. Magn Reson Med 2015;73:1125–1136.
Figures