0254
Initial experience of applying bolus tracking and real-time B0/B1 calibration for human hyperpolarized 13C imaging1University of California at San Francisco, San Francisco, CA, United States, 2University of California at Berkeley, berkeley, CA, United States
Synopsis
A new hyperpolarized 13C MRI approach with bolus tracking and real-time B0/B1 calibration was developed and tested in 4 human HP 13C MRI studies of brain, prostate, kidney and pancreas metabolism. The use of this framework demonstrated improved accuracy and robustness for human hyperpolarized 13C imaging.
Introduction
Hyperpolarized (HP) 13C MRI has been used to non-invasively study real-time metabolic processes in vivo1. Acquisition timing2 and B1 calibration3 are challenging for human studies due to physiological variability over subjects. To address these challenges, we have developed and tested a new framework4 to integrate automatic acquisition timing with real-time frequency and B1 calibration for human hyperpolarized 13C MRI. In this work, we investigated applying this method for brain, kidney, pancreas and prostate HP 13C MRI studies.Methods
All the studies were performed on a GE 3T scanner with an injection of [1-13C]pyruvate prepolarized in a 5T GE SPINlab polarizer. Prior to each experiment, center frequency and power were calibrated on the phantom. Four different HP MRI exams were performed to study brain, kidney, pancreas and prostate metabolism. The brain and kidney study were performed on healthy volunteers while the pancreas and prostate study were performed on patients bearing tumors.
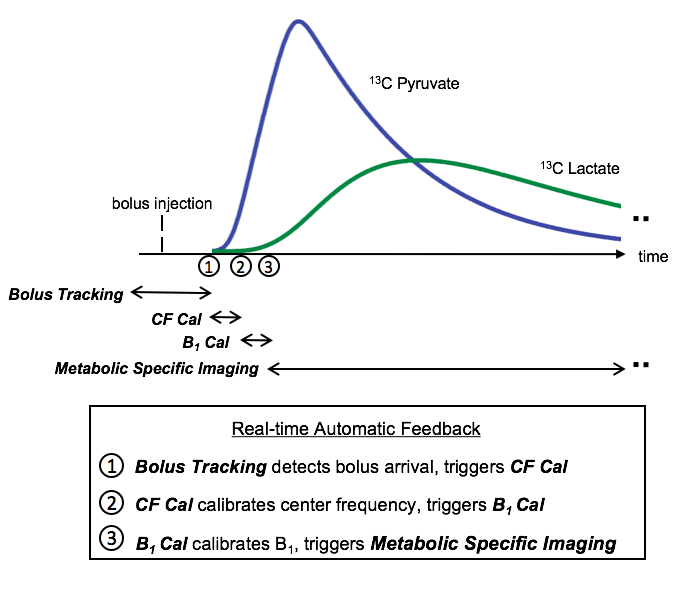
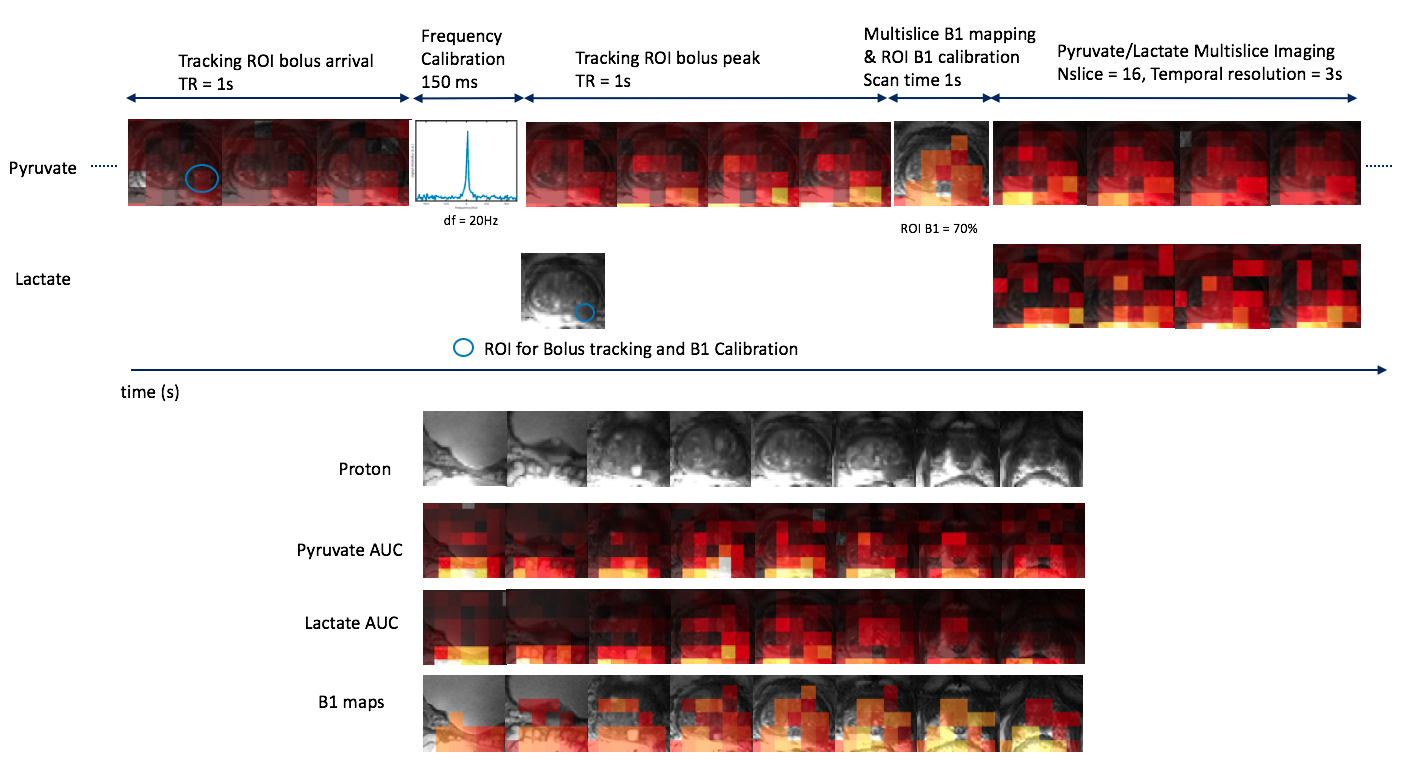
The acquisition scheme for all the studies is shown in Fig. 1. This scheme was implemented on the RTHawk system (HeartVista, CA). All acquisitions used spectral-spatial excitation and single-shot spiral readout. Unless specified, scan parameters for bolus tracking were 5° flip angle, 3cm slice thickness, 1.5cm in-plane resolution, TR 1s, tracking threshold 3x noise standard deviation. Scan parameters for frequency calibration were 3° flip angle, 3cm slice thickness, TR 150ms. Scan parameters for B1 mapping were 10° flip angle, 3cm slice thickness, 1.5cm in-plane resolution, TR 400ms. Scan parameters for metabolic specific imaging were 1.5cm in-plane resolution, 3s temporal resolution, 2cm slice thickness, 20° flip angle for pyruvate and 30° flip angle for lactate, bicarbonate and alanine.
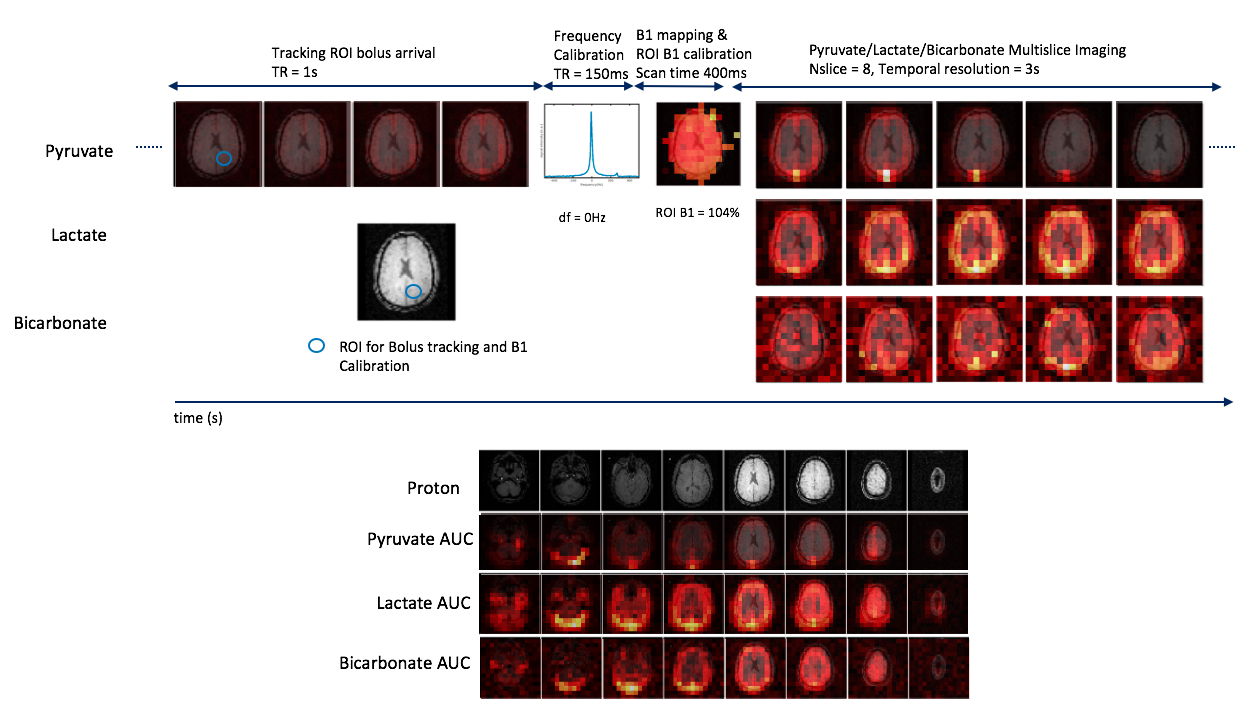
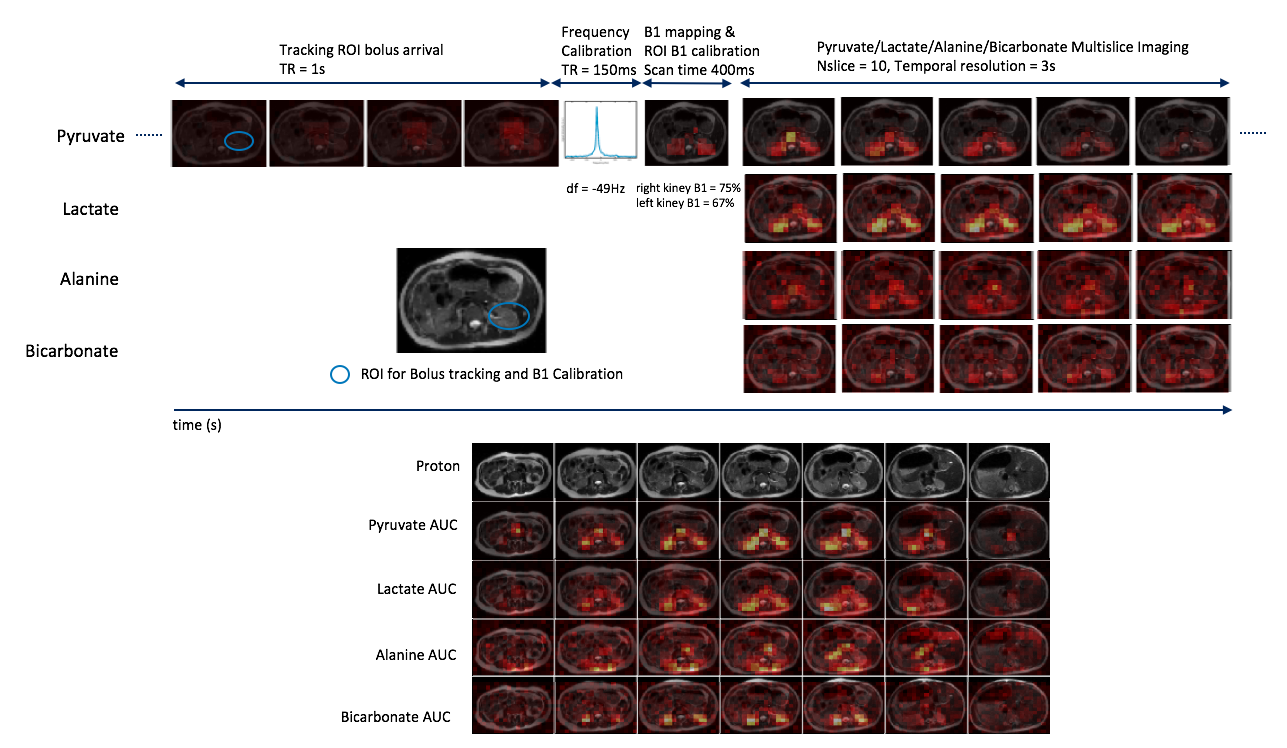
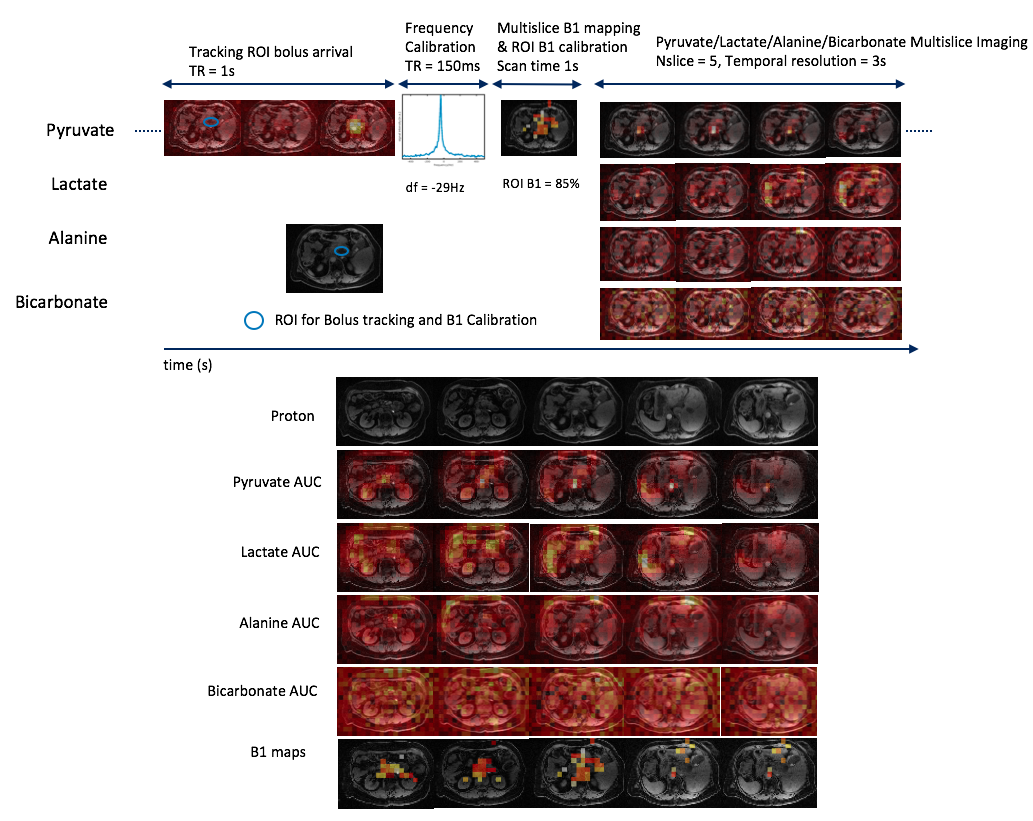
The brain study used a birdcage transmit coil and a 31 channel receive coil. Alanine signals were not acquired in this study. The kidney study used a clamshell transmit coil and a 16 channel receive coil. The pancreas study used the same clamshell transmit coil and an 8 channel “paddle” receive coil. In this study, 5 B1 maps were acquired within 1s with 2cm slice thickness. The prostate study used the clamshell transmit coil and an endocoil for receive. In this study, 8 B1 maps were acquired within 1s at bolus peak, all in-plane resolutions were 8mm, slice thickness was 8mm for metabolic specific imaging and was 16mm for other sequences. Bicarbonate and alanine signals were not acquired in the prostate study.
Results & Discussion
Data from the four HP 13C exams are presented in Fig.2 to Fig. 5. Bolus arrival and peak were successfully detected in these studies, indicating the selected tracking threshold fell above the noise level. Compared to the frequency calibrated on the phantom, the real-time calibrated frequency had a larger difference in the kidney (-49Hz, Fig. 3), pancreas (-29Hz, Fig. 4), and prostate (20Hz, Fig. 5) studies than in the brain study (0Hz, Fig. 2). This finding is as expected, since large field inhomogeneity was present in the abdominal studies. By comparing pyruvate images before and after frequency calibration in Fig. 3 and Fig. 4, it is observed that off-resonance blurring in images was significantly reduced by frequency calibration.
Compared to the B1 calibrated on the urea phantom, the real-time calibrated B1 within the body has larger difference in the kidney (25%, Fig. 3), pancreas (15%, Fig. 4), prostate (30%, Fig. 5) studies than in the brain study (4%, Fig. 2). This finding is as expected, since the transmit coil (birdcage) used in the brain study has a more uniform transmission profile than what was used in other studies (clamshell or surface coil). Non-uniform transmission profile brings more challenges in power calibration. Since B1 mapping is triggered according to ROI bolus signal, sufficient signal is guaranteed at the ROI location but not necessarily in other regions. For example, different coverages of the B1 maps were found between the kidney and pancreas study where the same transmit coil was used. If B1 map of a large FOV is required, B1 mapping could be triggered manually according to the signal build-up which is also allowed in our real-time framework.
Metabolic specific images were successfully acquired in all these studies with no apparent signal reduction, compared to our prior studies which didn’t use bolus tracking and real-time B0/B1 calibration. This indicated that the small flip angle used in the tracking and real-time calibration process caused minimal hyperpolarization loss.
Conclusion
A new HP 13C MRI approach with bolus tracking and real-time B0/B1 calibration was developed and tested in 4 human HP 13C MRI studies of brain, prostate, kidney and pancreas metabolism. The use of this framework demonstrated improved accuracy and robustness for human hyperpolarized 13C imaging.Acknowledgements
This work was supported by grants R01EB017449, R01EB016741, R01CA183071, and P41EB013598 from the National Institutes of Health.References
1. Golman K, in’t Zandt R, Thaning M. Real-time metabolic imaging. Proc Natl Acad Sci U S A 2006; 103:11270–5.
2. Nelson SJ, Kurhanewicz J, Vigneron DB, Larson PEZ, Harzstark AL, Ferrone M, van Criekinge M, Chang JW, Bok R, Park I, Reed G, Carvajal L, Small EJ, Munster P, Weinberg VK,
3. Lau AZ, Chen AP, Cunningham CH. Integrated Bloch-Siegert B1 mapping and multi- slice imaging of hyperpolarized 13C pyruvate and bicarbonate in the heart. Magn Reson Med 2012;67:62–71.
4. ArdenkjaerLarsen JH, Chen AP, Hurd RE, Odegardstuen LI, Robb FJ, Tropp J, Murray JA. Metabolic imaging of patients with prostate cancer using hyper- polarized [1-13C]pyruvate. Sci Transl Med 2013;5:198ra108.
5. Tang S, Milshteyn E, Reed GD, Gordon JW, Bok RA, Zhu X, Zhu Z, Vigneron DB, Larson PEZ. A regional bolus tracking and real-time b1 calibration method for hyper- polarized 13c mri. Magn Reson Med 2018; p. In Press.
Figures