0253
Imaging a hallmark of cancer: hyperpolarized [U-2H, U-13C]-glucose and hyperpolarized [1-13C]-dehydroascorbic acid can monitor TERT expression in gliomas1Radiology and Biomedical Imaging, University of California San Francisco, San Francisco, CA, United States, 2Neurological Surgery, University of California San Francisco, San Francisco, CA, United States
Synopsis
Expression of telomerase reverse transcriptase (TERT) is a fundamental hallmark of cancer. Identification of imaging biomarkers of TERT expression will facilitate non-invasive assessment of tumor burden and response to therapy. Our studies in glioma indicate that TERT expression leads to increased redox capacity characterized by elevated 1H-MRS-detectable glutathione and NADPH. Concomitantly, TERT increases 13C-MRS-detectable flux of glucose through the pentose phosphate pathway, which provides NADPH. Importantly, hyperpolarized [U-2H, U-13C]-glucose and hyperpolarized [1-13C]-dehydroascorbic acid can image these alterations in glucose and redox metabolism. Our study identifies potential non-invasive translational metabolic imaging probes of TERT expression in glioma and possibly other cancers.
Introduction
Telomeres are capped structures at chromosomal ends that shorten with every cell division and act as a barrier to uncontrolled proliferation. Cancer cells, therefore, need a mechanism to maintain telomere length and the majority of tumors, including low-grade gliomas, reactivate expression of telomerase reverse transcriptase (TERT), the enzyme that mediates telomere synthesis1. Since TERT expression is essential for glioma proliferation and TERT is an attractive therapeutic target, identification of imaging biomarkers of TERT expression will facilitate non-invasive monitoring of tumor burden and response to therapy. To that end, the goal of this study was to identify non-invasive hyperpolarized 13C-magnetic resonance spectroscopy (MRS)-detectable biomarkers of TERT expression in gliomas.Methods
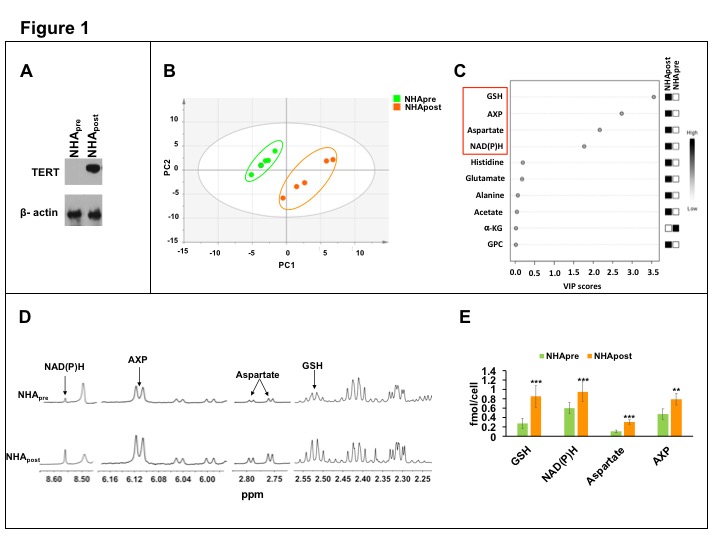
Glioma cell models: We examined isogenic immortalized normal human astrocytes without (NHApre) and with TERT expression (NHApost). TERT expression and activity in these models has previously been confirmed2.
1H-MRS: Metabolites were extracted from ~2 x 10⁷ cells by methanol-chloroform extraction and 1H-MRS spectra acquired on an 11.7T Bruker spectrometer (90°flip angle, 3s relaxation delay, 256 scans) as described3. Principal Component Analysis (PCA) was performed using SIMCA. Discriminating metabolites were identified based on the variable importance in projection (VIP) scores from Partial Least Squares Discriminant Analysis using Metaboanalyst4.
Thermally-polarized 13C-MRS: Cells were incubated with medium containing 5mM [2-13C]-glucose, metabolites extracted and proton-decoupled 13C-MRS spectra acquired on an 11.7T Bruker spectrometer (30°flip angle, 3s relaxation delay, 2048 acquisitions) as described5.
Hyperpolarized 13C-MRS: [U-2H, U-13C]-glucose or [1-13C]-dehydroascorbic acid were prepared as described6, 7, polarized (HyperSense), dissolved in isotonic buffer and injected into live cells (~108) in a 10mm NMR tube to a final concentration of 10mM. 13C-MRS spectra were acquired every 3s for 300s on a Bruker 14.1T spectrometer5 and ratios of area under the curve (AUC) for product to substrate quantified.
TERT silencing: Smartpool siRNA against TERT or control siRNA were transfected into NHApost cells as described8.
Statistical analysis: Results are expressed as mean±SD and statistical significance assessed using an unpaired Student’s t-test (* = p<0.05, *** = p<0.005).
Results and Discussion
In order to identify MR-detectable metabolic alterations linked to TERT expression, we investigated glioma models without (NHApre) and with TERT expression2 (NHApost, Fig.1A). Unbiased PCA was able to distinguish NHApre cells from NHApost (Fig.1B). Elevated levels of glutathione (GSH, reduced), NAD(P)H, aspartate and AXP (AMP, ADP and ATP) in NHApost cells relative to NHApre were responsible for this discrimination (Fig.1C). These differences were further confirmed by univariate quantification of 1H-MRS spectra (Fig.1D-1E).
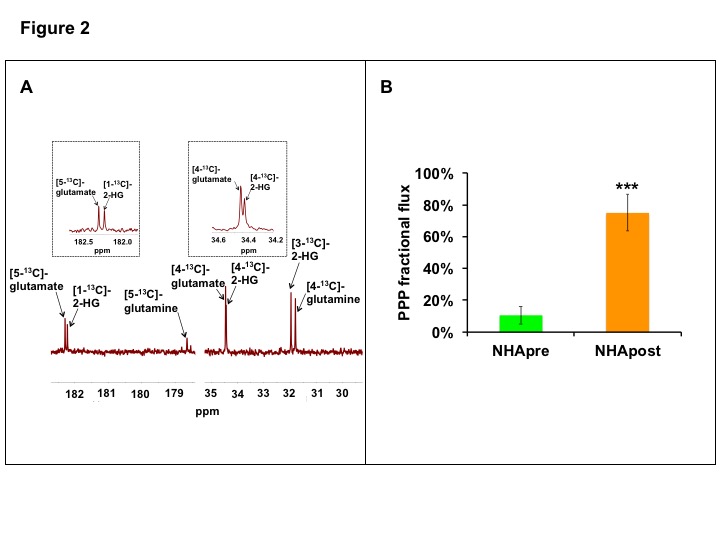
Next, we examined alterations in metabolic fluxes associated with TERT expression. Since glucose flux through the pentose phosphate pathway (PPP) is essential for synthesis of NADPH, which, in turn, maintains GSH in the reduced state, we probed [2-13C]-glucose metabolism. PPP fractional flux calculated from the relative proportions of [4-13C]-glutamate and [5-13C]-glutamate generated from [2-13C]-glucose (Fig.2A)9 demonstrated that, consistent with elevated NADPH and GSH, PPP fractional flux was higher in NHApost cells relative to NHApre (Fig.2B).
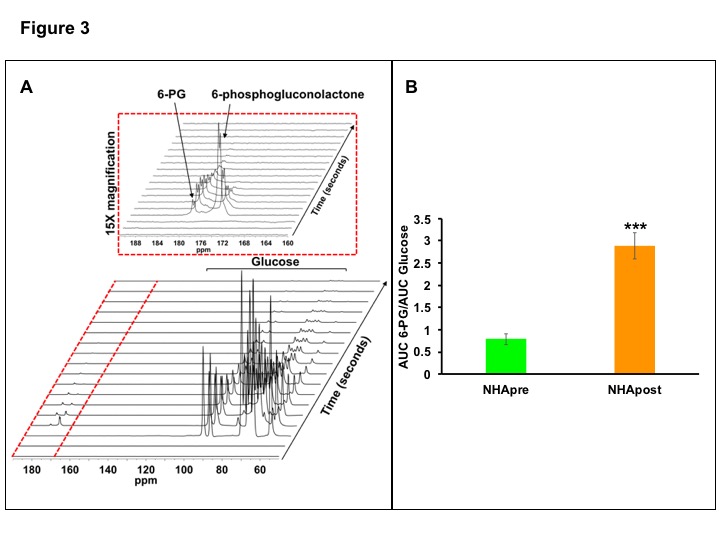
Based on these results, we investigated metabolism of hyperpolarized [U-2H, U-13C]-glucose. A representative spectral array showing metabolism of hyperpolarized glucose through the PPP to produce 6-phosphogluconolactone and 6-phosphogluconate (6-PG) in NHApost cells is shown in Fig.3A. We focused on 6-PG since it has previously been observed in vivo7, and found that 6-PG production was higher in NHApost cells (Fig.3B), suggesting that hyperpolarized [U-2H, U-13C]-glucose can non-invasively monitor TERT expression in gliomas.
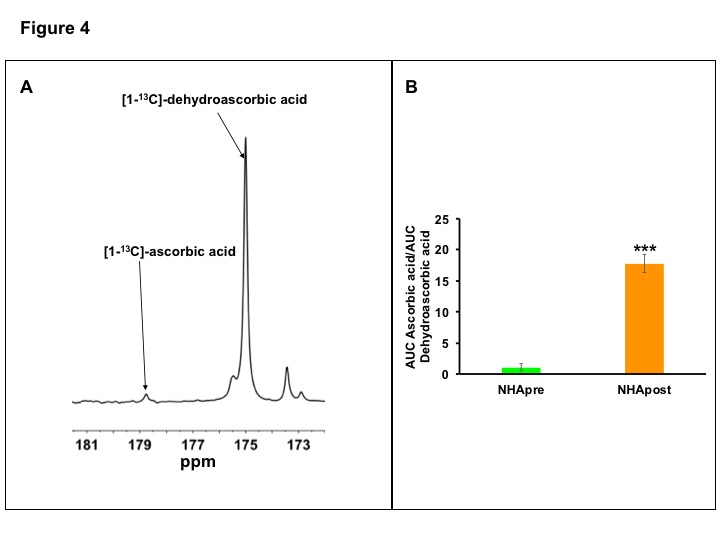
Since GSH and NADPH levels were higher in NHApost cells (Fig.1C-1E), we also examined metabolism of hyperpolarized [1-13C]-dehydroascorbic acid to ascorbic acid, which was previously shown to provide a readout of GSH and NADPH levels6, 10, 11. Hyperpolarized [1-13C]-ascorbic acid production was higher in NHApost cells relative to NHApre (Fig.4A-4B), suggesting that hyperpolarized [1-13C]-dehydroascorbic acid can probe TERT expression in gliomas.
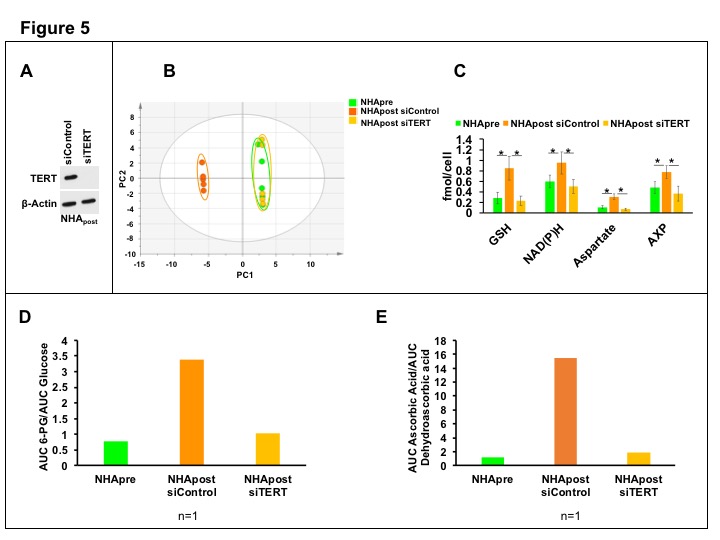
In order to link our metabolic imaging biomarkers to TERT expression, we examined NHApost cells in which TERT expression was silenced by RNA interference (Fig.5A) and compared their metabolism to cells transfected with control siRNA and to NHApre cells. As shown in Fig.5B-5C, TERT silencing normalized the 1H-MRS profile of NHApost cells resulting in a profile that was indistinguishable from that of NHApre cells. Importantly, hyperpolarized [U-2H, U-13C]-glucose flux to 6-PG (Fig. 5D) and hyperpolarized [1-13C]-dehydroascorbic acid reduction to [1-13C]-ascorbic acid (Fig.5E) in NHApost siTERT cells returned to levels observed in NHApre cells, linking our metabolic imaging biomarkers to TERT expression.
Conclusions
In this study, we have identified hyperpolarized [U-2H, U-13C]-glucose and hyperpolarized [1-13C]-dehydroascorbic acid as metabolic imaging probes for TERT expression in gliomas. Further studies in orthotopic glioma xenografts are currently ongoing to determine their utility for imaging TERT expression in vivo.Acknowledgements
This work was supported by the following grants: NIH R01CA172845, NIH R01CA197254, UCSF Brain Tumor Loglio Collective, NICO, NIH P41EB013598 and NIH P50CA97257.References
1. Hanahan D, Weinberg RA. Hallmarks of cancer: the next generation. Cell144, 646-674 (2011). doi: 10.1016/j.cell.2011.02.013.
2. Ohba S, et al.Mutant IDH1 Expression Drives TERT Promoter Reactivation as Part of the Cellular Transformation Process. Cancer research76, 6680-6689 (2016). doi: 10.1158/0008-5472.can-16-0696. PMC5290072.
3. Viswanath P, et al.2-hydroxyglutarate-mediated autophagy of the endoplasmic reticulum leads to an unusual downregulation of phospholipid biosynthesis in mutant IDH1 gliomas. Cancer research, (2018). doi: 10.1158/0008-5472.can-17-2926.
4. Xia J, Sinelnikov IV, Han B, Wishart DS. MetaboAnalyst 3.0--making metabolomics more meaningful. Nucleic acids research43, W251-257 (2015). doi: 10.1093/nar/gkv380. PMC4489235.
5. Izquierdo-Garcia JL, et al.IDH1 mutation induces reprogramming of pyruvate metabolism. Cancer research, (2015). doi: 10.1158/0008-5472.can-15-0840.
6. Qin H, et al.Imaging glutathione depletion in the rat brain using ascorbate-derived hyperpolarized MR and PET probes. Sci Rep8, 7928 (2018). doi: 10.1038/s41598-018-26296-6.
7. Rodrigues TB, Serrao EM, Kennedy BW, Hu DE, Kettunen MI, Brindle KM. Magnetic resonance imaging of tumor glycolysis using hyperpolarized 13C-labeled glucose. Nat Med20, 93-97 (2014). doi.
8. Viswanath P, et al.Mutant IDH1 gliomas downregulate phosphocholine and phosphoethanolamine synthesis in a 2-hydroxyglutarate-dependent manner. Cancer & metabolism6, 3 (2018). doi: 10.1186/s40170-018-0178-3. PMC5881177.
9. Brekke EM, Walls AB, Schousboe A, Waagepetersen HS, Sonnewald U. Quantitative importance of the pentose phosphate pathway determined by incorporation of 13C from [2-13C]- and [3-13C]glucose into TCA cycle intermediates and neurotransmitter amino acids in functionally intact neurons. Journal of cerebral blood flow and metabolism : official journal of the International Society of Cerebral Blood Flow and Metabolism32, 1788-1799 (2012). doi: 10.1038/jcbfm.2012.85. PMC3434630.
10. Bohndiek SE, et al.Hyperpolarized [1-13C]-ascorbic and dehydroascorbic acid: vitamin C as a probe for imaging redox status in vivo. Journal of the American Chemical Society133, 11795-11801 (2011). doi: 10.1021/ja2045925. PMC3144679.
11. Keshari KR, Kurhanewicz J, Bok R, Larson PE, Vigneron DB, Wilson DM. Hyperpolarized 13C dehydroascorbate as an endogenous redox sensor for in vivo metabolic imaging. Proceedings of the National Academy of Sciences of the United States of America108, 18606-18611 (2011). doi: 10.1073/pnas.1106920108. PMC3219134.
Figures