0248
Reduced Regional Cerebral Venous Oxygen Saturation is a Risk Factor for Cognitive Impairment in Hemodialysis Patients: A Susceptibility-weighted Image Mapping Study1Department of Radiology, Tianjin First Central Hospital, Tianjin, China, 2Deparment of Hemodialysis, Tianjin First Central Hospital, Tianjin, China, 3MR Collaboration, Siemens Healthcare Ltd., Beijing, China, 4Department of Radiology, Wayne State University, Detroit, MI, United States
Synopsis
The purpose of this study was to noninvasively evaluate the changes of regional cerebral venous oxygen saturation (rSvO2) in hemodialysis patients using quantitative susceptibility-weighted image mapping (SWIM) and then to investigate the relationship between rSvO2, clinical risk factors, and neuropsychological testing results. The results suggest that cerebral rSvO2 is reduced in hemodialysis patients and that this reduction may correlate with neurocognitive dysfunction. Hematocrit, iron, glucose, and pre- and post-dialysis DBP were independent risk factors for reduced cerebral rSvO2.
Introduction
Cerebral venous oxygen saturation (SvO2) is closely correlated with the brain’s oxygen metabolism and to some extent neural activity. Abnormal cerebral oxygen metabolism has been seen in numerous neuropathologies1. Being able to accurately measure SvO2 would offer more insight into patients’ neurophysiologocal status and more broadly into how different neurological pathologies disrupt cerebral metabolism. Investigation of cerebral oxygen metabolism in hemodialysis patients can help better understand brain dysfunction, which is a common complication. Recently, susceptibility-weighted image mapping (SWIM) has been shown to be a promising method to map the SvO2 in the cerebral venous tree2. The purpose of this study was to use SWIM to explore changes in cerebral SvO2 at the regional level based on the susceptibility of major veins and to investigate the correlation of rSvO2 with clinical factors and neurocognitive scores in hemodialysis patients.Methods
54 patients and 54 age-, gender-, and education-matched healthy controls (HCs) participated in this study. All subjects were right-handed, did not have any other health conditions, and had no MR contraindications. Montreal Cognitive Assessments (MoCA) and Mini Mental State Examinations (MMSE) were administered to evaluate neurocognitive function. MRI scans were performed on a MAGNETOM Trio a Tim System 3T MR scanner (Siemens Healthcare, Erlangen, Germany) and included routine head scans and SWI. The parameters of SWI were as follows: TR/TE = 27/20 ms; voxel resolution = 0.5×0.5×2 mm3; flip angle = 15°; bandwidth = 120 Hz/pixel; field of view = 230×200 mm2; slices = 56; and acquisition time = 179 s. Only images of adequate quality to observe the veins clearly were used. SWIM was reconstructed from both phase and magnitude data using SMART (Susceptibility Mapping and Phase Artifacts Removal Toolbox, Detroit, Michigan, USA) software. The susceptibility of bilateral major veins (i.e. cortical, septal, thalamostriate, cerebral internal and basal veins) was measured using SPIN (signal processing in nuclear magnetic resonance, Detroit, Michigan, USA) software (Fig. 1). A threshold of 90 parts per billion (ppb) was used to eliminate the susceptibility of background tissues3. The SWIM data provided a method to assess rSvO2 by using the difference in susceptibility (Δχ) between tissues. The relationship between Δχ and SvO2 is given by: Δχvein-tissue=Δχdo×Hct×(1 – SvO2). Δχdo=4π×0.27×103 ppb. The laboratory data of patients was collected.
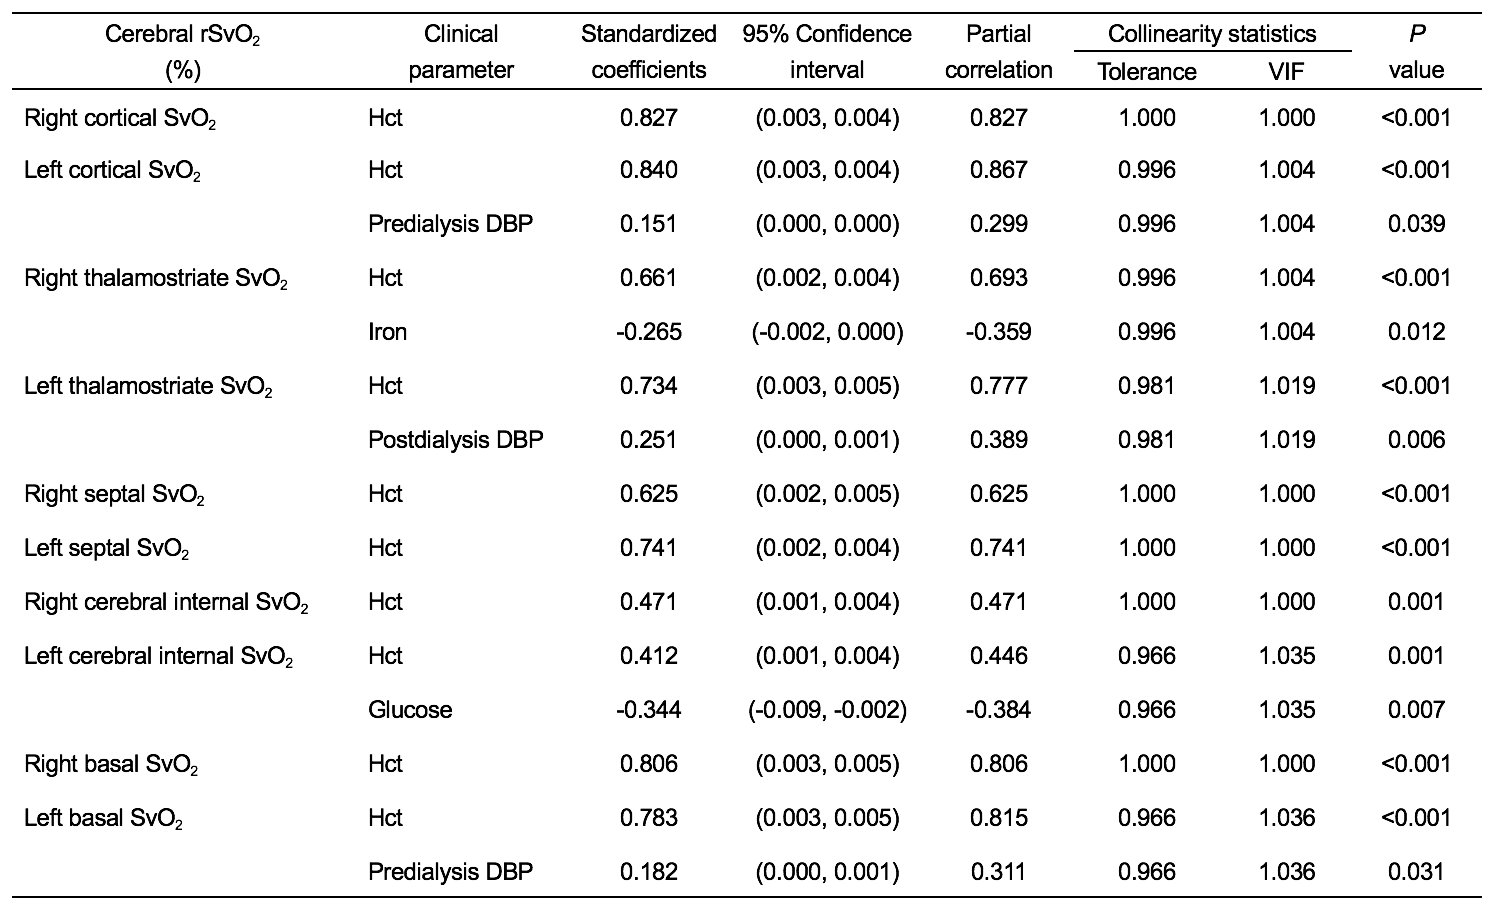
An analysis of covariance adjusting for age and gender was performed to explore the difference in cerebral rSvO2 between hemodialysis patients and HCs. Stepwise multiple regression analysis were performed to identify independent predictors (listed in Table. 3) for rSvO2 in patients. Correlation analysis were used to explore the relationship between cerebral rSvO2 in different veins and MoCA, MMSE scores in patients. A Bonferroni_corrected P<0.05 for analysis of covariance and a false discovery rate (FDR) corrected P<0.05 for correlation analysis were both considered as significant.
Results
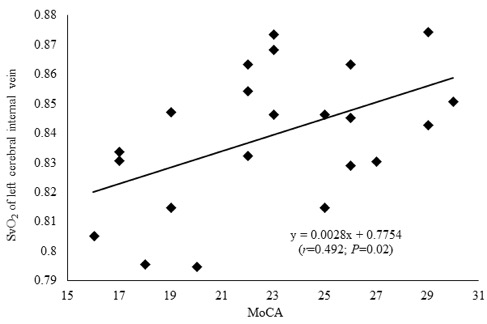
The epidemiological and demographic information of hemodialysis patients and HCs are shown in Table. 1. The SvO2 of bilateral cerebral major veins in hemodialysis patients were significantly lower than those in HCs (all P<0.001, Bonferroni corrected) (Table. 2). Hematocrit, iron, glucose, and pre-and post-dialysis diastolic blood pressure (DBP) were independent predictive factors for rSvO2 (all P<0.05) (Table. 3). The SvO2 of the left cerebral internal vein significantly correlated with MoCA scores (r=0.492; P=0.02, FDR corrected) (Fig. 2). No correlations between the rSvO2 of other veins and MoCA or MMSE scores were found (all P>0.05).Discussion
Hemodialysis paitents often have anemia secondary to renal dysfunction. It is possible that to maintain normal oxygen metabolism in the setting of anemia both cerebral blood flow and oxygen extraction fraction are increased, resulting in the lower rSvO2 of hemodialysis patients seen in this study4. Positive correlation between Hct and cerebral rSvO2 supported this hypothesis. To sustain normal cerebral function, increased glucose in the cerebral tissues requires more oxygen to generate adenosine triphosphate, which caused a reduced rSvO25. Cerebral iron deposition is generally increased in hemodialysis patients, which may be a oxygen-consuming procedure, further causing reduced rSvO2. MMSE and MoCA scores of patients were lower than those of HCs and MoCA scores positively correlated with left cerebral internal SvO2, suggesting that hemodialysis patients had neurocognitive impairment6 and reduced left cerebral internal SvO2 was a risk factor. Cerebral rSvO2 only correlated with MoCA scores, not with MMSE scores. The reason may be that MoCA is a more sensive neurocognitive screening tool for hemodialysis patients than MMSE7.Conclusion
Cerebral rSvO2 was reduced in hemodialysis patients, which was associated with neurocognitive impairment. Hematocrit, iron, glucose, and pre-and post-dialysis DBP were independent risk factors for changes in the cerebral rSvO2.Acknowledgements
This work was supported by the Natural Scientific Foundation of China (grant number 81501457 to Shuang Xia; grant number 8167070944, 81873888 to Wen Shen), the Tianjin Science and Technology Project (grant number 16ZXMJSY00210 to Shuang Xia) and Natural Science Foundation of Tianjin (grant number 16JCYBJC27300 to Wen Shen).References
1. Xia, S., Utriainen, D., Tang, J., Kou, Z., Zheng, G., Wang, X., et al. (2014). Decreased oxygen saturation in asymmetrically prominent cortical veins in patients with cerebral ischemic stroke. Magn Reson Imaging, 32(10), 1272-1276.
2. Tang, J., Liu, S., Neelavalli, J., Cheng, Y.C., Buch, S., & Haacke, E.M. (2013). Improving susceptibility mapping using a threshold-based K-space/image domain iterative reconstruction approach. Magn Reson Med, 69(5), 1396-1407.
3. Chai, C., Liu, S., Fan, L., Liu, L., Li, J., Zuo, C., et al. (2018). Reduced deep regional cerebral venous oxygen saturation in hemodialysis patients using quantitative susceptibility mapping. Metab Brain Dis, 33(1), 313-323.
4. Zheng, G., Wen, J., Lu, H., Lou, Y., Pan, Z., Liu, W., et al. (2016). Elevated global cerebral blood flow, oxygen extraction fraction and unchanged metabolic rate of oxygen in young adults with end-stage renal disease: an MRI study. Eur Radiol, 26(6), 1732-1741.
5. Blazey, T., Snyder, A.Z., Su, Y., Goyal, M.S., Lee, J.J., Vlassenko, A.G., et al. (2018). Quantitative positron emission tomography reveals regional differences in aerobic glycolysis within the human brain. J Cereb Blood Flow Metab, 271678X18767005.
6. Dasgupta, I., Patel, M., Mohammed, N., Baharani, J., Subramanian, T., Thomas, G.N., et al. (2018). Cognitive Function Declines Significantly during Haemodialysis in a Majority of Patients: A Call for Further Research. Blood Purif, 45(4),347-355.
7. Tiffin-Richards, F.E., Costa, A.S., Holschbach, B., Frank, R.D., Vassiliadou, A., Krüger, T., et al. (2014) The Montreal Cognitive Assessment (MoCA) - a sensitive screening instrument for detecting cognitive impairment in chronic hemodialysis patients. PLoS One, 9(10), e106700.
Figures
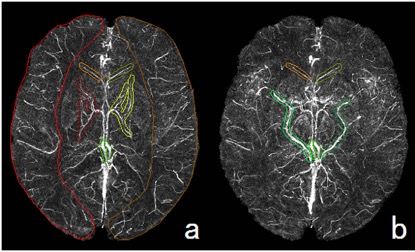
Fig. 1. Measurement of susceptibility of major cerebral veins using quantitative susceptibility-weighted image mapping.
Figures 1a, b show the volumes of interest (VOIs) for the measurement of susceptibility of the major cerebral veins. Figure 1a shows the bilateral cortical (lateral), bilateral septal (front, medial), bilateral thalamostriate (middle, medial), and bilateral cerebral internal veins (rear, medial). Figure 1b shows the bilateral septal (front), bilateral basal (rear, lateral), and bilateral cerebral internal veins (rear, medial).
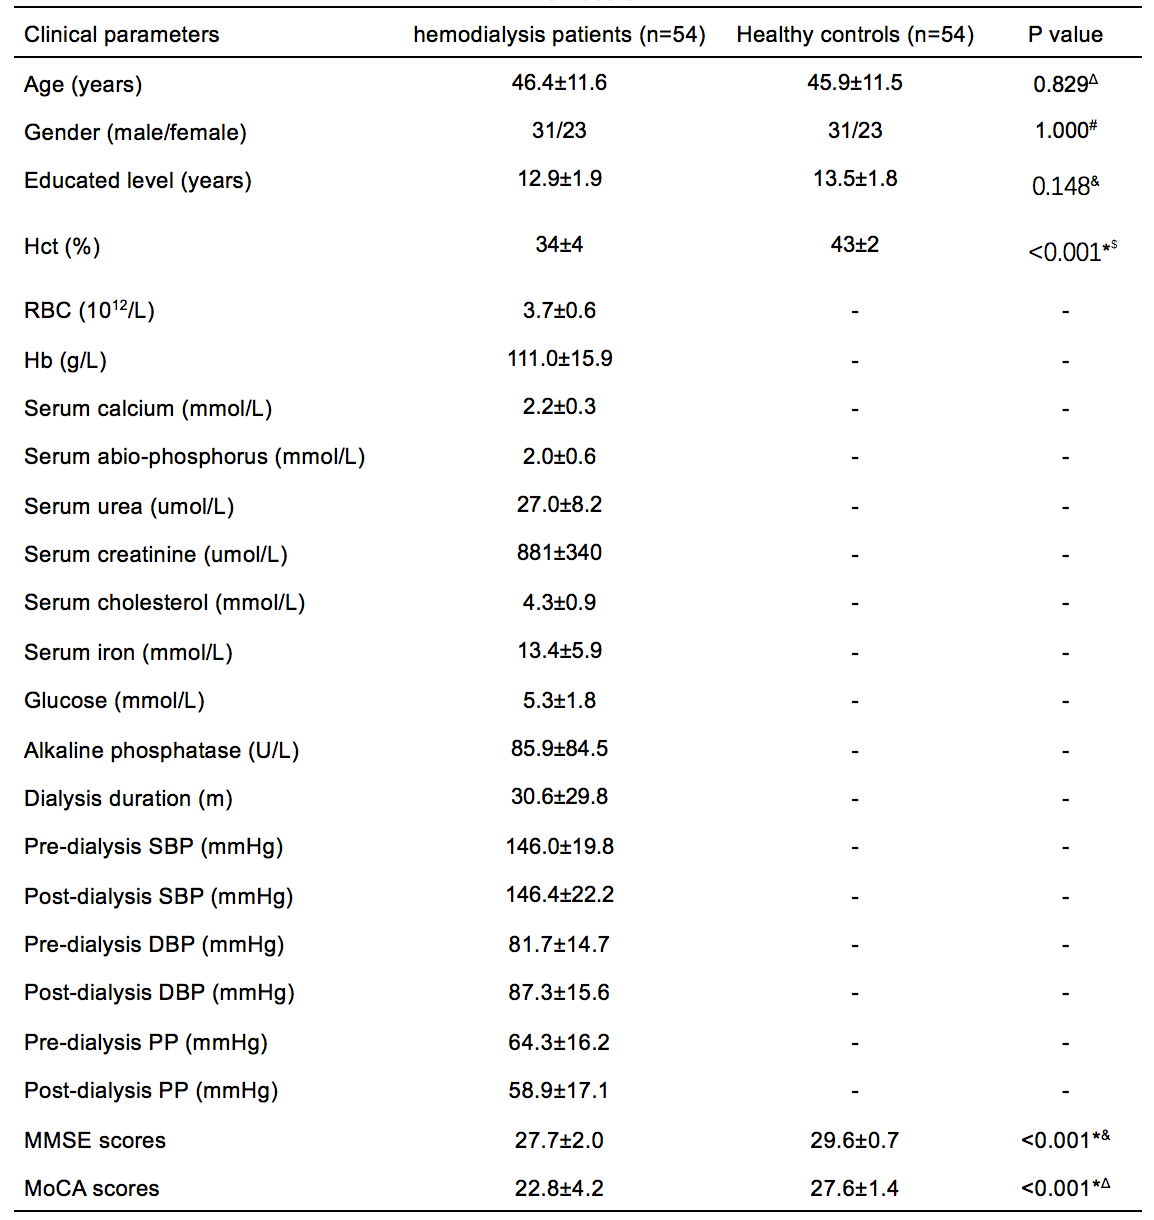
Table. 1. The epidemiological and demographic data of the hemodialysis patients and healthy controls.
*P<0.05, Hct= hematocrit, RBC= red blood cell, Hb= hemoglobin, SBP= systolic blood pressure, DBP= diastolic blood pressure, PP= pulse pressure. Values are mean ± SD or number of patients; Δindependent-sample t-test; #Chi-Square test; -unavailable data; &Mann-Whitney U test.
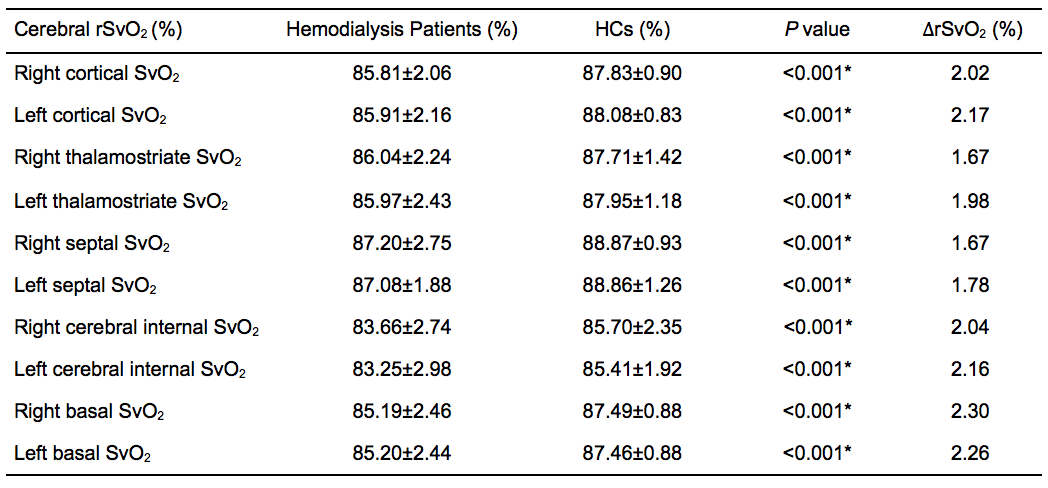
Table. 2. Comparison of cerebral rSvO2 between hemodialysis patients and healthy controls.
*P<0.05; rSvO2 = regional venous oxygen saturation; HCs = healthy controls; ΔrSvO2 = rSvO2 in HCs- rSvO2 in patients. The high pass filtering in our study and partial volume effects can lead to a dramatic overestimation of SvO2 in narrow veins from SWIM (Haacke et al. 2015). However, neither of these effects will affect the estimates of ΔrSvO2 between patients and HCs, since we used the same method and parameters for processing all data.