0246
Planar rosette spectroscopic imaging at 7T1University of Pittsburgh, Pittsburgh, PA, United States, 2UPMC, Pittsburgh, PA, United States
Synopsis
To make spectroscopic imaging clinically feasible, rapid and robust acquisitions with high SNR are necessary. We develop and apply rosette spectroscopic imaging at 7T using a 8x2 transceiver array and high degree B0 shimming to acquire rapid (<3min) whole plane brain studies at 0.7cc to 0.3cc resolution. To achieve high spectral bandwidth with moderate gradient demands, two temporal interleaves are used. We demonstrate the performance of this acquisition in controls and tumor patients, with use of regression statistics for determination of abnormality.
Introduction
To make spectroscopic imaging clinically feasible, rapid and robust acquisitions with high SNR are necessary. With transceiver arrays and high degree B0 shimming that have significantly improved the RF and susceptibility performance at 7T, we report on implementation of a spin echo rosette spectroscopic image achieving acquisitions in under 3minutes with nominal resolutions of 0.7cc (9mm3) to 0.3cc (6x6x9mm3). The planar rosette is tested and demonstrated in controls and tumor patients.Methods
A Siemens whole body 7T 8 channel multiple transmit system with body gradient coil, a very high order shim insert (VHOS, Resonance Research Inc.) and 8x2 transceiver array was used. The transceiver array was driven in coil pairs using 8 one-to-two splitters with independent reception from all 16 channels. B1 shimming was performed targeting two distinct RF profiles: the large homogeneous distribution of all intracranial tissue and a ring distribution targeting the superficial skin and skull. B0 shimming was optimized over the slice using BOLERO (1) with high degree shimming.
A planar rosette sequence used a 9mm slice selection and a semi-selective frequency refocusing pulse for water suppression supplemented with a narrow band adiabatic inversion pulse. Lipid suppression was achieved using two adiabatic inversion pulses applied through the spatially distinct B1 ring distribution (2). A moderate TE of 40ms was chosen to reduce macromolecular contributions to the baseline and reduce spectral overlap with amino acids. The spatial encoding was performed using interleaved circular (radial and angular frequencies w1=w2) rosette trajectories with Nshots=52, each shot rotated by 2pi/Nshots. The kmax = Nx/(2*FOV) and spectral BW sampling is achieved by w1 = pi*BW/nTI. To achieve a spectral BW=2500Hz at 7T, multiple temporal interleaves nTI>1 are used; with nTI=2, a single circular trajectory is acquired in 800us (2/spectral bandwidth BW). With temporal interleaves, a relatively mild gradient slew rate of <60mT/m/ms and Gmax of 7mT/m is accommodated; no additional eddy current corrections or trajectory corrections were needed. Reconstructions were performed using a 3D grid (kx, ky and time) with a Kaiser-Bessel kernel with a window W=4 on a 2-fold oversampled grid (3). Phasing and coil combination was performed using a matched anatomical scout. Spatial filtering was applied with a hamming filter in-plane, apodization and convolution difference applied in the time domain prior gridding. LCModel was used for curve fitting.
N=4 control subjects were studied to define the regression statistics for Cr/NAA and Ch/NAA as a function of fraction GM. Tissue segmentation was performed using Freesurfer and fraction GM calculated after convolution of the segmented images with the point spread function of the rosette acquisition and slice excitation profile. LCM spectral analysis was performed evaluating planar frontal and parietal regions and Cr/NA values regressed against fraction gray matter (fGM). Pixel rejection criteria were: total brain content <40%, Cramer Rao values >15%, linewidth >0.12ppm, and maximal excursion due to lipid was <2.0.
Results
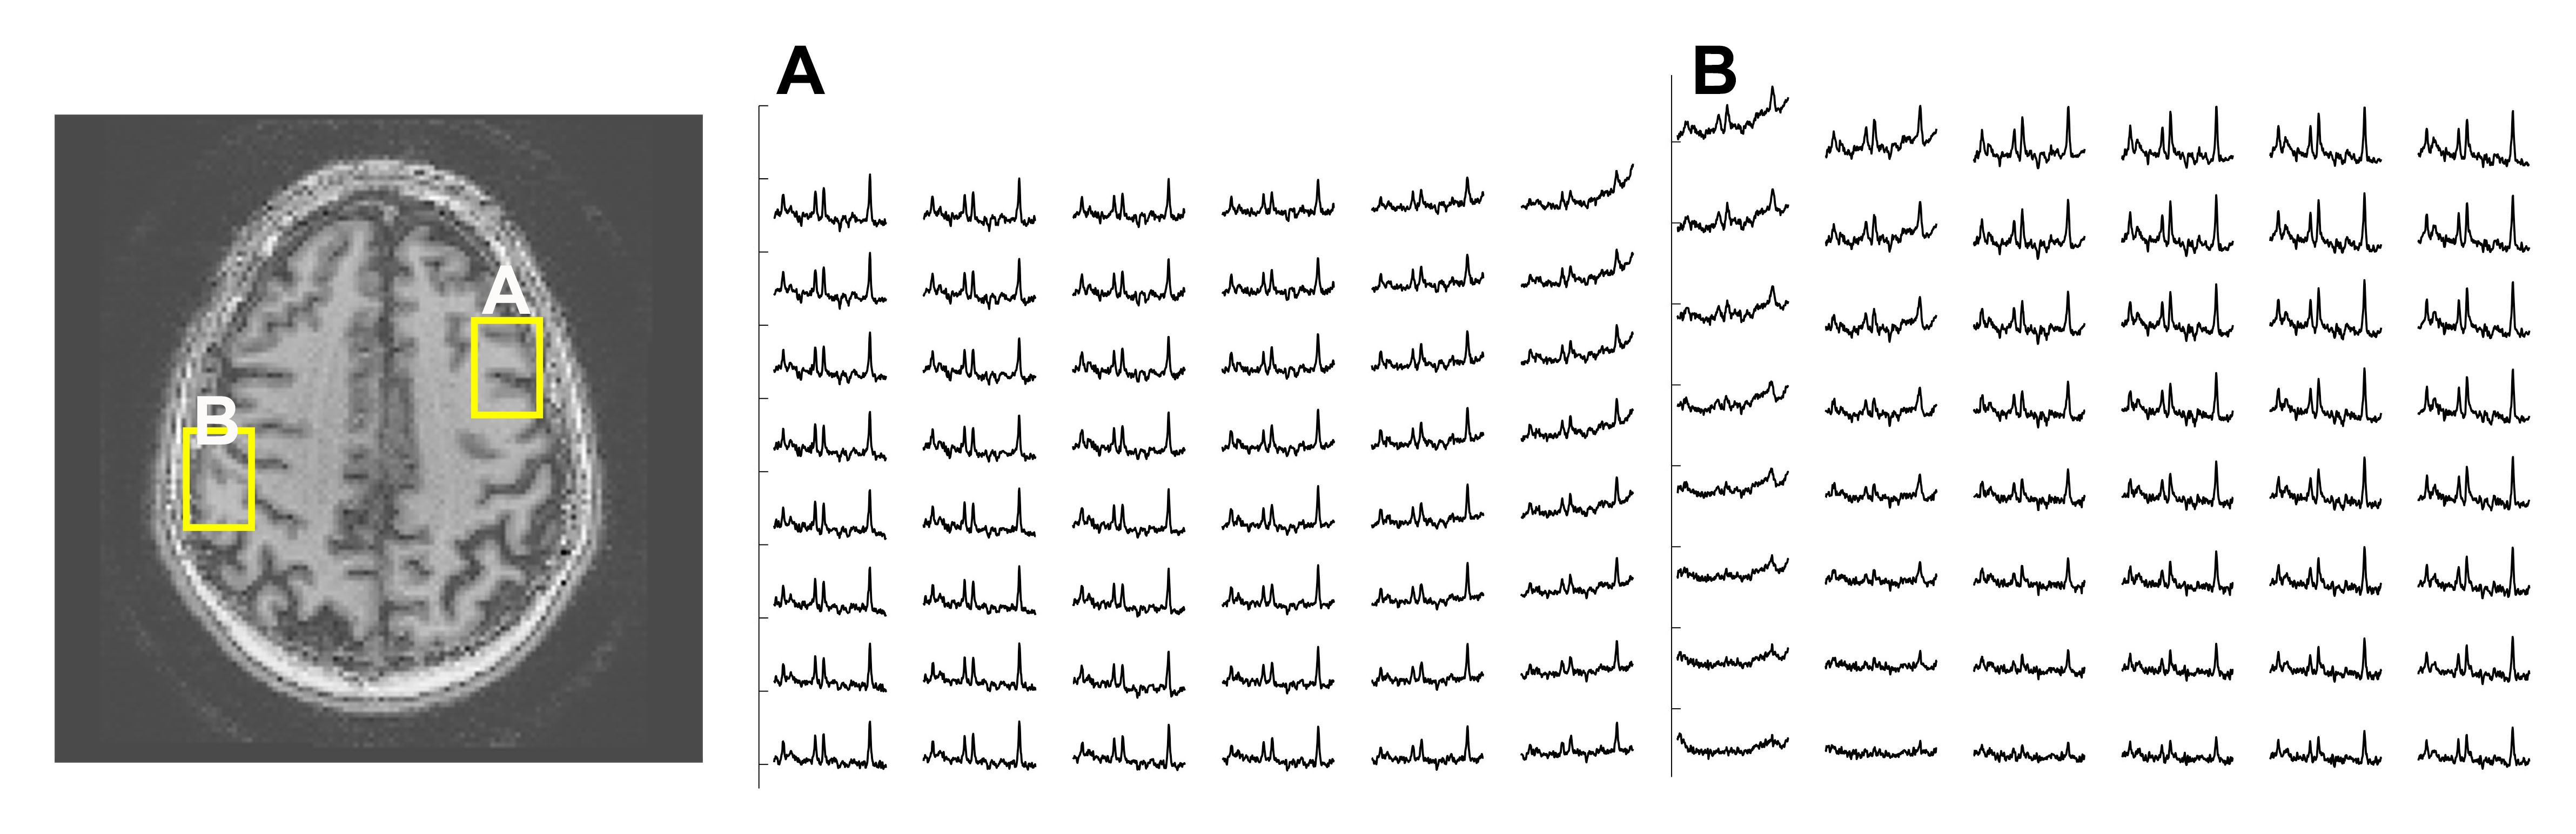
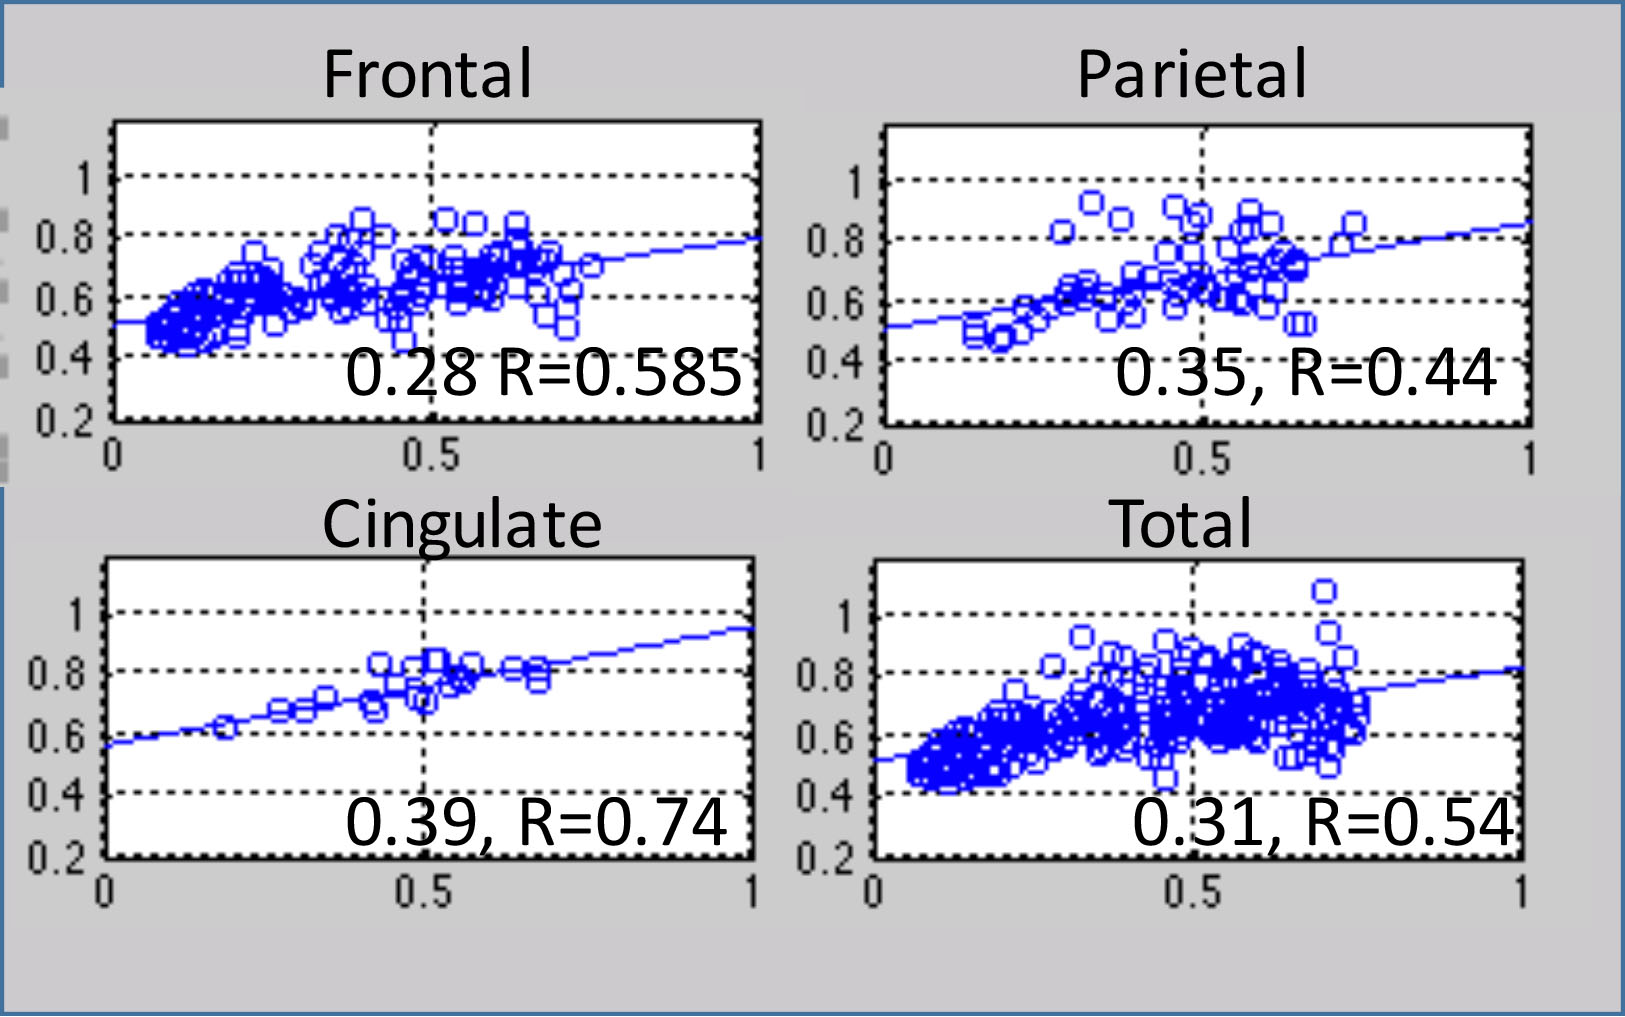
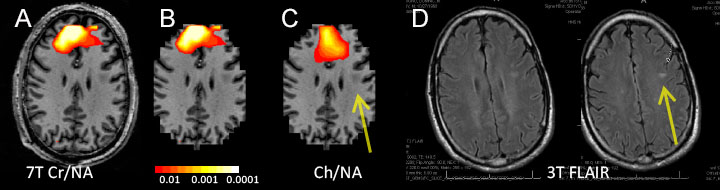
Fig. 1 shows TE=40ms, TR 1.5sec data from 6x6x9mm acquired in 2min48sec, n=52 shots, FOV 216. To demonstrate spectral quality, blocks of spectra shown from the brain edge are shown. In n=4 control subjects, the regression coefficients for Cr/NA with fGM*m + b gave for frontal lobe tissue 0.248±0.078 slope, 0.500±0.46 intercept, with standard error (SE) regression values 0.077±0.005; for frontal + parietal tissue 0.298±0.020 slope, 0.501±0.049 intercept with SE regression 0.092±0.005. Ch/NA did not exhibit significant dependence with fGM. Fig. 2 shows regression data from a control. Fig. 3 shows Cr/NA (Fig. 3A,B) and Ch/NA (Fig. 3C) statistical overlays from a post-therapy low grade glioma patient. To show extent of spectral quality, Fig. 3B only shows pixels (either anatomical or abnormal color overlay) that survived the rejection criteria; comparing Fig. 2A with 2B shows relatively few rejected pixels. This patient was subsequently clinically assessed to have no progression, consistent with the negative MRSI findings over the region of tumor (arrow).Discussion
The smoothly varying rosette trajectory enables data to be acquired over the entire signal decay window (3). At the same time, there are minimal gradient demands, minimal eddy currents and high flexibility with regards to the target spatial resolution and spectral bandwidth. At 7T where nTI=2 temporal interleaving is used to acquire the needed spectral BW without excessive gradient demand, there are no problems with spectral quality (linewidth, baseline), consistent with the minimal eddy current performance. The acquisition lends itself to a variety of optimizations, e.g., including a j-refocused acquisition and additional longitudinal spatial localization.Acknowledgements
This work supported by NIH R01EB011639, R01NS090417 and R01NS081772.References
1. Pan JW, Lo KM, Hetherington 2012 MRM 68(4):1007-17 2. 2. Hetherington HP, Avdievich NI,Kuznetsov A et al. MRM 2010 63(1):9- 19 3. 3. Schirda C, Zhao T, Andronesi O et al 2016. MRM 76(2):380-90.Figures