0242
Enhancement and Evaluation of the White Matter Connectome of the IIT Human Brain Atlas1Biomedical Engineering, Illinois Institute of Technology, Chicago, IL, United States
Synopsis
In the IIT Human Brain Atlas
Introduction
Digital human brain atlases consisting of MRI-based templates and semantic labels serve a critical role in neuroimaging. As part of the IIT Human Brain Atlas project (www.nitrc.org/projects/iit), we have developed anatomical as well as state-of-the-art diffusion tensor 1 and high angular resolution diffusion imaging (HARDI) templates 2 , probabilistic gray matter labels 3 , and probabilistic connectivity-based white matter labels 4 for the young adult brain. The purpose of this work was two-fold: a) to enhance the white matter connectome of the atlas through an improved tractography strategy, appropriate filtering of streamlines, and use of more precisely defined gray matter labels, and b) to evaluate how representative the new connectome is of young adult participants of the Human Connectome Project (HCP) 5 . The new connectome and affiliated resources are made available in version 4.5 of the IIT Human Brain Atlas.Methods
Resources used: The following were used in this work: i) the available HARDI and DTI templates of the IIT Human Brain Atlas (v.4.1), ii) new, more precisely defined gray matter labels generated for the atlas 6 using an improved spatial normalization strategy, and iii) the structural and diffusion MRI preprocessed data of 20 unrelated young adult HCP participants with balanced sex and age.
Connectome construction: Whole brain anatomically-constrained tractography 7 was performed on the IIT HARDI template and 20 HCP datasets using MRtrix3 (algorithm=iFOD2, select=100M, max angle=45°, step-size=1mm, min length=2mm, max length=250mm, backtrack=True) (Fig.1). Each resulting tractogram was filtered to 10 million streamlines using spherical-deconvolution informed filtering (SIFT) 8 . The filtered tractograms were then mapped to the corresponding gray matter masks with 84 Desikan-Killiany regions 9 to generate the connectomes of the IIT atlas and each of the 20 HCP participants, each containing 6972 edges (Fig.1).
Connectome evaluation: First, the edges of the IIT connectome were filtered to include only those with intensity higher than 5% of the strongest edge intensity. The following analysis involves the 602 edges that survived this filtering. Next, the streamlines of the corresponding edges of the 20 HCP connectomes were transformed to IIT space via DTITK registration of the HCP diffusion tensor data 10 to the IIT DTI template, which is in the exact same space as the IIT HARDI template. Tract density images (TDI) were generated for the edges of the IIT connectome and transformed HCP connectomes. The streamlines and TDIs of each edge of the IIT connectome were compared to those of each HCP connectome, as follows. For each edge, masks of the streamlines were generated for the IIT connectome and each of 20 HCP connectomes 11 , and the F1 scores of all IIT and HCP pairs (20 pairs) were computed to quantify the spatial correspondence between IIT and HCP tractograms. The same process was repeated for each HCP connectome. Pearson’s correlation coefficient was also computed for TDI maps of all IIT and HCP pairs. Again, the same process was repeated for each HCP connectome. Average F1 scores and Pearson’s correlations were generated for each edge of each tractogram, to express the average correspondence to all others. One sample t-tests (Bonferroni correction) were used to test in each edge of the IIT connectome if the average F1 score and Pearson’s correlation were significantly different than those of the HCP participants. The average F1 score and Pearson’s correlation over all edges were also compared between the IIT connectome and HCP participants.
Results and Discussion
TDI and edge density images 12 of the IIT connectome are shown in Fig.2. The 602 edges that survived the thresholding are shown in Fig.3B 13 . The average F1 scores and Pearson’s correlation coefficients expressing the spatial correspondence between IIT and the 20 HCP connectomes are shown in Fig.4A,D. The average F1 score and Pearson’s correlation of the IIT connectome were significantly higher than those of the HCP group in most edges (Fig.4B,E). In contrast, the average F1 score and Pearson’s correlation of the HCP group were significantly higher than those of the IIT connectome in fewer edges (Fig.4C,F). After averaging the F1 scores and Pearson’s correlations over all edges, the values of the IIT connectome were significantly higher than those of the HCP group (p<0.0001), indicating that the IIT connectome is representative of individual HCP connectomes.Conclusion
A new version of the IIT white matter connectome was developed in this work. The new IIT connectome was compared to those of 20 young adult HCP participants and it was demonstrated that the IIT connectome is representative of individual HCP connectomes.Acknowledgements
National Institute on Aging R01AG052200References
1. Zhang S., Arfanakis K. Evaluation of standardized and study-specific diffusion tensor imaging templates of the adult human brain: Template characteristics, spatial normalization accuracy, and detection of small inter-group FA differences. Neuroimage 2018;172:40-50.
2. Varentsova A., et al. Development of a high angular resolution diffusion imaging human brain template. Neuroimage 2014;91:177-186.
3. Zhang S., Arfanakis K. Development of a Comprehensive Digital Human Brain Atlas. ISMRM 2013, p.2129.
4. Varentsova A., et al. Connectivity-based atlas of human brain white matter in ICBM-152 space. ISMRM 2015, p.966.
5. Van Essen D.C., et al. The WU-Minn Human Connectome Project: An Overview. Neuroimage 2013;80:62-79.
6. Qi X., et al. IIT Human Brain Atlas: Enhancement of T1-weighted Template, Tissue Probability Maps and Gray Matter Atlas. ISMRM 2017, p.4688.
7. Smith R.E., et al. Anatomically-constrained tractography: improved diffusion MRI streamlines tractography through effective use of anatomical information. Neuroimage 2012;62:1924-1938.
8. Smith R.E., et al. SIFT: Spherical-deconvolution informed filtering of tractograms. Neuroimage 2013;67:298-312.
9. Desikan R.S., et al. An automated labeling system for subdividing the human cerebral cortex on MRI scans into gyral based regions of interest. Neuroimage 2006;31:968-980.
10.Sotiropoulos S., et al. Advances in diffusion MRI acquisition and processing in the Human Connectome Project. Neuroimage 2013;80:125-143.
11.Amanatides J., Woo A. A fast voxel traversal algorithm for ray tracing. Eurographics 1987.
12.Owen J.P., et al. Edge Density Imaging: Mapping the Anatomic Embedding of the Structural Connectome Within the White Matter of the Human Brain. Neuroimage. 2015;109:402-417.
13.Maier-Hein K.H., et al. The challenge of mapping the human connectome based on diffusion tractography. Nature Communications. 2017;8:1349.
Figures
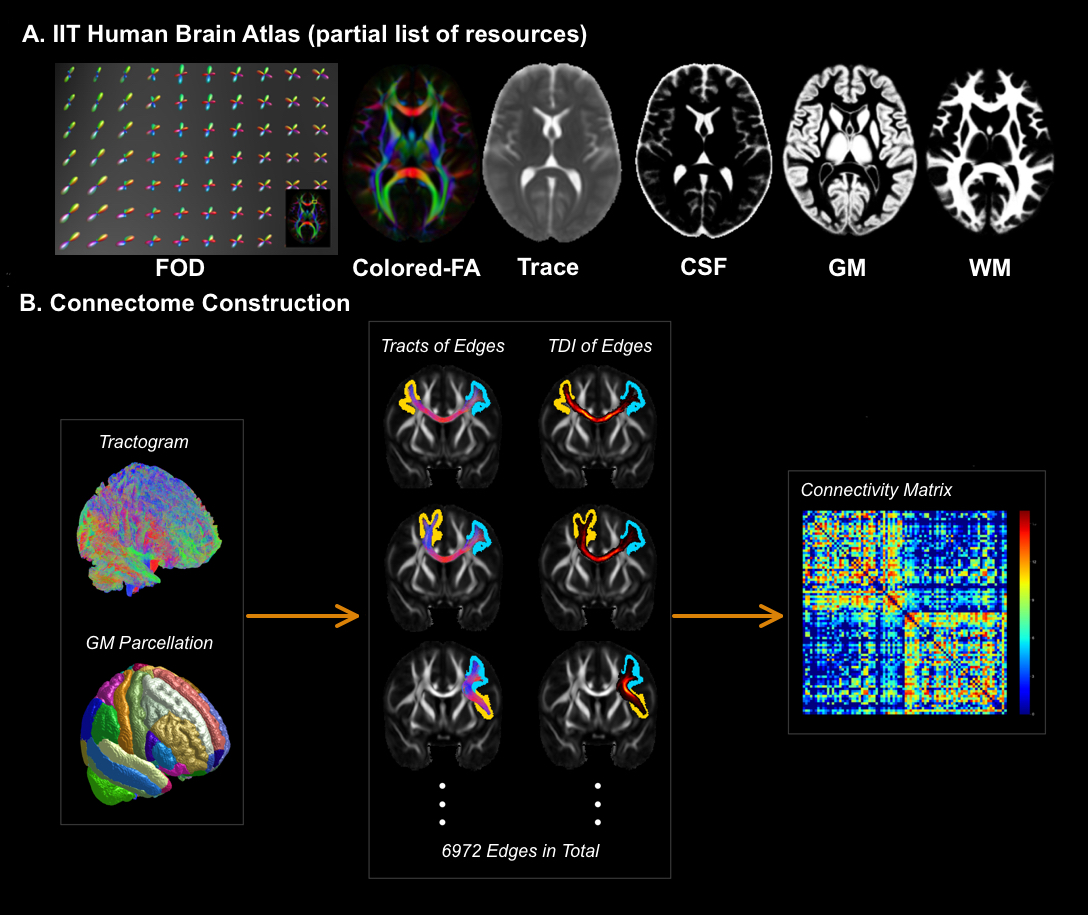
Figure 1.
(A) Partial list of resources of the IIT Human Brain Atlas used in generating the new IIT connectome. (B) Connectome construction process.
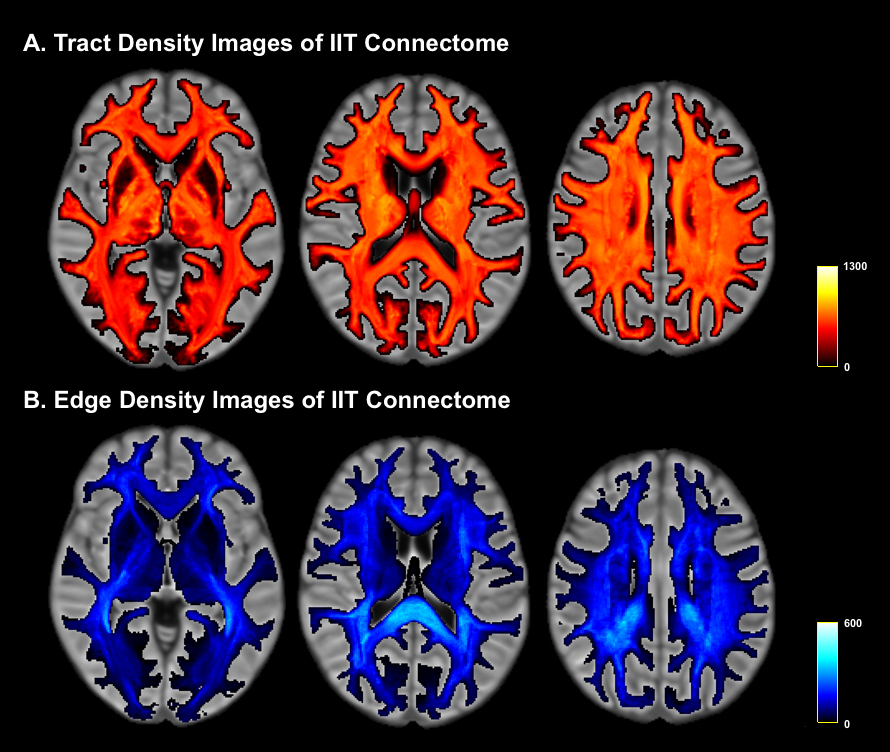
Figure 2.
(A) Tract density images and (B) edge density images of the new IIT connectome.
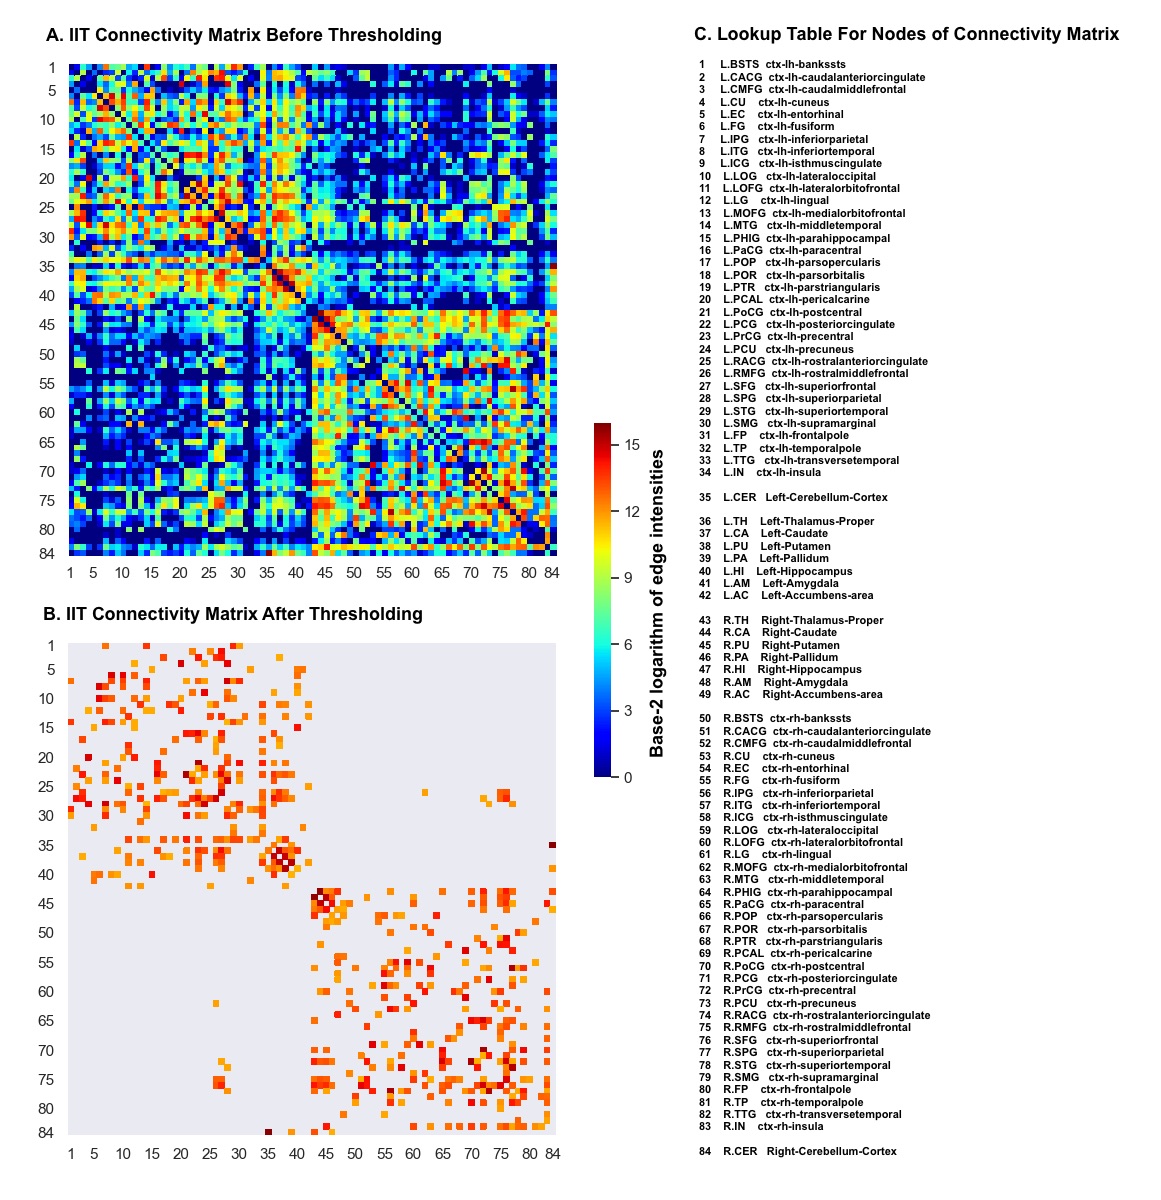
Figure 3.
IIT connectome before (A) and after (B) thresholding. (C) Lookup table of the nodes of the connectome.
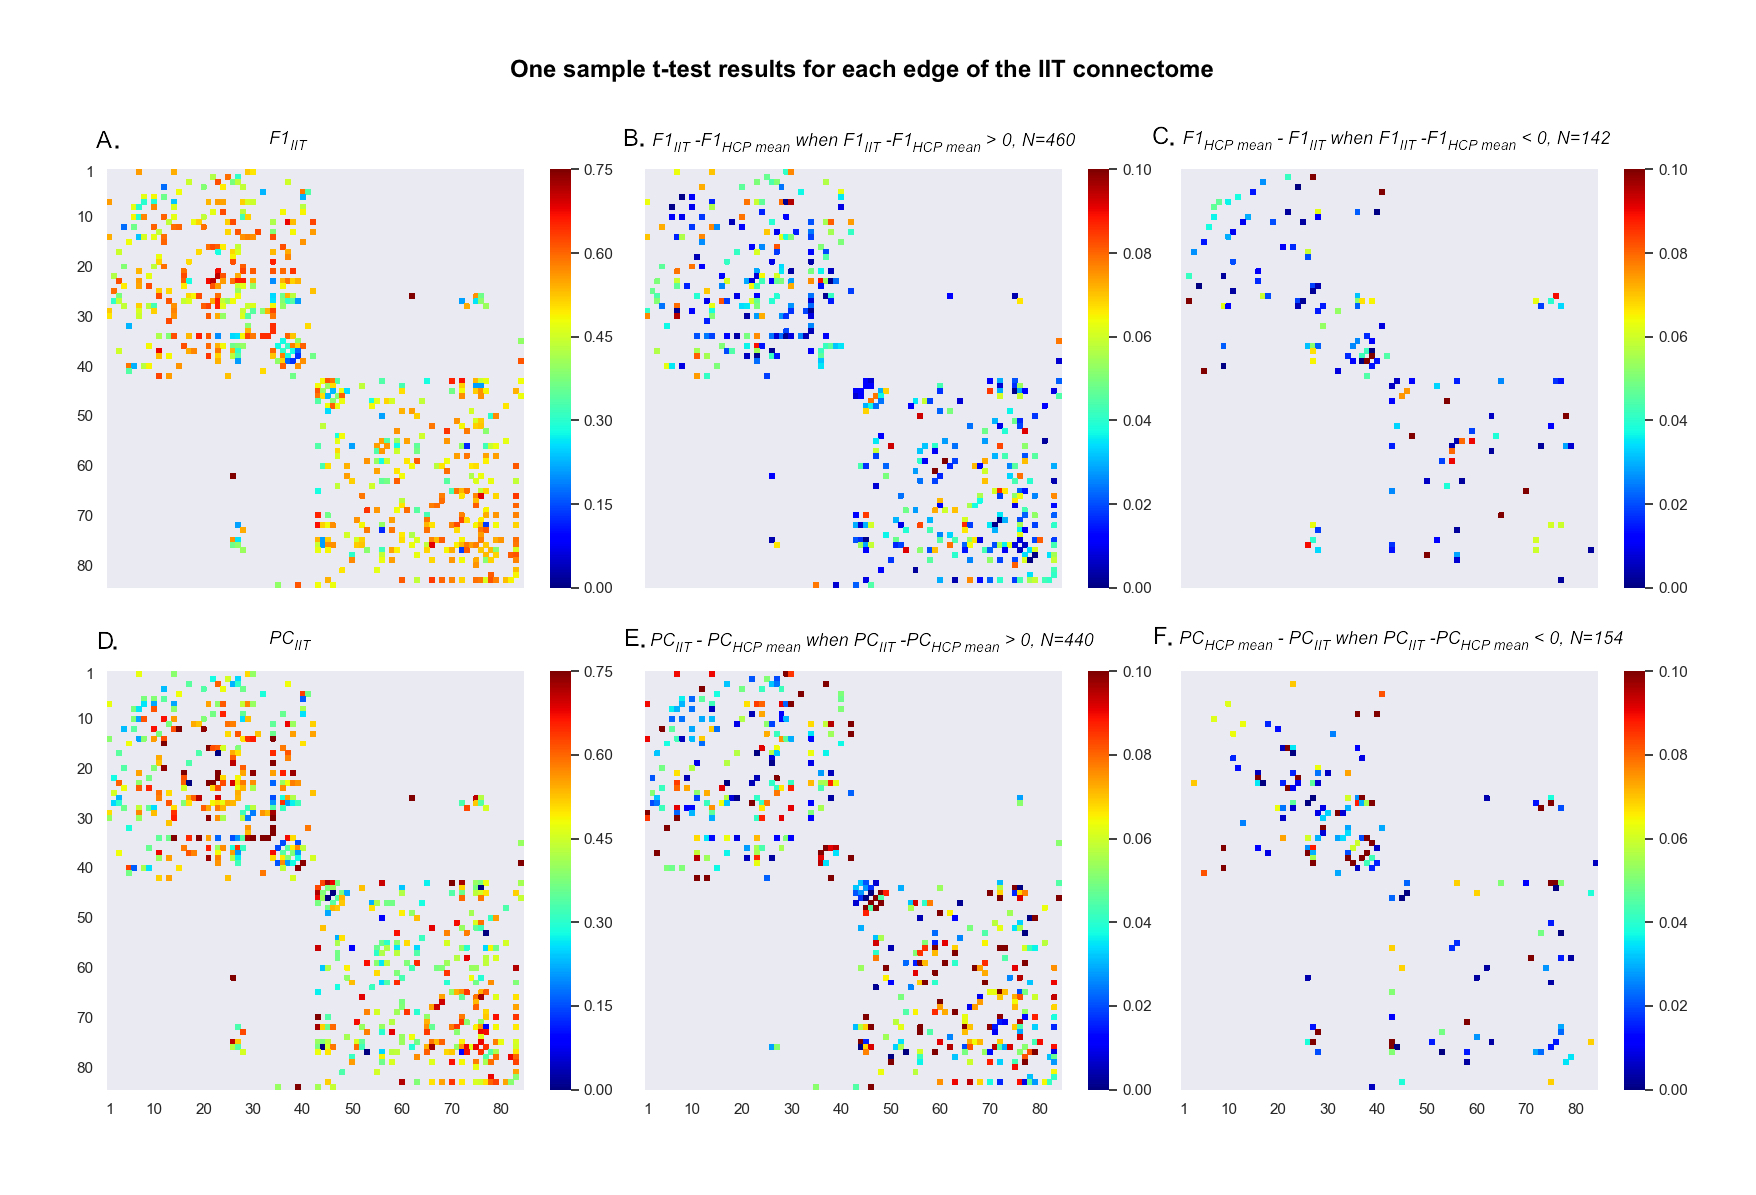
Figure 4.
The average F1 scores (A) and Pearson’s correlations (D) of the IIT connectome with all 20 HCP connectomes. Edges where the average F1 score (B) and Pearson’s correlation (E) of the IIT connectome were significantly higher than those of the HCP group (p<0.05). Edges where the average F1 score (C) and Pearson’s correlation (F) of the IIT connectome were significantly lower than those of the HCP group (p<0.05). Figures B, C, E, F show the absolute difference in F1 scores or Pearson’s correlations between the IIT and HCP connectomes.
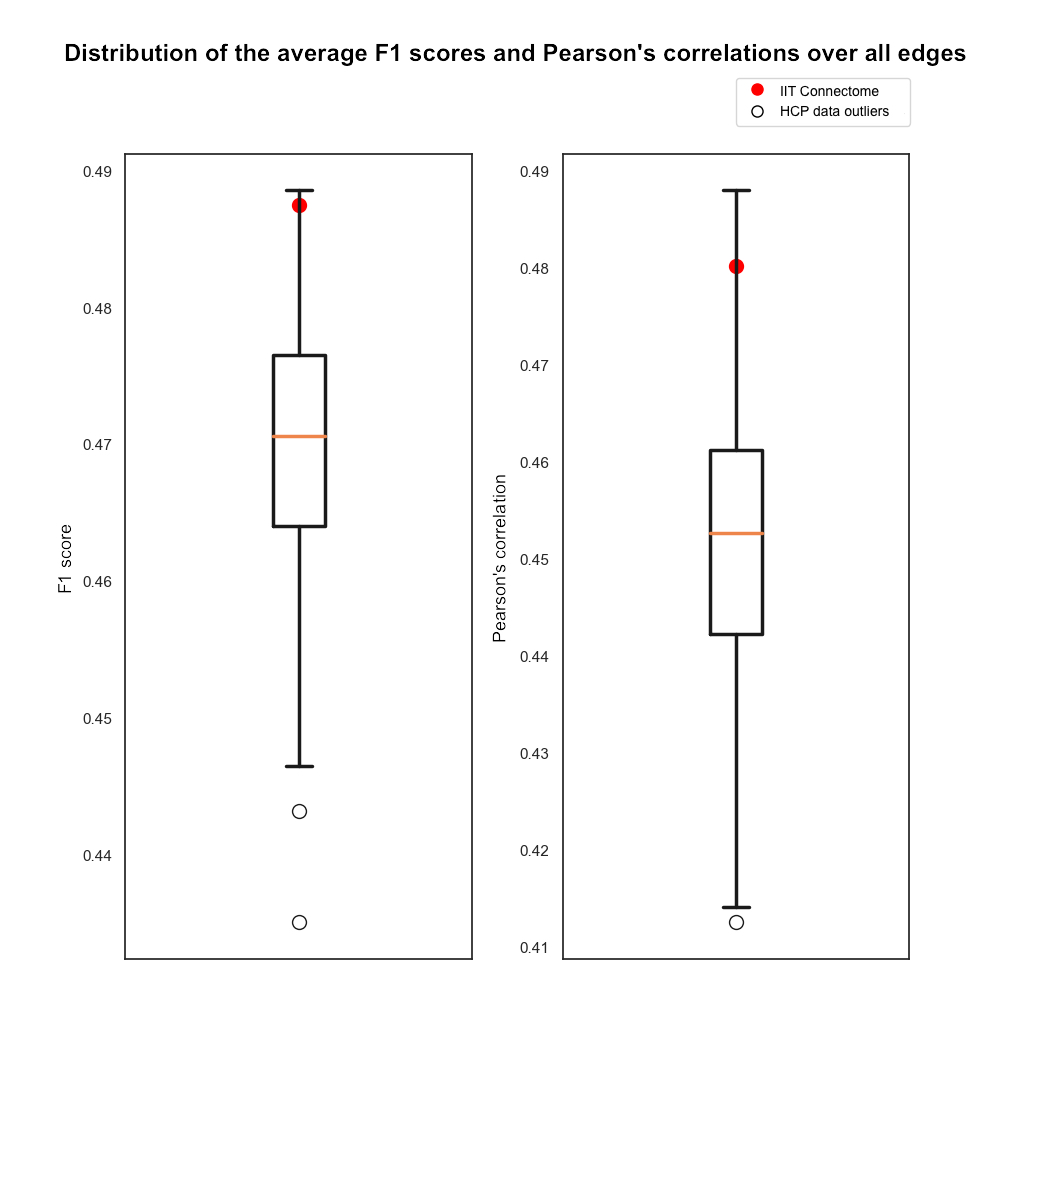
Figure 5.
Distribution of the average F1 scores and Pearson’s correlations over all edges for the HCP and IIT connectomes. The red dot corresponds to the values for the IIT connectome.