0239
CVR-MRICloud: an automated online tool for the processing of cerebrovascular reactivity (CVR) MRI data1Department of Radiology, Johns Hopkins School of Medicine, Baltimore, MD, United States, 2AnatomyWorks LLC, Baltimore, MD, United States, 3Department of Biomedical Engineering, Johns Hopkins University, Baltimore, MD, United States, 4Kennedy Krieger Institute, Baltimore, MD, United States
Synopsis
Cerebrovascular reactivity (CVR) has recently become a focus for many labs. However, CVR calculation has always required at least some degree of manual intervention. Therefore, our lab has developed CVR-MRICloud, a free, online, fully automated CVR processing pipeline. Our pipeline returns CVR maps, relative bolus arrival time maps, and region-of-interest CVR values. The maps are given in their original space as well as standardized MNI space. The pipeline has been shown to procure results corresponding to accepted CVR processing techniques that rely on manual intervention. This pipeline has potential to streamline other researchers’ acquisition of CVR values in subjects.
Purpose
Cerebrovascular reactivity (CVR) measures the brain’s vasodilatory capability and is thought to be a more accurate index of cerebrovascular health compared to static measures such as cerebral blood flow (CBF) and cerebral blood volume (CBV). This technique has recently garnered interest in various research fields including cognitive aging, neurovascular diseases, and neurodegenerative diseases1. Advanced analysis algorithms have also been developed for reliable estimations of parametric maps2. However, to our knowledge, no quantitative CVR processing software is currently available for free to the community. In this work, we developed a fully automated, cloud-based tool for CVR data processing and made it freely available through MRICloud.org3,4. Using BOLD CVR data and CO2 recording as inputs, the tool performs comprehensive analyses and generates as outputs CVR and bolus-arrival-time (BAT) maps in both individual space and standardized MNI space, as well as regions-of-interest (ROIs) CVR values in up to 289 brain regions defined by a multi-atlas. This report summarizes the pipeline’s interface, algorithms, and results.Methods
Basic architecture of the tool: The proposed CVR online processing tool can be found at https://braingps.mricloud.org/cvr. It is developed as an expansion of the MRICloud.org tools described previously3. The basic concept of the cloud tools is that the user only needs to upload the (de-identified) raw data files to our server and the server will perform sophisticated analysis. Once completed, the user can download a comprehensive set of output results.
Data upload: Our pipeline is designed to process CVR MRI data collected using a BOLD sequence while subjects undergo a hypercapnic gas challenge, in which they inhale CO2-enriched air and room-air in an interleaved fashion. Breathing CO2 time course is simultaneously recorded via capnography. To run our tool, the user is required to upload the following data files: BOLD image files, the subject’s CO2 trace during the scan (the complete inhaling and exhaling trace, not just the end-tidal, Et, CO2 values), and a segmented T1-MPRAGE image which will allow the normalization of the CVR results to MNI space. In addition, the user is required to provide basic information about their data: TR used in the BOLD scan (in seconds), slice acquisition order (optional), and the sampling rate of the CO2 trace data (in hertz).
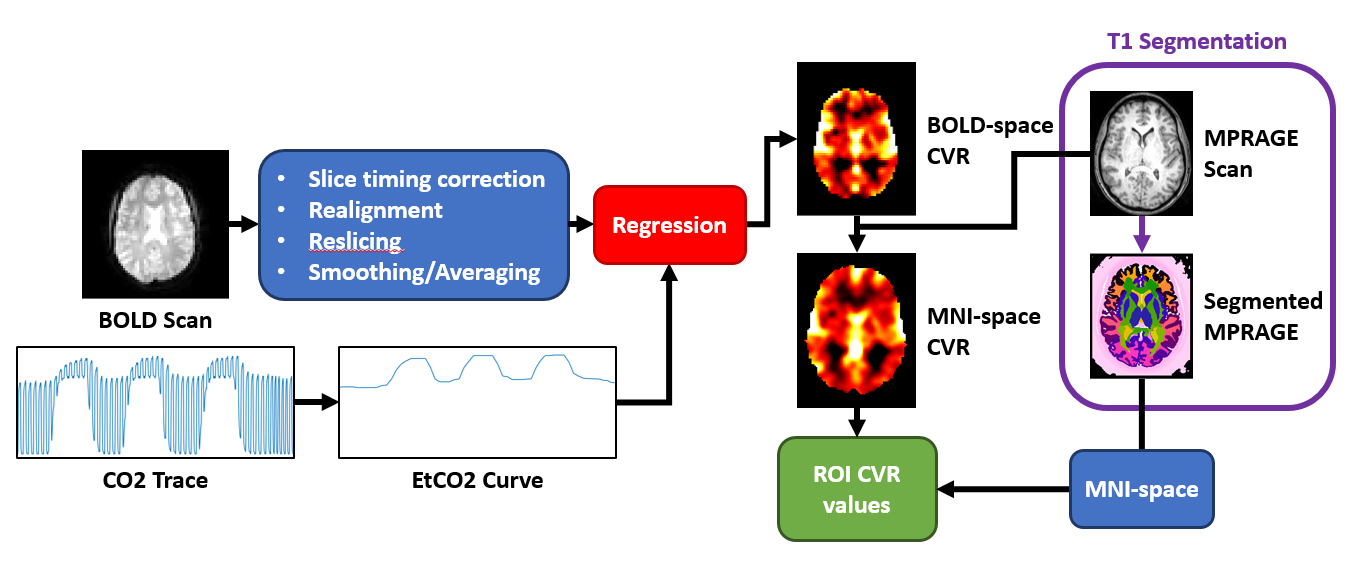
CVR processing: The algorithms underlying the processing pipeline are illustrated in Figure 1. The BOLD data are first processed for slice timing correction, realignment, reslicing, then smoothing and averaging. The end-tidal CO2 (EtCO2) curve is calculated from the CO2 trace using an automatic algorithm. To calculate CVR values, the EtCO2 must be time-shifted to align with the BOLD signal time course. The optimal shift is determined by a series of linear regressions to identify the best temporal alignment between the EtCO2 and whole-brain BOLD time courses. The aligned EtCO2 is then used as a regressor for a voxel-wise linear regression with the BOLD data, which yields the CVR map. Additionally, the relative shift between the voxel-wise BOLD time course and the whole-brain BOLD is calculated, which denotes the time it takes for the blood to travel to different parts of the brain, i.e. bolus arrival time (BAT). The CVR and BAT maps are then coregistered to MPRAGE-space and normalized to the MNI-space. Finally, the segmented MPRAGE image is used to calculate ROI CVR values.
Outcomes: The pipeline returns voxel-wise CVR and BAT maps. All calculated maps are given in the BOLD-space, MPRAGE-space, and MNI-space. CVR maps are also returned with values relative to their whole-brain value, i.e. relative CVR maps. CVR maps in MNI-space are provided in 1mm3 and 2mm3 voxel resolution. This corresponds to a total of 19 maps (16 CVR, 3 BAT). ROI CVR values (provided in text file) are given in three sets: 19, 54, and 289 ROIs with increasingly fine segmentations.
Results
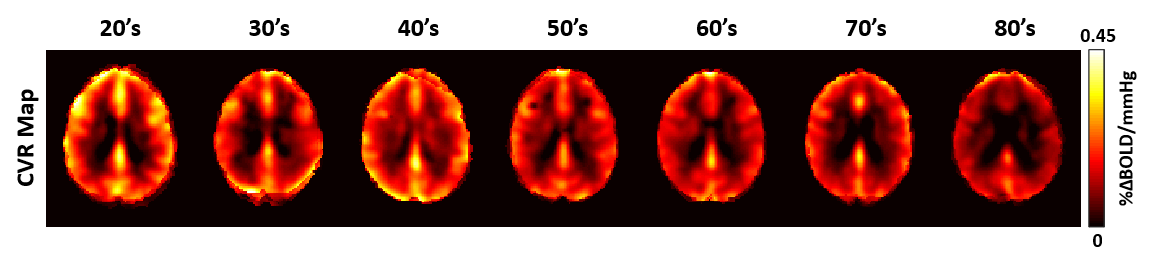
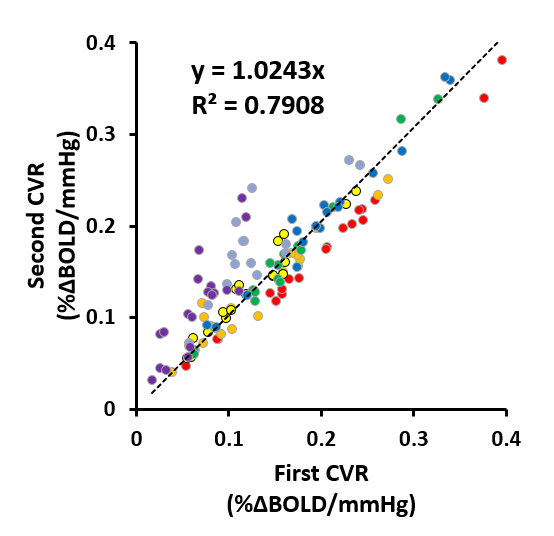
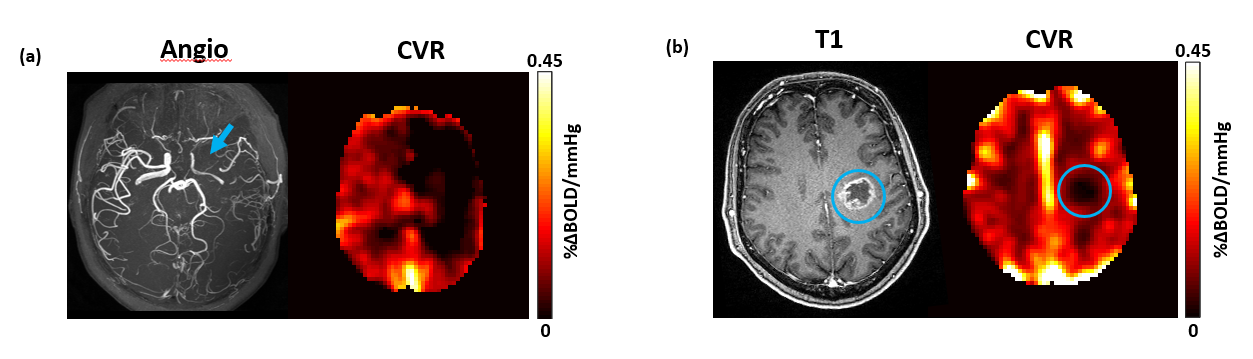
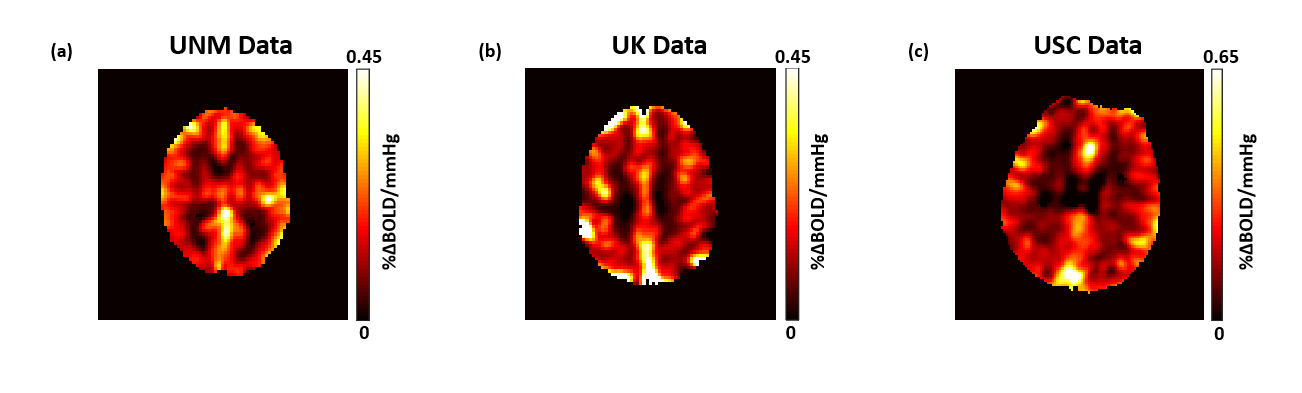
Figure 2 shows CVR maps produced by our pipeline using a set of data collected on 33 healthy participants ranging from 20-89 years old. Age-related decrease in CVR can be seen, consistent with previous report5,6. Figure 3 illustrates our pipeline’s ability to assess CVR reproducibility, in which each subject received two CVR scans with repositioning and the scatter plot of quantitative CVR values is shown. Figure 4 shows our pipeline’s outputs in two representative clinical cases, arterial stenosis and brain tumor. Finally, Figure 5 shows CVR results when applying our pipeline to CVR data collected at three other institutions, demonstrating the compatibility of our tool with data from other laboratories.Conclusion
Our automated CVR-MRICloud processing pipeline holds potential as a research and diagnostic tool for various institutions around the world.Acknowledgements
This work was made possible with support from grants R01NS084957 and R44NS078917.References
1. U. S. Yezhuvath, K. Lewis-Amezcua, R. Varghese, G. Xiao, and H. Lu. On the assessment of cerebrovascular reactivity using hypercapnia BOLD MRI. NMR Biomed. 2009;22(7):779-786.
2: P. Liu, J. B. De Vis, and H. Lu. Cerebrovascular reactivity (CVR) MRI with CO2 challenge: A technical review. NeuroImage. 2018; xxx:1-12.
3. S. Mori et al.. MRICloud: Delivering High-Throughput MRI Neuroinformatics as Cloud-Based Software as a Service. IEEE Comp. Sci. & Eng. 2016; 18(5):21-35.
4. MRICloud website, https://braingps.mricloud.org
5: H. Lu et al.. Alterations in cerebral metabolic rate and blood supply across the adult lifespan. Cereb. Cortex. 2011; 21(6):1426-1434.
6: S.-L. Peng, X. Chen, Y. Li, K. M. Rodrigue, D. C. Park, and H. Lu. Age-related changes in cerebrovascular reactivity and their relationship to cognition: A four-year longitudinal study. NeuroImage. 2018; 174:257-262.
Figures