0238
Separation of Cardiac- and Respiratory-driven CSF Motions under Free Breathing based on Realtime Phase Contrast Imaging and S-Transform1Department of Human and Information Science, School of Into Science and Technology, Tokai University, Hiratsuka, Japan, 2Center for Frontier Medical Engieering, Chiba University, Chiba, Japan, 3Course of Electrical and Electronic Engineering, Graduate School of Engineering, Tokai University, Hiratsuka, Japan, 4BioSim Research Center, BioView Inc., Tokyo, Japan, 5Department of Radioligy, Tokai University Hospital, Isehara, Japan, 6Department of Neurosurgery, Tokai University School of Medicine, Isehara, Japan
Synopsis
To separately visualize respiratory- and cardiac-driven motions of intracranial cerebrospinal fluid (CSF) under free breathing, CSF velocity distribution in 6 healthy volunteers and 3 hydrocephalus patients were acquired with asynchronous real time phase contrast (PC). Spectrograms of CSF velocity waveform as well as ECG and respiratory signals were obtained by Stockwell Transform (ST), in which the length of a Gaussian window length was adaptively changed according to the time-varying frequency of the signals. Comparison with the conventional short-term Fourier transform (STFT) with fixed length window revealed that separation of respiratory and cardiac components of CSF motion was possible with ST.
INTRODUCTION
Cerebrospinal fluid (CSF) motion can be divided into three categories, cardiac-driven, respiratory-driven, and "bulk flow"1. In recent years, it has been reported that CSF plays a significant role in washing out neuro-wastes such as β-amyloid accumulated in the brain via an ingenious mechanism so-called “glymphatic system”2,3. Contributions of the three motions to this clearance system in physiological conditions is not clear. Moreover, in clinical diagnosis of hydrocephalus, effects of these motions have not been investigated. Although, the total CSF motion has been visualized by various techniques such as time-Spatial Labeling Inversion Pulse (Time-SLIP)4, and improved Motion Sensitized Driven Equilibrium (iMSDE)5, they do not quantify the velocity of each motion. Aiming at the cardiac- and respiratory-induced CSF motions, it was demonstrated that separation and quantification of the two motions are possible when using phase contract (PC) techniques under instructed breathing with regular period6. In order to apply such separated CSF motion quantification to diagnosis of pathology of hydrocephalus, separation should be performed under free breathing. Therefore, the present work was conducted with a time-varying frequency analysis method, called S-transform7 in comparison with a conventional short time Fourier transform (STFT) analysis8.METHODS
Our institutional review board approved this study. Healthy volunteers and patients were imaged by asynchronous real-time PC at 3T with the following conditions: TR/TE, 6.0/3.9 msec; FA, 10 degrees; ST, 7 mm; Acquisition matrix, 256×256; velocity encode direction, FH; SENSE factor; 4, and velocity encoding (VENC), 10 cm/sec. The frame time was 217 msec pre image. Images were acquired for 3 healthy volunteers under controlled breathing, 3 healthy volunteers under free breathing, and 3 patients of hydrocephalus. The CSF velocity waveforms were recorded with both ECG and respiratory monitoring signals to seize the overall behavior of the motion. Spectrograms of STFT with 8-sec length hamming window was obtained from the CSF velocity waveforms using the following equation.
$$S_{v}(t, f)=\int_{-\infty}^{+\infty} v(\tau)w(t-\tau)e^{-j2\pi f\tau}d\tau$$
where $$$S_{v}(t, f)$$$ is the spectrogram, v(τ) is the velocity waveform obtained by PC, f is the frequency, and w(t-τ)is the window function(9). The window was shifted for 1 % of its length with 99% overlap with the adjacent window position.
In the formulation of ST7, 9 shown below, the length of the Gaussian window was adjusted according to the frequency of the signal.
$$S_v^p(t, f)=\int_{-\infty}^{+\infty} v(\tau)\frac{\mid f \mid^{p}}{\sqrt{2\pi}}e^{-\frac{(t-\tau)^{2}f^{2p}}{2}} e^{-j2\pi f\tau}d\tau$$
where $$$S_v^p(t, f)$$$ is the spectrogram and p is an optimization factor(9).
RESULTS
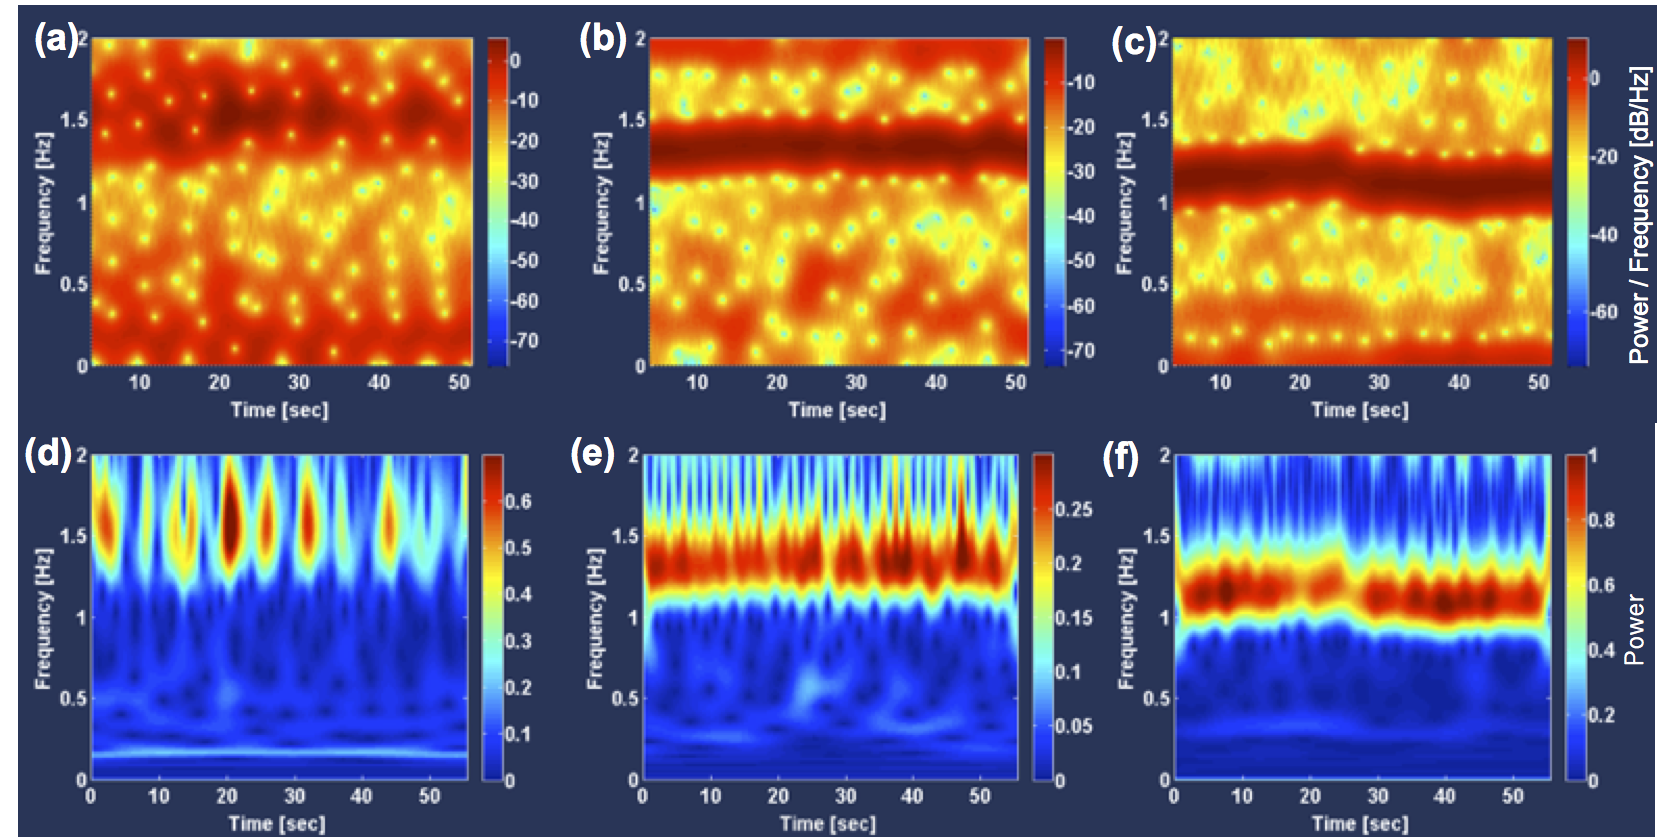
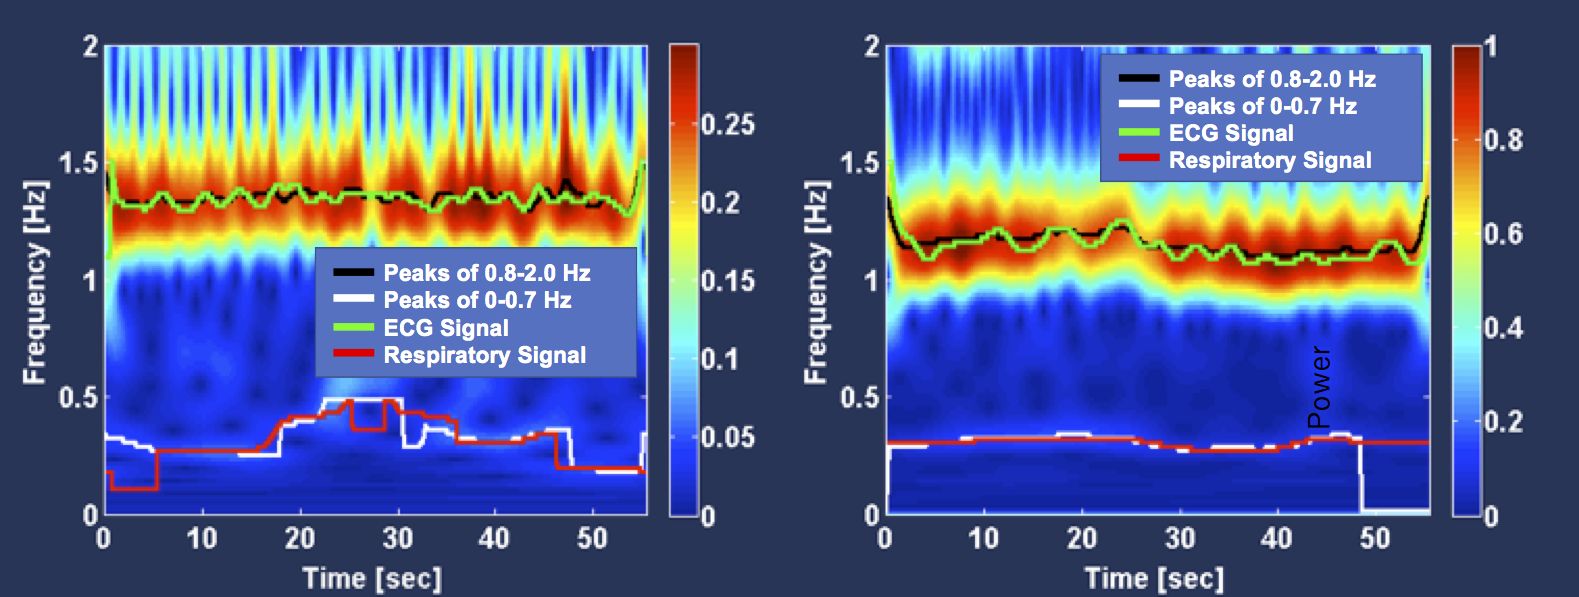
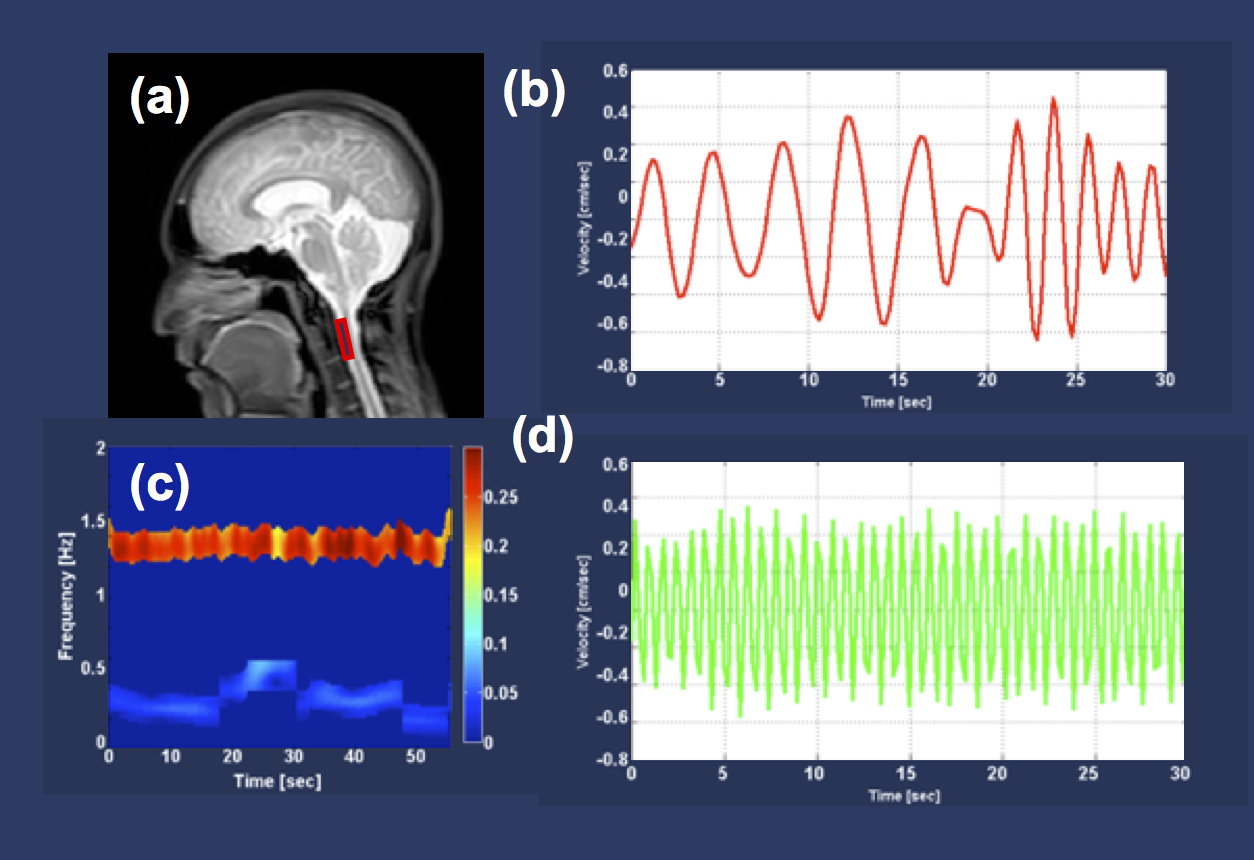
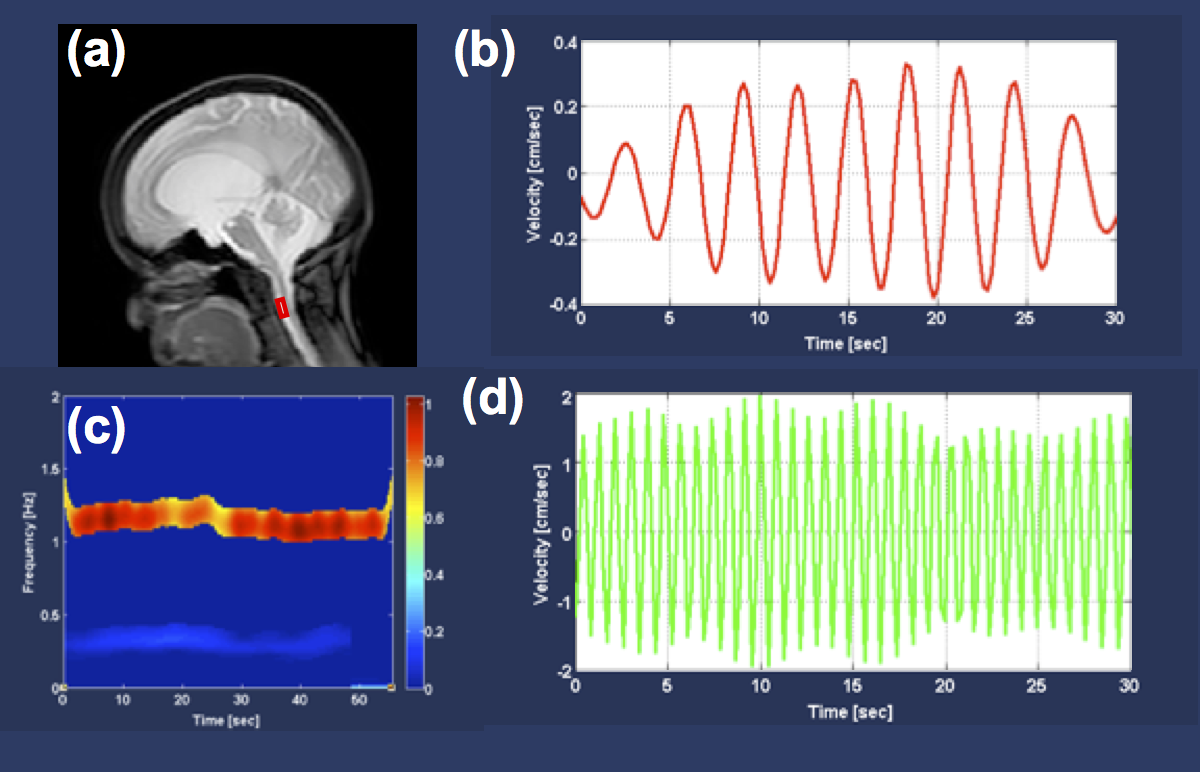
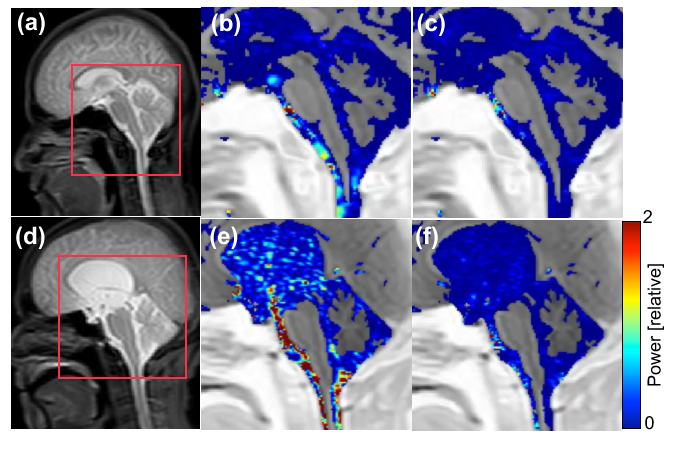
The STFT and ST spectrograms of the CSF velocity waveforms are shown in Fig. 1. The STFT spectrograms were obtained with 8-sec Hamming window. The ST spectrograms were obtained with p = 1 in these cases. The central frequencies of the cardiac and respiratory components in the free breathing cases of the healthy volunteers and the patient shown in Fig. 1 were extracted as the “ridge lines” of the spectrograms as depicted in Fig. 2. Figure 3 shows the respiratory and cardiac components of the CSF velocity obtained by using inverse ST of the selected bands around the ridge lines of the spectrogram for a heathy volunteer. Similar result for a patient are shown in Fig. 4. In Fig. 5, the spectral power of the cardiac and respiratory components of the CSF velocity were mapped for a healthy volunteer as well as for a patient of hydrocephalus.
DISCUSSION
In the STFT spectrogram shown in Fig. 1, the cardiac components were seen between 1 Hz to 1.5 Hz. The respiratory components were, however, not clear in both instructed and free breathing cases. On the other hand, in the ST results, the respiratory components at 0.16 Hz were quite clear in the instructed case. Even in the free breathing cases, it was possible to separately detect the respiratory components from the cardiac component, although somewhat less clear than the instructed breathing case. The time-varying central frequencies of cardiac and respiratory components were extracted as ridge lines of the spectrogram. Thus inverse ST transformed velocity waveforms were obtained successfully. The power map shown in Fig. 5 demonstrated that the cardiac components had higher power than the respiratory in both healthy and patient cases.CONCLUSION
To separate respiratory- and cardiac-driven CSF motion components under free breathing, spectrogram analyses based on STFT and ST were applied. Although both methods detected the cardiac component, only ST worked in terms of detection of respiratory component. The factor "p" appeared in the ST formula should be optimized for further improving the spectrogram quality.Acknowledgements
This work was supported in parts by Grant-in-Aid for Scientific Research (B), #17H04307, Ministry of Education, Culture, Sports, Science and Technology (MEXT), Japan.References
1. Matsumae M, Sato O, Hirayama A, Hayashi N, Takizawa K, Atsumi H, Sorimachi T. Research into the Physiology of Cerebrospinal Fluid Reaches a New Horizon: Intimate Exchange between Cerebrospinal Fluid and Interstitial Fluid May Contribute to Maintenance of Homeostasis in the Central Nervous System. Neurol Med Chir (Tokyo) 2016;56(7):416-41.
2. Jessen NA, Munk AS, Lundgaard I, Nedergaard M. The Glymphatic System: A Beginner's Guide. Neurochemical research 2015;40(12):2583-2599.
3. Iliff JJ, Wang M, Liao Y, Plogg BA, Peng W, Gundersen GA, Benveniste H, Vates GE, Deane R, Goldman SA, Nagelhus EA, Nedergaard M. A Paravascular Pathway Facilitates CSF Flow Through the Brain Parenchyma and the Clearance of Interstitial Solutes, Including Amyloid β. Science translational medicine 2012;4(147):147ra111-147ra111.
4. Yamada S, Miyazaki M, Yamashita Y, Ouyang C, Yui M, Nakahashi M, Shimizu S, Aoki I, Morohoshi Y, McComb JG. Influence of respiration on cerebrospinal fluid movement using magnetic resonance spin labeling. Fluids and barriers of the CNS 2013;10(1):36.
5. Horie T, Kajihara N, Matsumae M, Obara M, Hayashi N, Hirayama A, Takizawa K, Takahara T, Yatsushiro S, Kuroda K. Magnetic Resonance Imaging Technique for Visualization of Irregular Cerebrospinal Fluid Motion in the Ventricular System and Subarachnoid Space. World Neurosurg 2017;97:523-531.
6. Yatsushiro S, Sunohara S, Matsumae M, Kuroda K. Propagation Patterns of Cardiac-Driven and Respiratory-Driven Cerebrospinal Fluid Velocity Waves Characterized by Correlation Mapping in Conjunction with Asynchronous 2-Dimensional Phase Contrast Technique. Proc ISMRM 2017:p. 350.
7. Stockwell R, Mansinha L, Lowe R. Localization of the Complex Spectrum: The S Transform. IEEE Trans Sig Proc 1996;44(4):998-1001.
8. Tokushima T, Yatsushiro S, Sunohara S, Matsumae M, Atsumi H, Kuroda K. Short-term Fourier Transform Analysis of Respiratory- and Cardiac-driven Pulsation of Cerebrospinal Fluid under Free Breathing. Porc ISMRM 2018:p. 2878.
9. Igor D, Ervin S, Jiang J. Frequency Based Window Width Optimization for S-Transform. AEU Int J Elec Com 2008;62:939-945.
Figures