0237
Robustness of PSIR segmentation and R1 mapping at 7T: a travelling head study1Sir Peter Mansfield Imaging Centre, School of Physics and Astronomy, University of Nottingham, Nottingham, United Kingdom, 2Nuffield Department of Clinical Neurosciences, University of Oxford, Wellcome Centre for Integrative Neuroimaging (FMRIB), Oxford, United Kingdom, 3School of Psychology, Cardiff University, Cardiff University Brain Research Imaging Centre, Cardiff, United Kingdom, 4Department of Clinical Neurosciences, University of Cambridge, Wolfson Brain Imaging Centre, Cambridge, United Kingdom, 5University of Glasgow, Imaging Centre of Excellence, Glasgow, United Kingdom
Synopsis
Ultra-high magnetic field (7T) MRI scanners can provide high spatial resolution images and excellent contrast for classifying brain tissue, but robustness of tissue segmentation and R1 quantification across sites is key for the implementation of multi-site studies. Here, we present a subset of the main UK7T travelling-head study, focusing on harmonized T1-weighted images (0.7mm3 isotropic resolution) acquired on six subjects across three 7T sites, with five repeats at one site. The aim of this study is to assess the harmonisation and robustness of the MP2RAGE sequence and PSIR reconstruction across sites, by focusing on segmentation reproducibility and T1 estimation.
Introduction
Ultra-high magnetic field (7T) MRI scanners can provide high spatial resolution images and excellent contrast for classifying brain tissue, but robustness of tissue segmentation and R1 quantification across sites is key for the implementation of multi-site studies. Here, we present a subset of the main UK7T travelling-head study, focusing on harmonized T1-weighted images (0.7mm3 isotropic resolution) acquired on six subjects across three 7T sites, with five repeats at one site. The aim of this study is to assess the harmonisation and robustness of the MP2RAGE sequence and PSIR reconstruction across sites, by focusing on segmentation reproducibility and T1 estimation.Methods
Acquisition: The data used in this work was collected as part of the UK7T Network’s “travelling head study”. Six subjects (4 male, 74.0±9.1 kg, 33.8±6.2 years) underwent structural and functional neuroimaging scans at three of the five 7T-capable UK sites. Each subject was scanned at each site (Naway=3), and a further four times at their designated home site (Nhome=4, Ntotal=7 scans per subject included here). A standardised 3D-MP2RAGE acquisition was implemented on all sites using the following parameters: 0.7x0.7x0.7mm3 voxel size, FOV=224x224x157mm3, acceleration factor (A>>P) of 3 (GRAPPA/SENSE for Siemens/Philips systems), TR of 3500ms, echo spacing of 6.3ms[BW=300Hz], flip angles of 5/2˚ and inversion times (TI) of 725/2150ms for the first/second images. The acquisition time was 6min14s/7min51s (SENSE/GRAPPA). The same adiabatic inversion pulse(1) was successfully implemented on all sites.
Processing: Offline PSIR reconstruction(2) was carried out on all MP2RAGE data after uniform sensitivity Roemer coil combination(3) (offline on Siemens scanners).The MP2RAGE and PSIR reconstruction included a simple method to denoise non-tissue pixels(4). Additionally, the MP2RAGE data was segmented using Freesurfer(5) after inhomogeneity correction using spm12(6). After running the cross-sectional segmentation on individual visits independently, an unbiased within-subject template space was created from the three sites, before tissue classification was done via Freesurfer using the longitudinal stream(7). A look-up table (LUT) was numerically calculated using Bloch-simulations incorporating the exact sequence parameters to allow T1 estimation from the MP2RAGE signals, considering the individual B1 map and manual power calibration for each visit. The cortical thickness and cortical volume was compared using a 3-way analysis of variance (ANOVA), looking at the effect of sites, subjects and repeats on the individual subject segmentations. Additionally, Coefficients of Variation (CoV) and Intraclass Correlation Coefficients (ICC) were computed for each region outputted from the Desikan–Killiany–Tourville Atlas, and subsequently mapped onto an average surface for visualisation. Dice Similarity Coefficients (DSC) were also computed on the cortical ribbon segmentation, comparing the segmentation from the seven scans to the average subject space.
Results
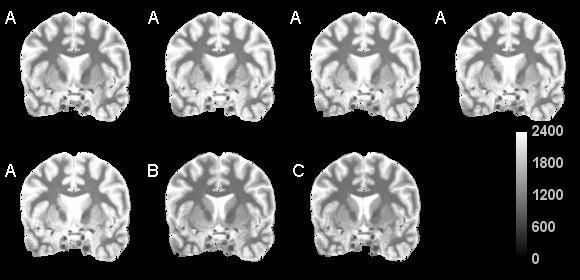
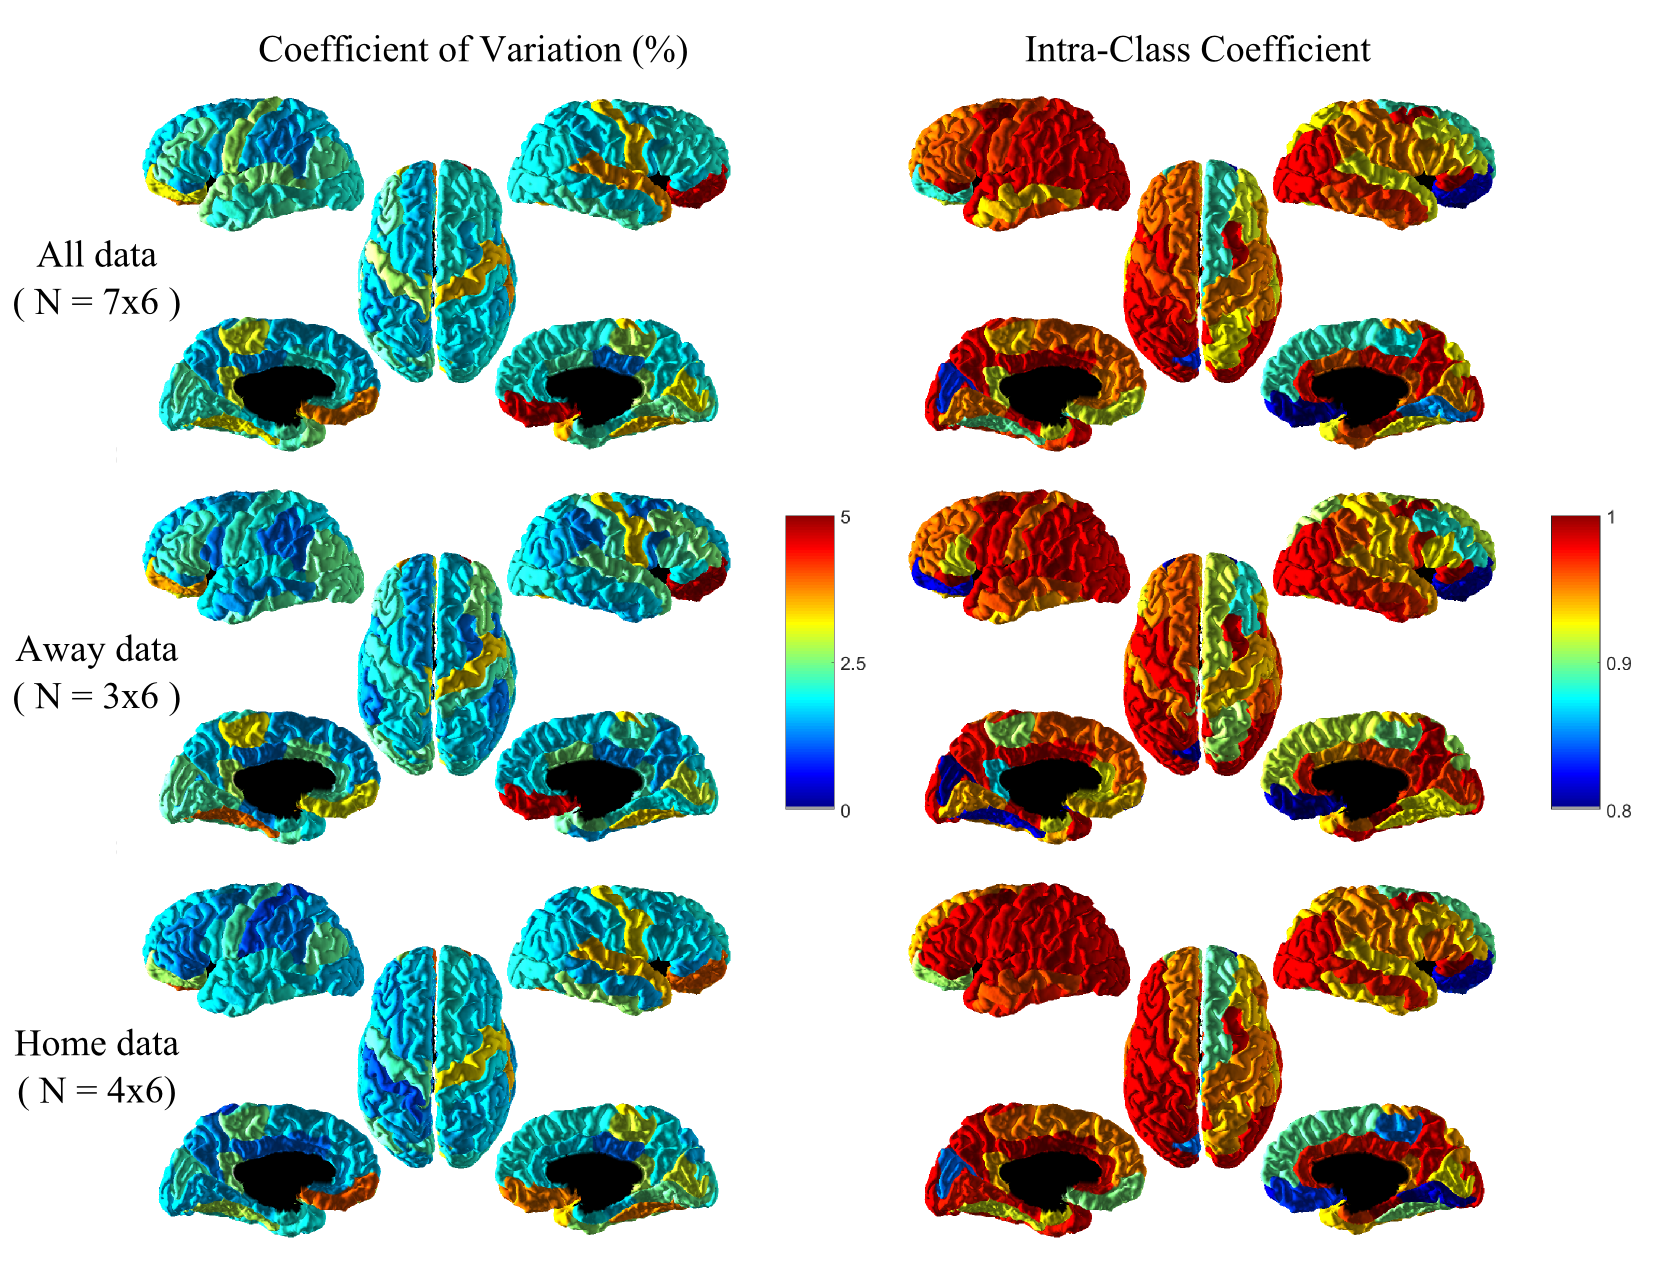
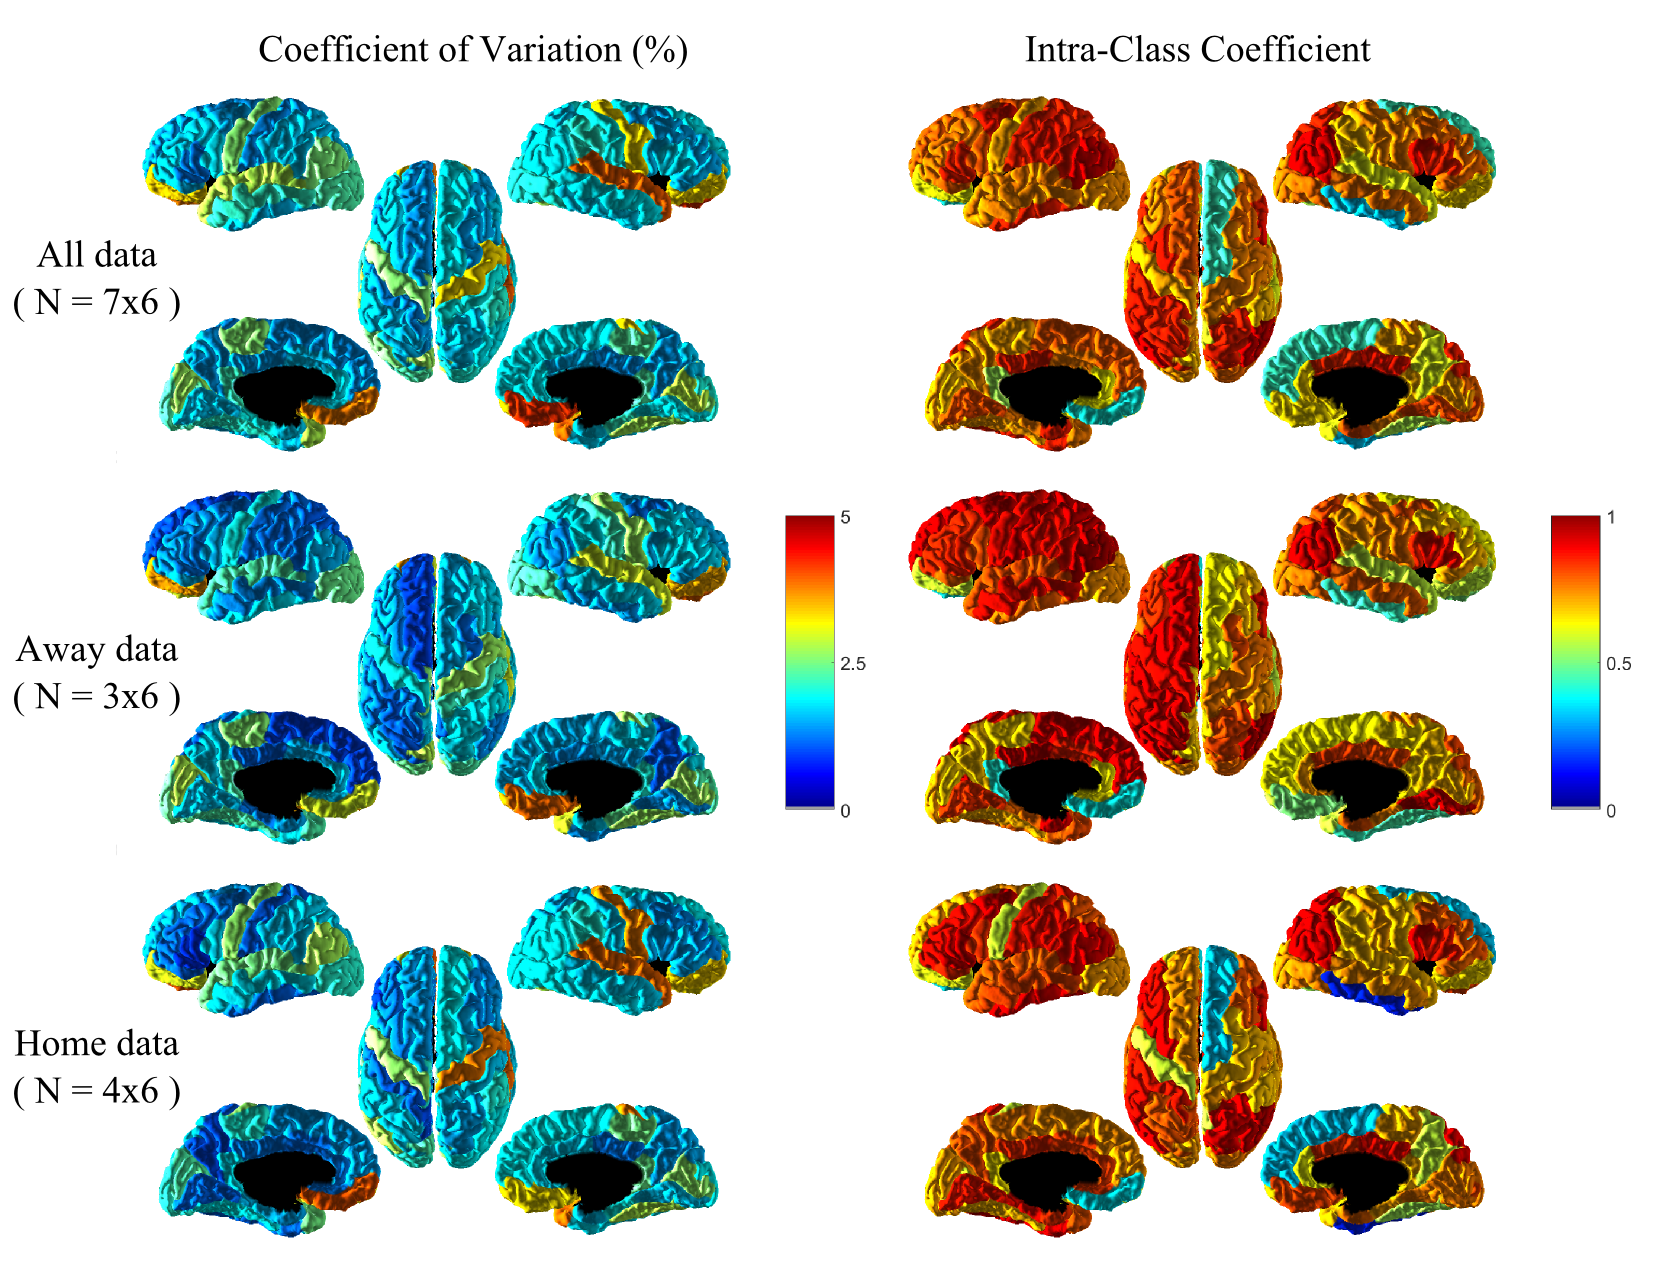
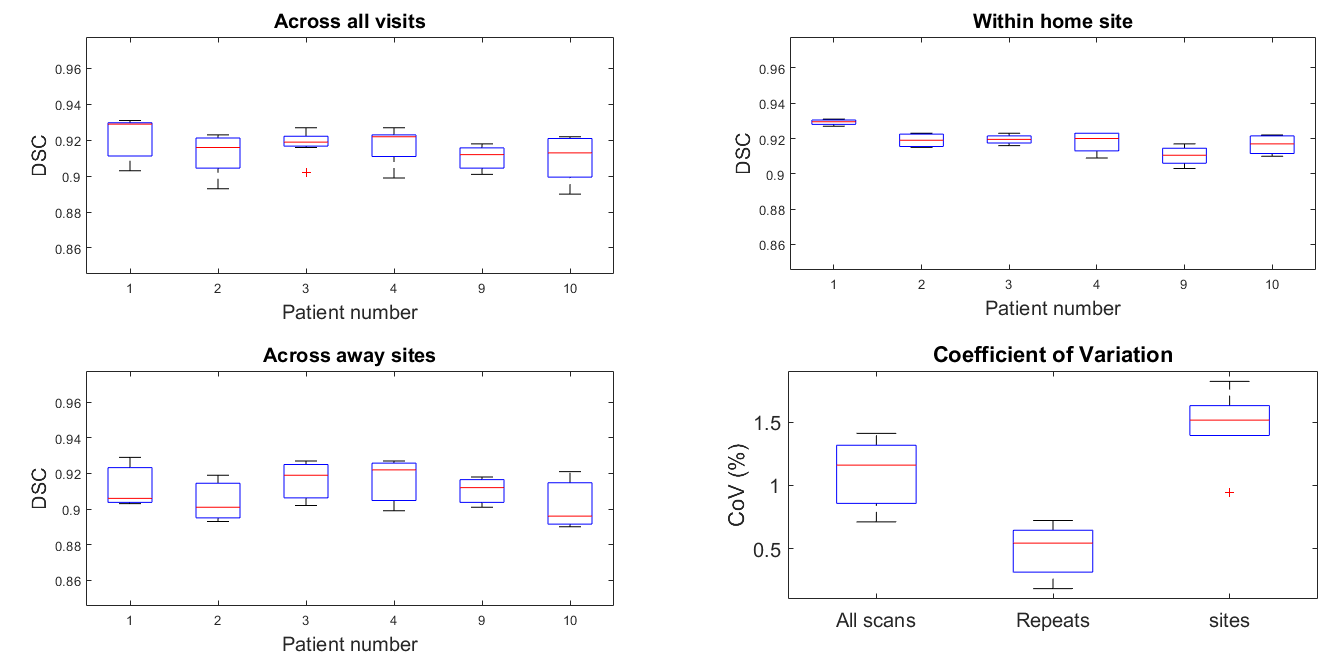
Images with similar quality and high contrast to noise ratio were produced at all sites and successful segmentation using Freesurfer was obtained on all data. Reproduceable T1 maps could also be produced (Figure 1) using the LUT (CoVhome=1.28, CoVaway=6.02). The cortical ribbon segmentation from Freesurfer was reproducible across sites, as no significant difference in brain cortical volume was present either between sites (p=0.62) or repeats (p=0.74), testing the null hypothesis on the sites, patients and repeats using a 3-way analysis of variance (ANOVA). This was also true when testing either the left cortical hemisphere volume (p=0.81 and p=0.51 respectively) or the right cortical hemisphere volume (p=0.19 and p=0.30 respectively). CoV and ICC were also mapped on an average subject for volume (Figure 2) and cortical thickness (Figure 3), showing good reproducibility when comparing all, away or home scans only. Apart from slightly higher variability in the cortical thickness and volume of the pre-central gyrus cortical area in particular, the reproducibility was very good, with little difference between home and away data, also visible with the DICE similarity coefficient (Figure 4).Discussion
Segmentation of MP2RAGE data using Freesurfer produced robust quantitative cortical thickness measurements across sites. Small cortical thickness variation is visible on Figure 3, which might be improved with the use of a better MP2RAGE brain extraction step. Measured T1 values were comparable across sites, but small residual variations due to B1 are still present. A LUT including B1 correction was implemented(9) to reduce variability in the measured T1, using B1 maps together with cross-site power normalization. Although DSC is comparable within sites (CoVhome=0.54) and across sites (CoVaway=1.51), part of the segmentation variability might still be explained by intrinsic registration errors present within the longitudinal Freesurfer stream.Conclusion
Good agreement in segmentation and cortical thickness, as well as in quantitative T1 measurements is reported for this travelling head study, as no significant difference was seen across sites, with expected higher reproducibility obtained within-site. Future work will include processing of the full dataset, including 10 subjects scanned over the 5 UK7T sites.Acknowledgements
We acknowledge the UK Medical Research Council for funding support (MR/N008537/1). CTR is funded by a Sir Henry Dale Fellowship from the Welcome Trust and the Royal Society [098436/Z/12/B].References
(1): Tailored RF pulse for magnetization inversion at ultrahigh field. Hurley AC, Al-Radaideh A, Bai L, Aickelin U, Coxon R, Glover P, Gowland PA. Magn Reson Med (2010) 63: 51–58.
(2): Imaging gray matter with concomitant null point imaging from the phase sensitive inversion recovery sequence. Mougin O, Abdel-Fahim R, Dineen R, Pitiot A, Evangelou N, Gowland PA. Magn Reson Med (2016) 76: 1512-1516.
(3): The NMR Phased Array. Roemer PB, Edelstein WA, Hayes CE, Souza SP, Mueller OM. Magn Reson Med (1990) 16: 192–225
(4): Robust T1-Weighted Structural Brain Imaging and Morphometry at 7T Using MP2RAGE. PLoS One (2014) 9(6): e99676
(5): Cortical surface-based analysis. I. Segmentation and surface reconstruction. Dale AM, Fischl B, Sereno MI, Neuroimage (1999) 9, 179-194. (http://surfer.nmr.mgh.harvard.edu/)
(6): SPM 12: http://www.fil.ion.ucl.ac.uk/spm/software/spm12/
(7): Within-Subject Template Estimation for Unbiased Longitudinal Image Analysis. Reuter, M., Schmansky, N.J., Rosas, H.D., Fischl, B. Neuroimage (2012) 61 (4), 1402-1418.
(8): New Developments and Applications of the MP2RAGE Sequence - Focusing the Contrast and High Spatial Resolution R1 Mapping. Marques J, Gruetter R. PLoS ONE8(7): e69294.
Figures