0236
In-vivo diffusion-fMRI using Incomplete Initial Nutation Diffusion Imaging (INDI)1Champalimaud Research, Champalimaud Centre for the Unkown, Lisbon, Portugal, 2Champalimaud Research, Champalimaud Centre for the Unknown, Lisbon, Portugal
Synopsis
Diffusion functional-MRI (dfMRI) is thought to capture microstructural changes associated with neural activity. The water apparent diffusion coefficient decrease observed upon neuronal activity is hypothesized to be cell-swelling dependent. Yet, one of the confounding factors for dfMRI is that zero and nonzero b-values need to be acquired to deliver accurate changes in diffusivity and those images are typically separated by at least one repetition time. Incomplete initial Nutation Diffusion Imaging (INDI) was proposed as a method to acquire two images with different diffusion-weighting with separation of <50ms. Here, we performed INDI-fMRI experiments to report mean diffusivity changes using forepaw-stimulated rats.
Introduction
Diffusion functional-MRI (dfMRI) has been proposed as a non-BOLD method to map neural activity through a mechanism independent of the neurovascular-coupling1-3. However, to fully assess the mechanisms underlying dfMRI, a method that decouples T2 from diffusion effects is required. To date, dfMRI studies aiming to map changes in the diffusion coefficient with activity were mainly performed by interleaving zero and nonzero b-value acquisitions1,2. As T2 effects occur on scales of TR, the BOLD/non-BOLD effects might be intermixed. Here, we propose the use of Incomplete Initial Nutation Diffusion Imaging (INDI)4 to acquire two images with different diffusion-weighting interleaved by <50ms and to report mean diffusivity (MD) changes in the forelimb somatosensory cortex upon forepaw stimulation in rats.Methods
Animal preparation: All experiments were preapproved by the local animal ethics committee operating under local and EU laws. Long Evan rats, 8-10 weeks old (n=11), were induced into deep anesthesia with 5% isoflurane and maintained under 2.5% isoflurane while two needles were inserted into the left forepaw’s digits 1-2 and 4-5. Animals were then switched to medetomidine sedation (bolus: 0.05mg/kg, constant infusion: 0.1mg/kg/h).
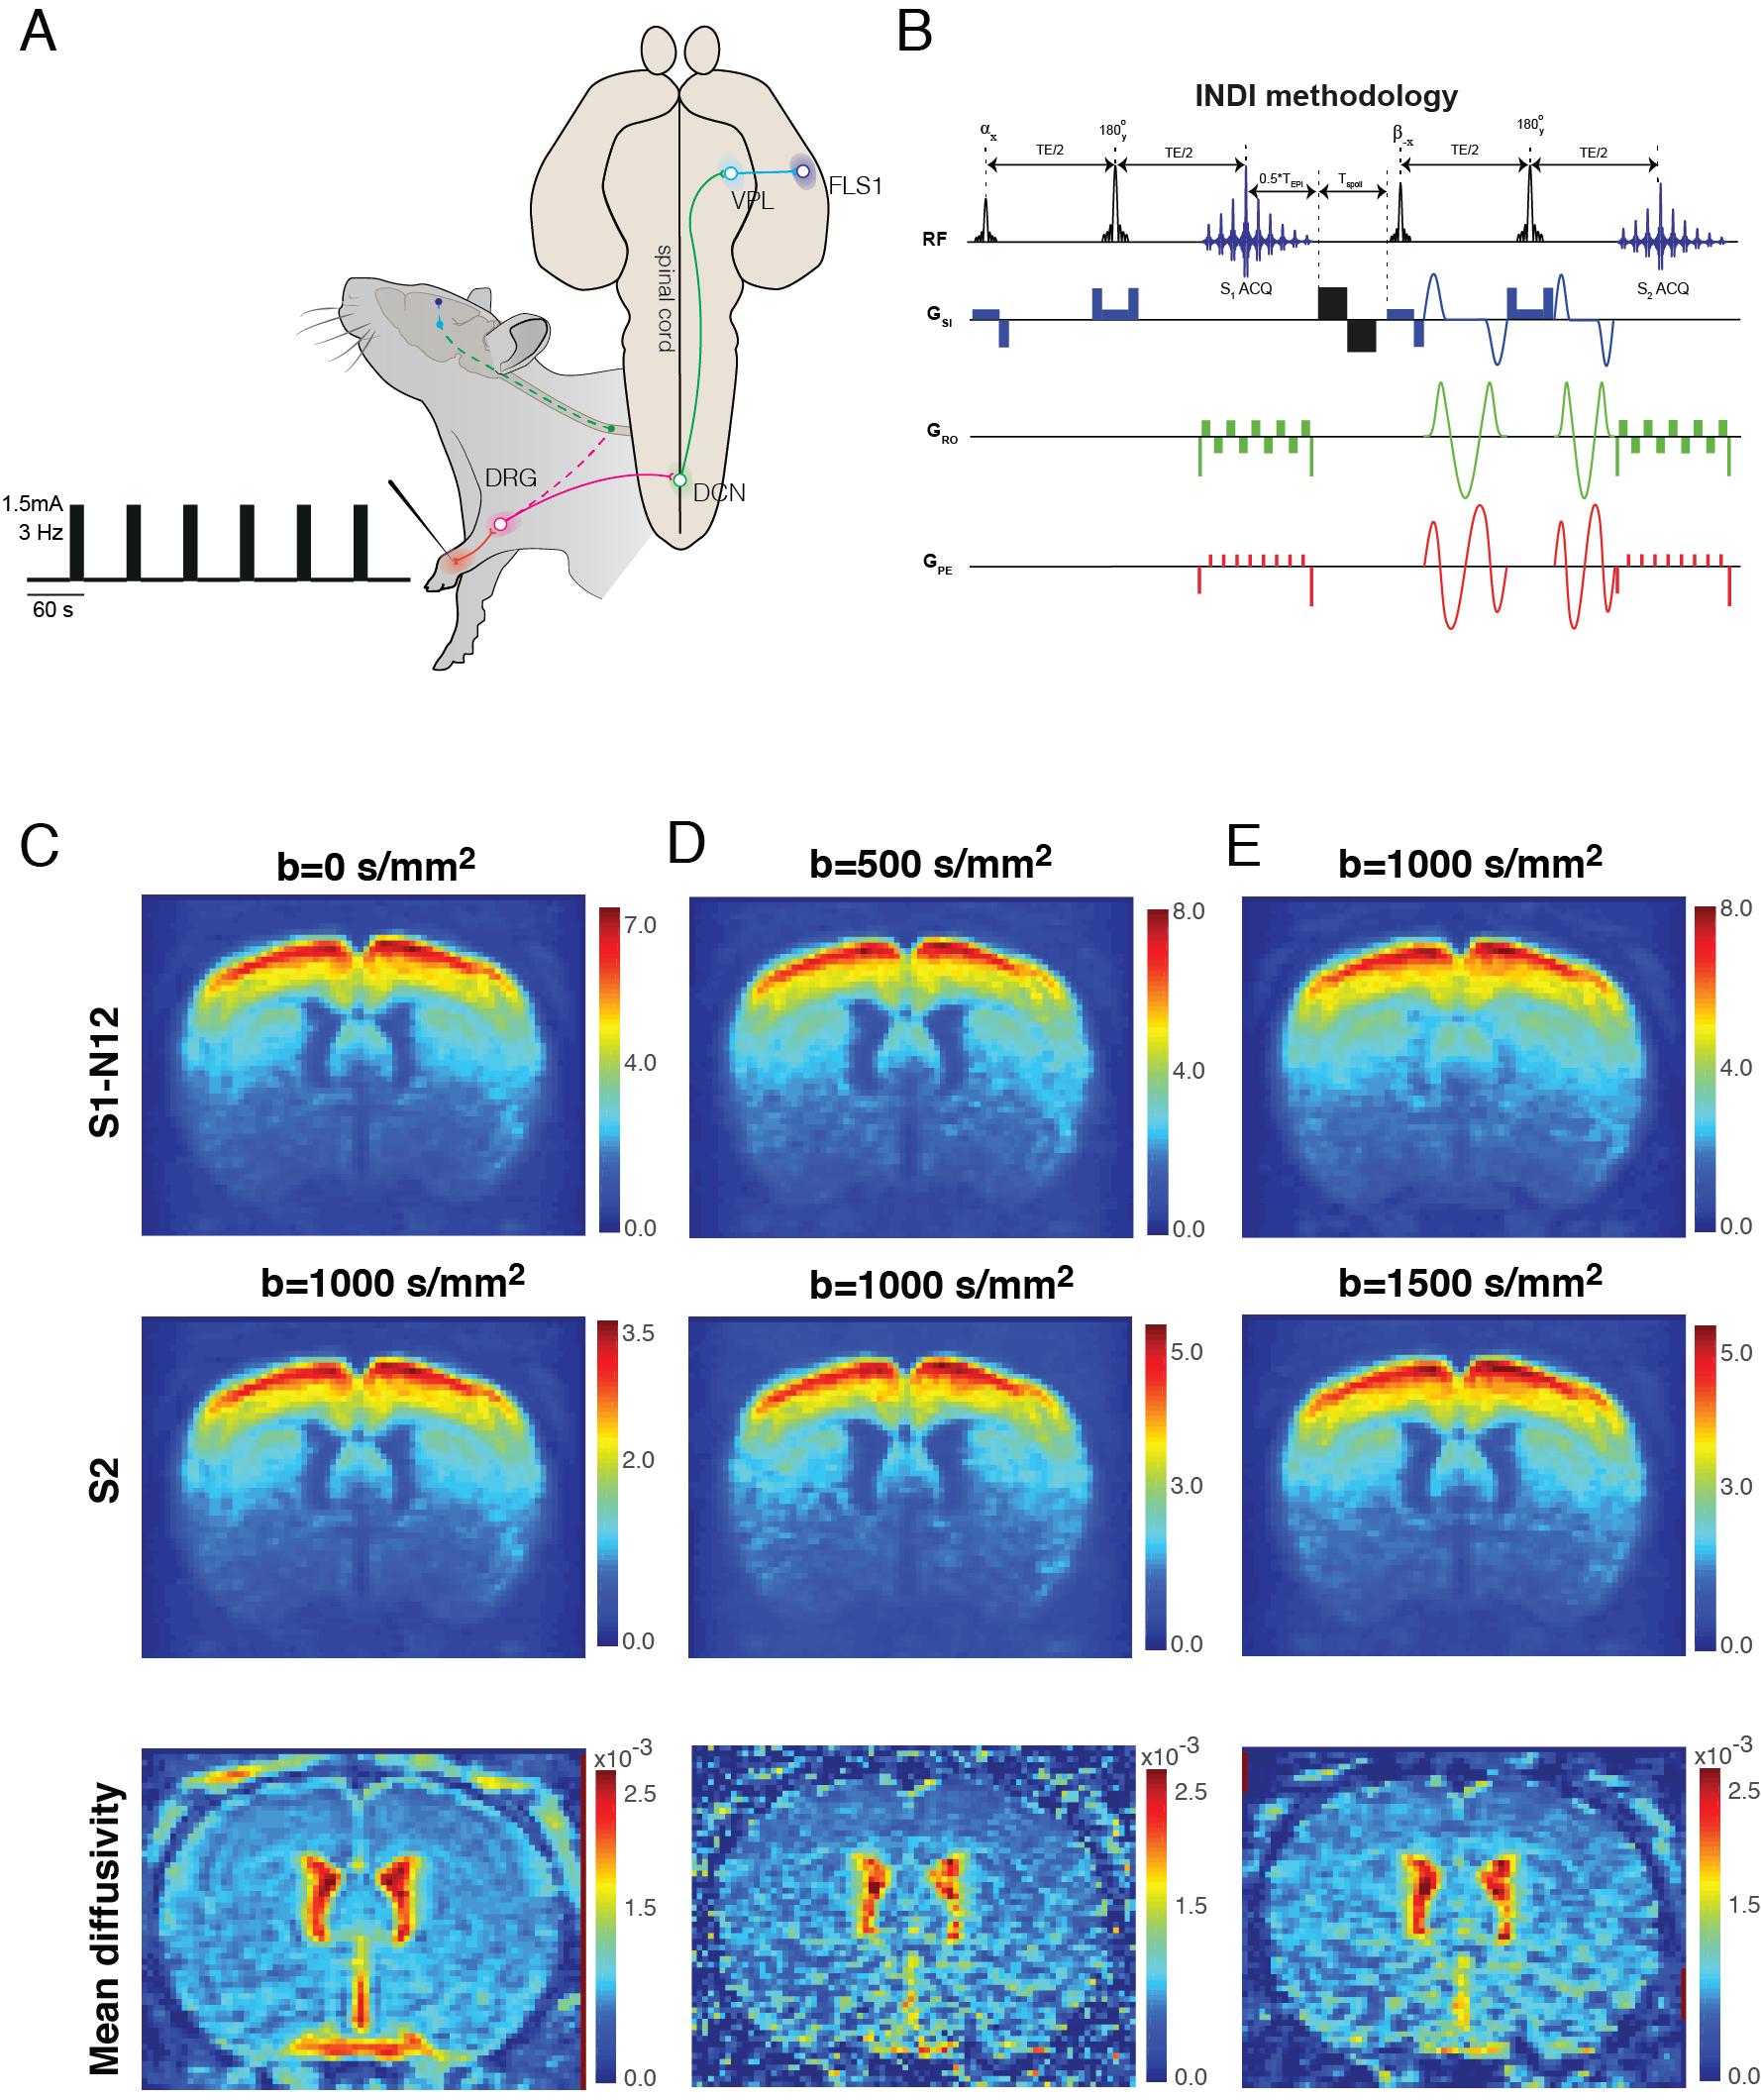
Stimulation paradigm: Following 45 seconds of rest, electrical pulses were delivered to the forepaw with a square waveform comprising 1.5mA, 10Hz and 3ms stimulus duration, for 15 seconds followed by 45 seconds of rest for a total of 6 stimulation periods (Figure 1A).
Functional Imaging:All experiments were performed using a 9.4T Bruker BioSpec scanner equipped with a gradient system producing up to 660 mT/m isotropically. An 86 mm quadrature resonator was used for transmittance, while a 4-element cryoprobe was used for reception. Four coronal slices of interest were scanned between +1.68 and -4.36 mm from bregma. The INDI sequence4 (Figure 1B) was applied in fMRI mode using the following parameters: TR/TE=1500/40 ms, FOV=15.6 x 12.0 mm, matrix size of 78x60, partial Fourier 1.33, interpolation in read direction 1.05, slice thickness 1.5 mm, in-plane resolution 200µmx200µm). Pairs of images were acquired with b value pairs of: [0,1000], [500,1000], [1000,1500] and Δ/δ = 19.5/14.2 ms, b tensor [zeta,theta,phi] = [54.7,0,0] deg, respectively.
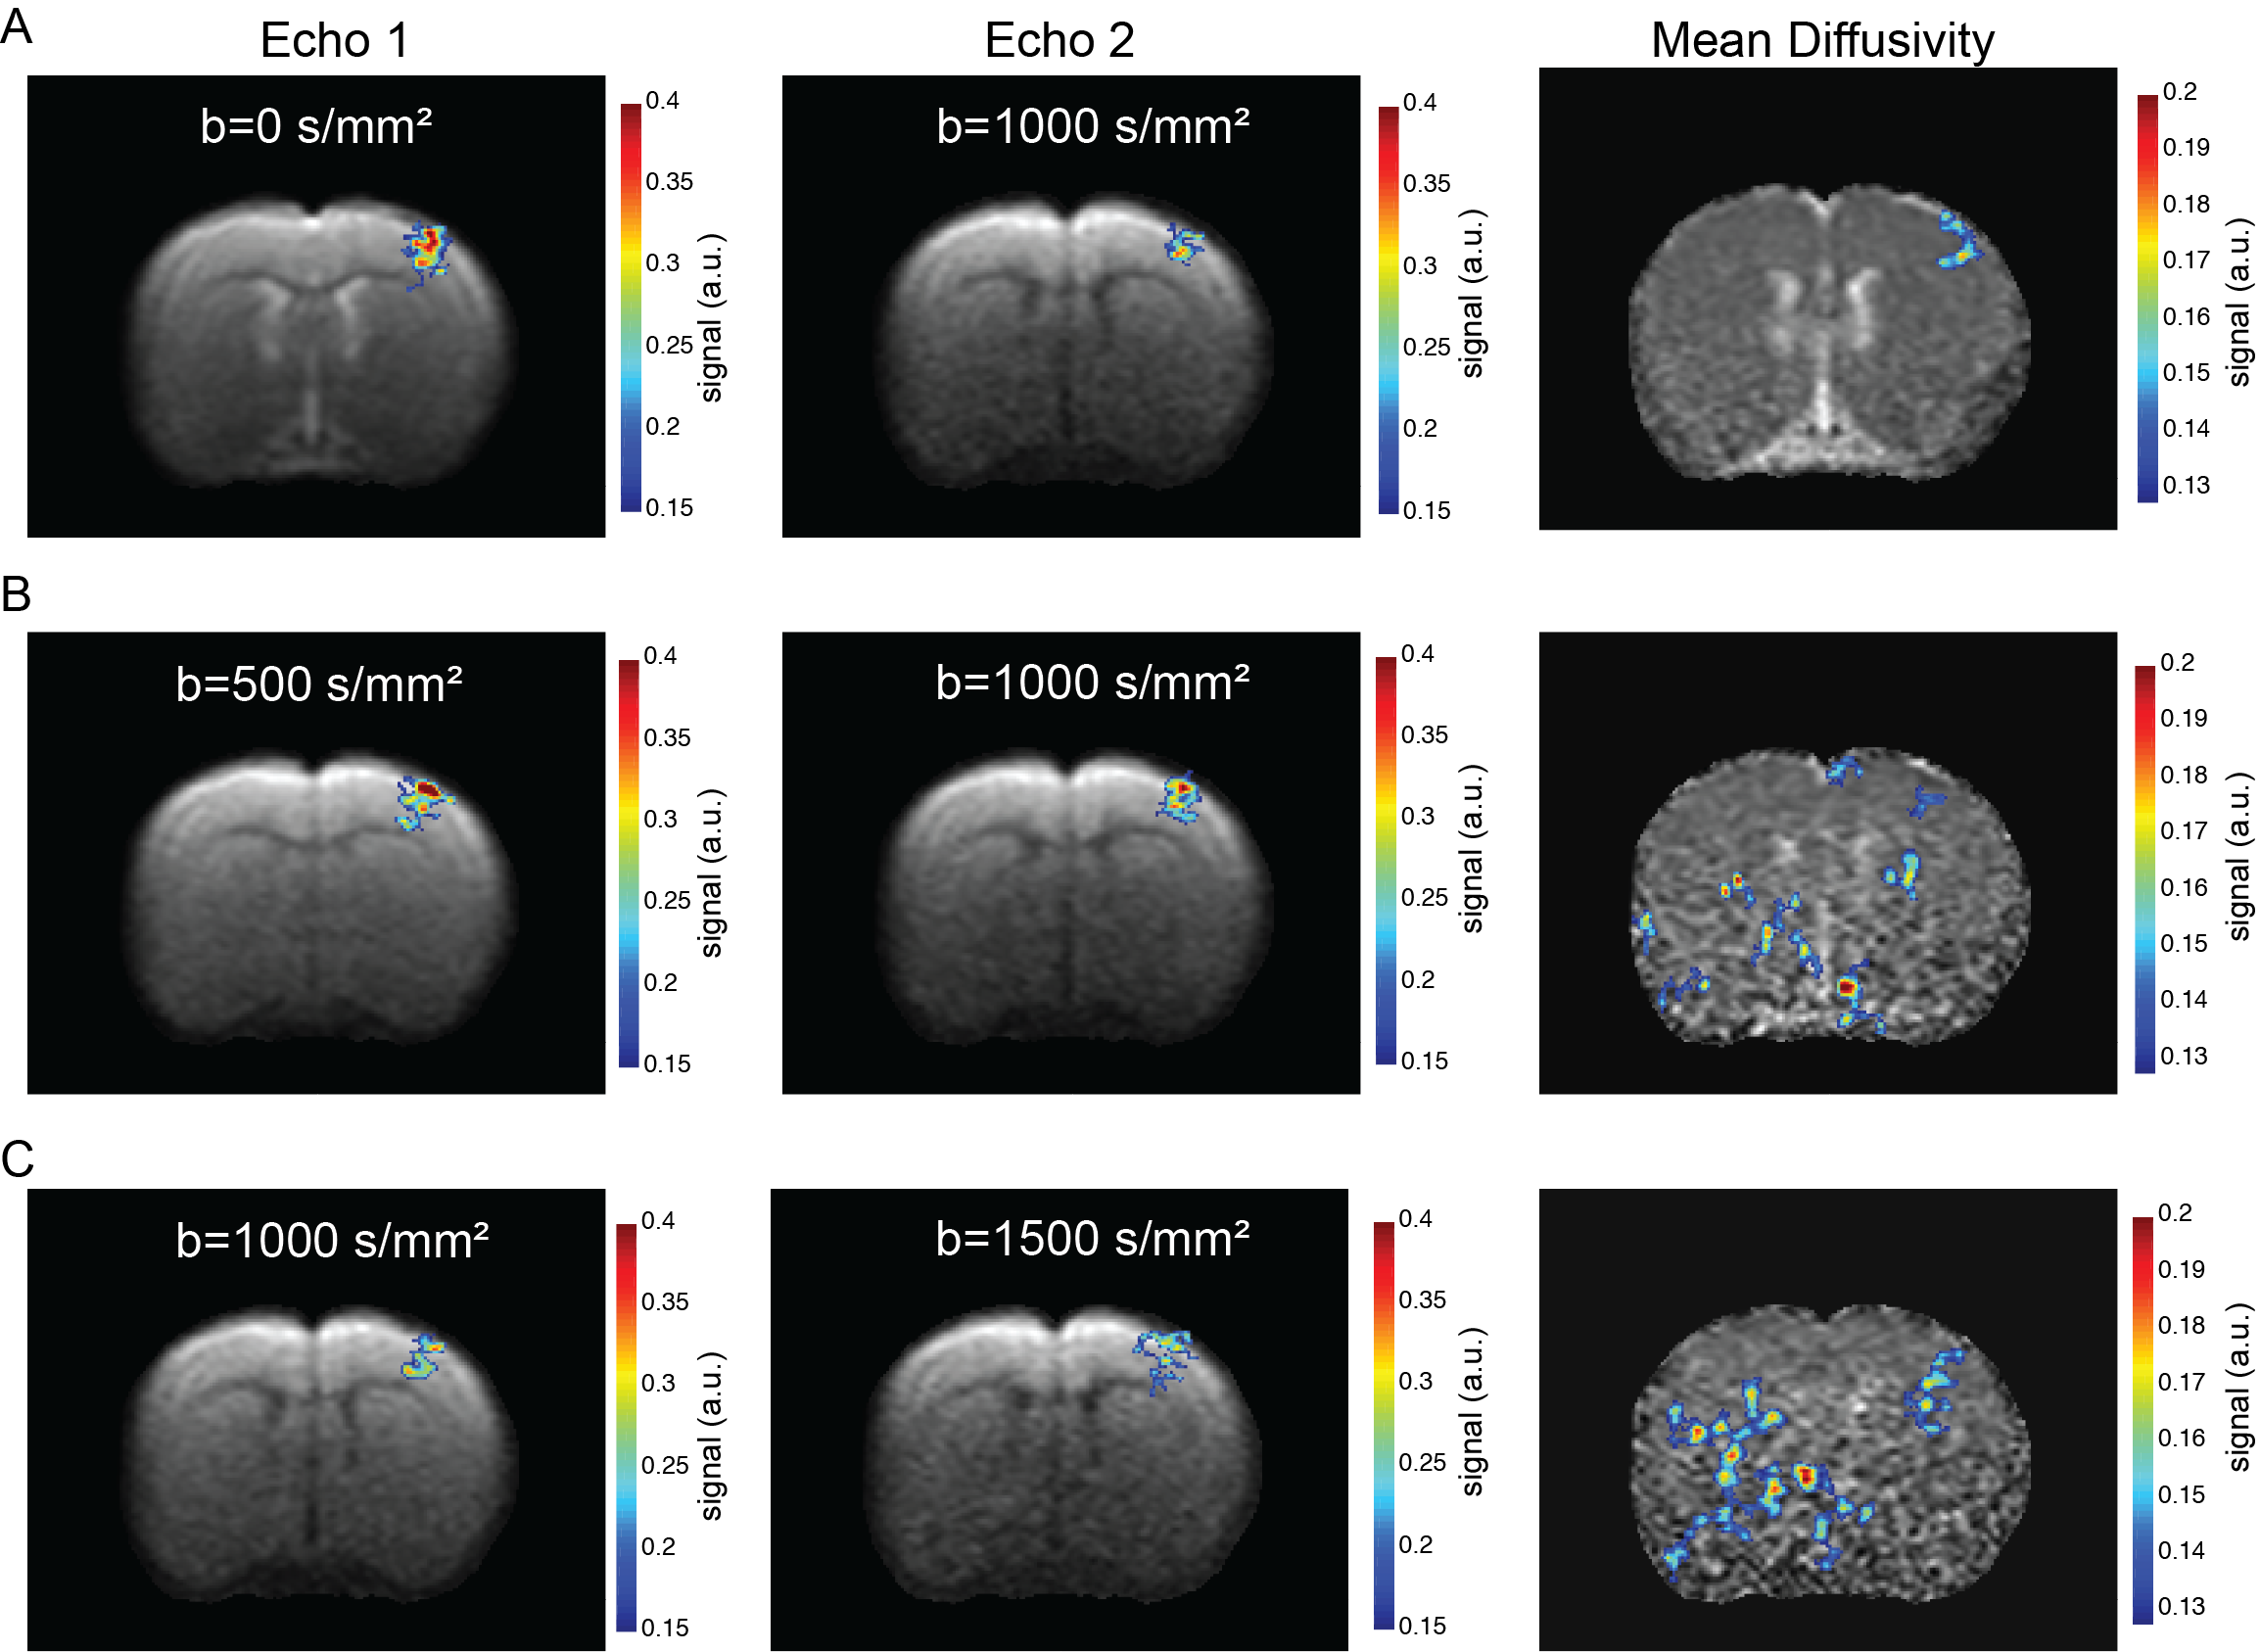
Data analysis:Images were spatially realigned using SPM in Matlab (The Mathworks, Nattick, USA). Then, regions of interest (ROIs) were drawn in the forelimb primary somatosensory cortex (layer IV). Mean±standard error of the mean signals were extracted and drift-corrected. The average temporal evolution was calculated by averaging all stimulation epochs from all animals. Activation maps were calculated by performing spectral analysis, based on Fourier and harmonics analyses5. Functional maps of the MD data was smoothed using a gaussian filter with a kernel of 0.4x0.4mm2. All anatomical information was inferred from the Paxinos&Watson rat brain atlas6.
Results and Discussion
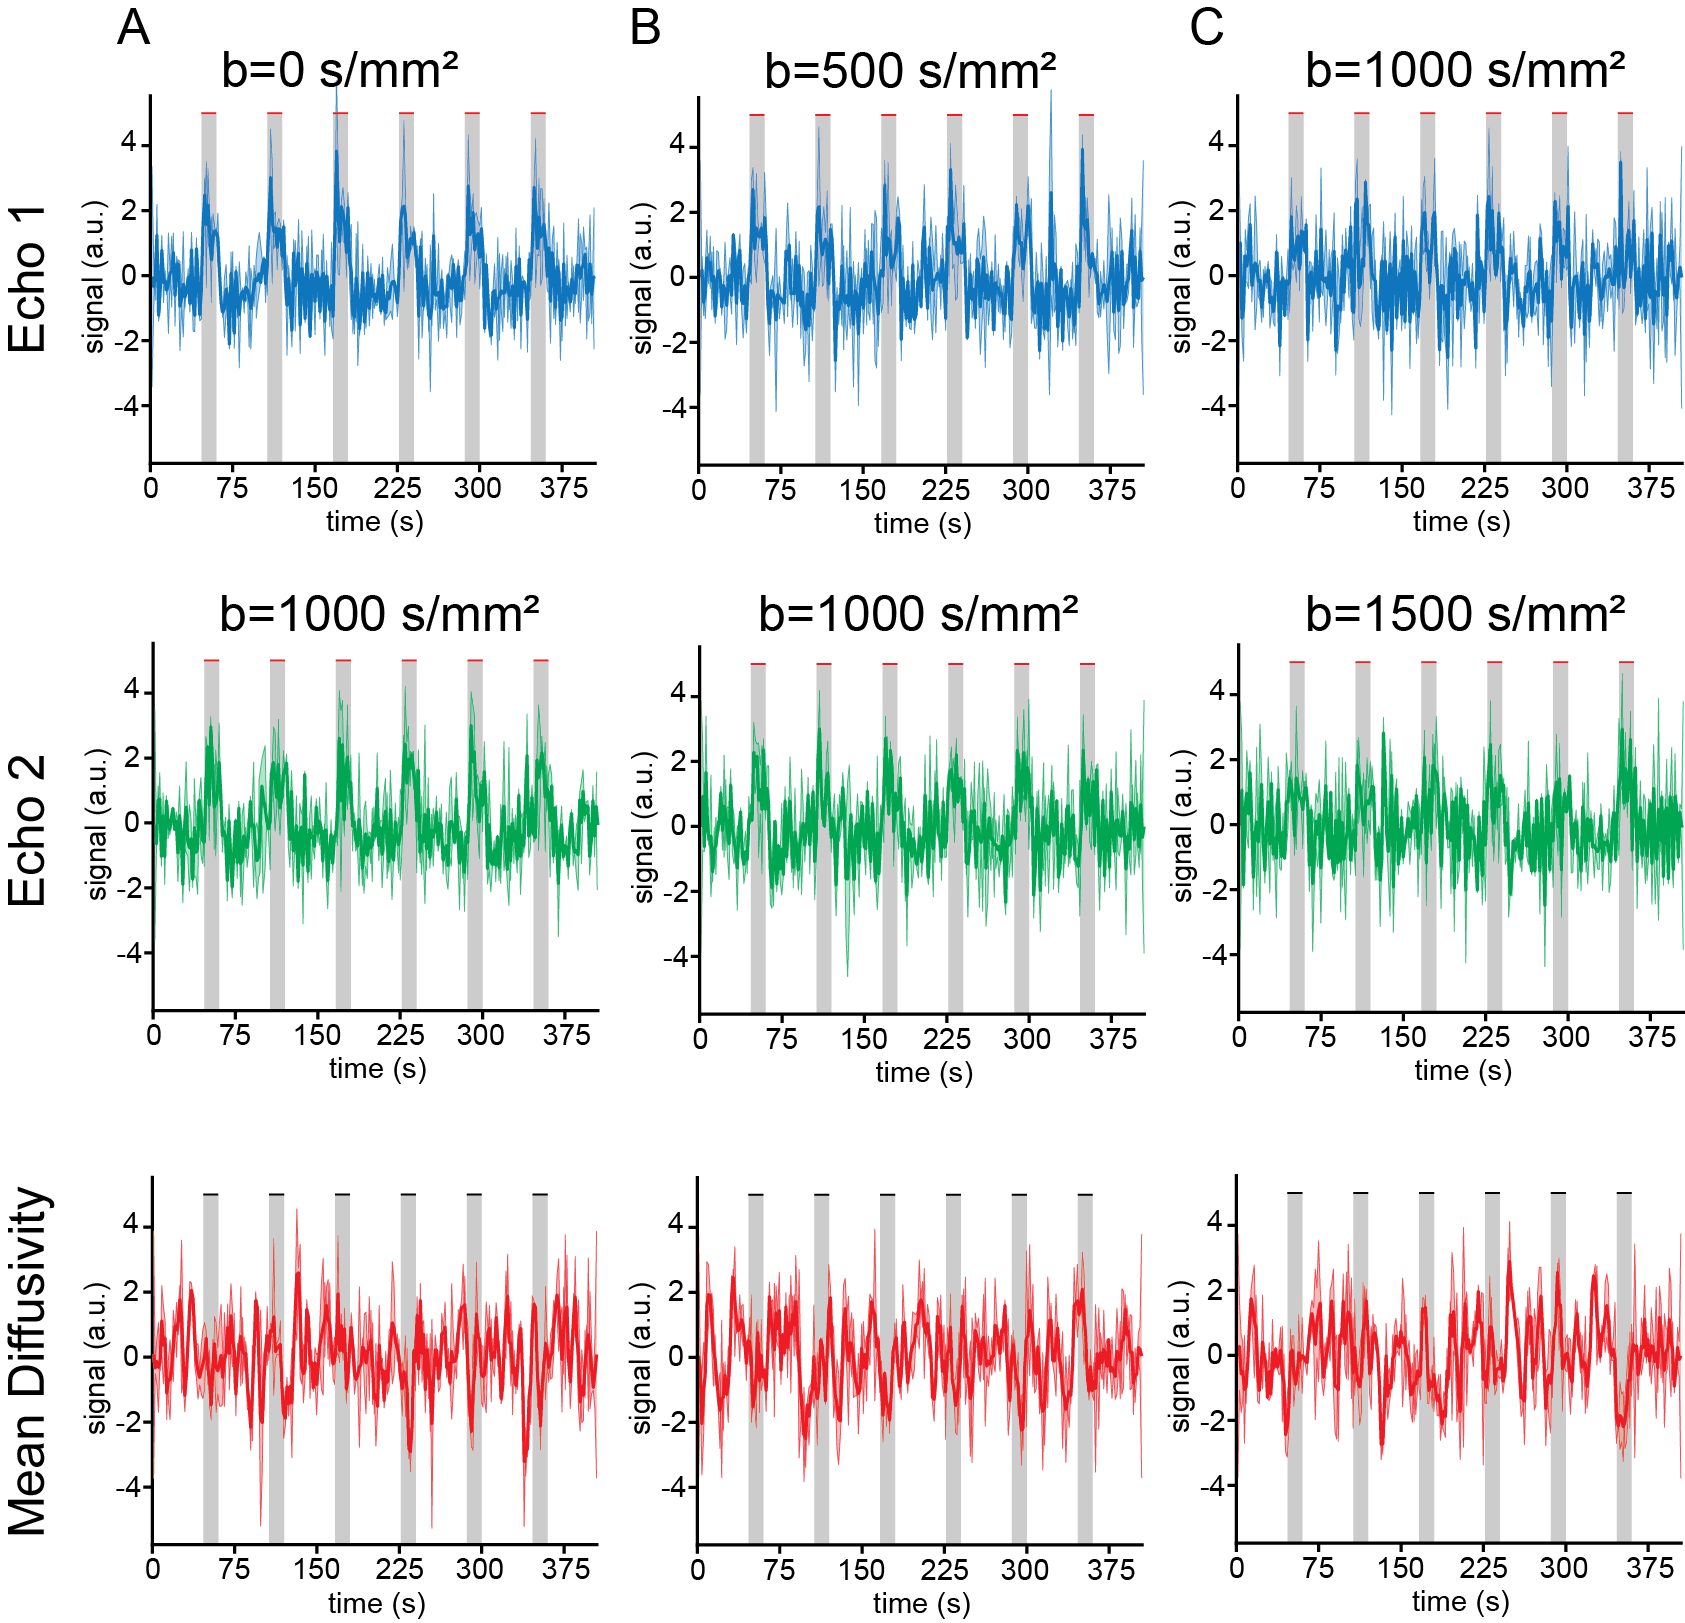
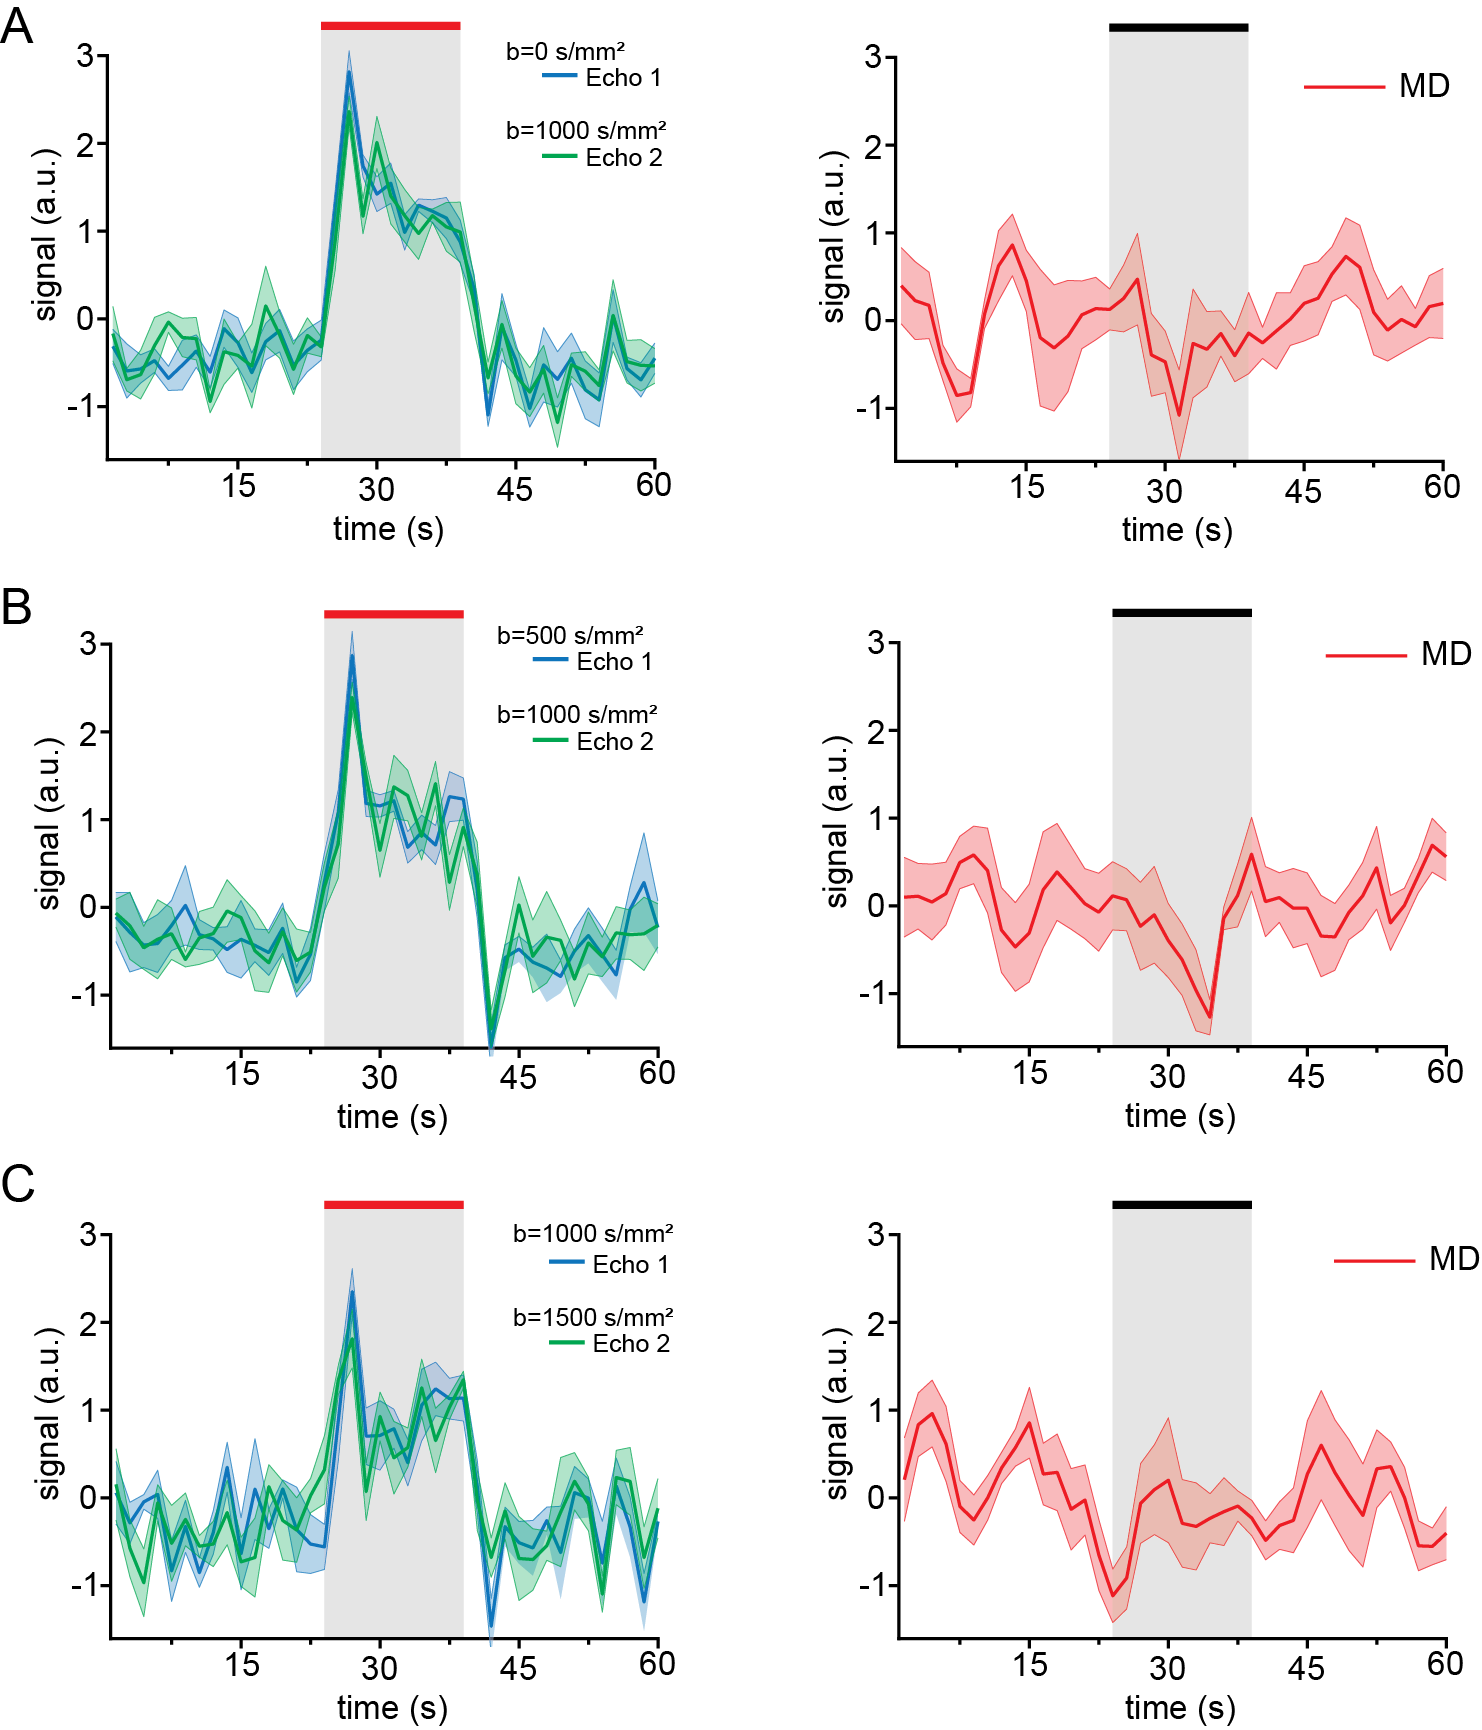
Raw data from a representative rat in the INDI-fMRI experiments are shown in Figure 1C-E. Despite that zero/nonzero b-values were acquired within ~50 ms, the signals remain within acceptable signal to noise ratio (SNR). The ROI analysis averaging the INDI-fMRI time series from all animals (Figure 2) in cortical layer IV showed significant responses in all b-values upon forepaw stimulation, whether originating from INDI’s S1 or S2 (i.e., the first or the second INDI echoes). Yet, the MD changes were difficult to observe in the full temporal evolution trace (Figure2). Therefore, data was averaged for all animals and all stimulations epochs (Figure 3), where changes of MD became evident. To map the areas of activation from each b-value in a data-driven fashion and without assuming any a-priori response function5, Fourier analysis was performed (Figure 4). Zero b-value images clearly show T2-BOLD contrast while the higher b-value images reveal more focal patterns, as already reported1,5. To avoid filtering large vessels at different b-values, INDI-fMRI experiments were also performed using nonzero b-values in the first echo as well. Indeed, the ensuing INDI-S1 and INDI-S2 patterns are much more similar, suggesting that b=0 images are dominated by vascular components, while higher b-value images have a non-BOLD contribution. The calculated quantitative MD maps4 show activation of the forelimb primary somatosensory cortex region, though only the b value pair [0-1000] is specific for that region, while the other b-value pairs entail activated regions not reported for this paradigm1,5,7. Yet, the MD raw data (as presented here) might be improved by denoising8 and correct filtering.Conclusion
To our knowledge, this is the first study to employ INDI 4-fMRI for mapping MD based on INDI-fMRI signals. The <50 ms separation of two b-values is favorable for mapping changes in diffusivity without bias due to TR interleaving. Yet, this technique requires improvements in the analysis of the raw data.Acknowledgements
This study was supported by funding from the European Research Council (ERC) under the European Union’s Horizon 2020 research and innovation programme (Starting Grant, agreement No. 679058).References
1. Tsurugizawa T, Ciobanu L, Le Bihan D. Water diffusion in brain cortex closely tracks underlying neuronal activity. Proc Natl Acad Sci U S A. 2013;110(28):11636-11641.
2. Abe Y, Tsurugizawa T, Le Bihan D. Water diffusion closely reveals neural activity status in rat brain loci affected by anesthesia. PLoS Biol. 2017;15(4):e2001494.
3. Jasanoff A. Bloodless FMRI. Trends Neurosci. 2007;30(11):603-610.
4. Ianus A, Shemesh N. Incomplete initial nutation diffusion imaging: An ultrafast, single-scan approach for diffusion mapping. Magn Reson Med. 2017.
5. Nunes D, Ianus A, Shemesh N. Layer-specific connectivity revealed by diffusion-weighted functional MRI in the rat thalamocortical pathway. Neuroimage.2018;184:646-657.
6. C.Watson GP. The Rat Brain in stereotaxic coordinates.7th edition ed: Academic Press; 2014.
7. Van Camp N, Verhoye M, Van der Linden A. Stimulation of the rat somatosensory cortex at different frequencies and pulse widths. NMR Biomed.2006;19(1):10-17.
8. Veraart J, Fieremans E, Novikov DS. Diffusion MRI noise mapping using random matrix theory. Magn Reson Med. 2016;76(5):1582-1593.
Figures