0235
ZEBRA – from rich-multi-dimensional data to anatomical profiles1Biomedical Engineering Department, School of Biomedical Engineering and Imaging Sciences, King's College London, London, United Kingdom, 2Centre for the Developing Brain, School of Biomedical Engineering and Imaging Sciences, King's College London, London, United Kingdom, 3University College London, London, United Kingdom
Synopsis
An efficient joint multi-parametric diffusion-relaxometry MRI acquisition, ZEBRA, is presented. Improvements to optimize the joint sampling in several dimensions include logarithmic TI sampling, superblock strategies and globally and locally optimized gradient schemes. These are introduced together with a proposed whole-brain protocol (resolution 2.5mm isotropic). The data is analysed by an assumption free clustering step – designed to extract tissue information and anatomical profiles directly from the signal. Depiction of several clusters – including the deep grey matter and cerebellar substructures - illustrate the richness of the obtained data.
Introduction
Combined diffusion-relaxometry techniques offer novel opportunities to investigate both tissue microstructure and tissue composition simultaneously. Emerging multi-parametric models call for more and more data sampled in a multi-dimensional parameter space1-3. However, current state-of-the art acquisitions are struggling to combine diffusion with relaxometry contrasts in reasonable imaging times. This is in part due to the separate preparation periods for different inversion times (TI) and echo times (TE). We recently showed that interleaving all dimensions by changing diffusion encoding and inversion time per slice location/shot creates a more efficient acquisition and offers novel freedom in sampling choice4. The resulting higher dimensional data is ideally suited for methods extracting the information content directly from signal properties without inferring anatomy or model specific information to anatomical profiles. We now present further progress towards making best use of the gained flexibility to achieve optimally efficient sampling across all dependant dimensions. This is illustrated on a proposed acquisition protocol - sampling 896 unique contrasts with full brain coverage at an isotropic resolution of 2.5mm in 31 min. The acquisition is complemented with a cluster analysis focused on information extraction.Methods
The most efficient sampling of TI and b maximizes information content in every shell while maintaining good local angular distribution evenly distributed in TI. This was achieved in three steps (Fig.1). The multi-echo structure (Spin-Echo followed by multiple Gradient-Echos) of ZEBRA allows efficient acquisition of all echo times, in-plane acceleration techniques allow reduction of the inter-echo spacing. These choices result in a semi-oblique lattice in the b-TI plane and a regular grid in the b-TE plane (Fig. 2a).
Superblock structure: ZEBRA uses a superblock structure to pack two degrees of freedom: The superblock length Ni, defining the number of encodings sampled along a single recovery curve and the mapping of these samples to individual b shells. The number of slices (Ns) and desired number of TIs per sample (Nti) defines the superblock length (Ni) as Ni=Ns/Nti. The total number of diffusion encodings (Nd) then defines the number of superblocks (N) as N=Nd/Ni (Fig.2b).
Angular resolution: Efficient mapping from these Ni samples to shells is achieved by defining Ni shell groups which are then maximally spread to increase the information content per shell while also achieving uniform angular coverage for individual TIs. Maximising electrostatic repulsion is used to both design angular direction schedules within shells and the way shells are split into subsets (in this case 4) (Fig. 2c).
Optimized TI sampling: Vendor-available choices for sampling of the Ns available TIs are equally spaced in time, either minimal spacing (the shot length defines the spacing), or maximal spacing (TR/Ns defines the spacing). However, both lead to suboptimal spacing for sampling exponential magnetization recovery, which requires logarithmic sampling in time. This has now been implemented and is controlled using a target T1 value (T1opt). The data was MB-reconstructed5-7 and denoised8. Finally, for the initial analysis presented here, a spherical harmonics fit (order l=0) was performed in the individual shell groups to obtain rotationally invariant signal components. To explore the resulting high-dimensional data, we used two methods: k-means clustering across signal components (forcing a hard parcellation of tissue based on voxelwise signal profiles) as well as Principal-Component-Analysis (PCA), providing an analysis of the modes of variation.
Results and Discussion:
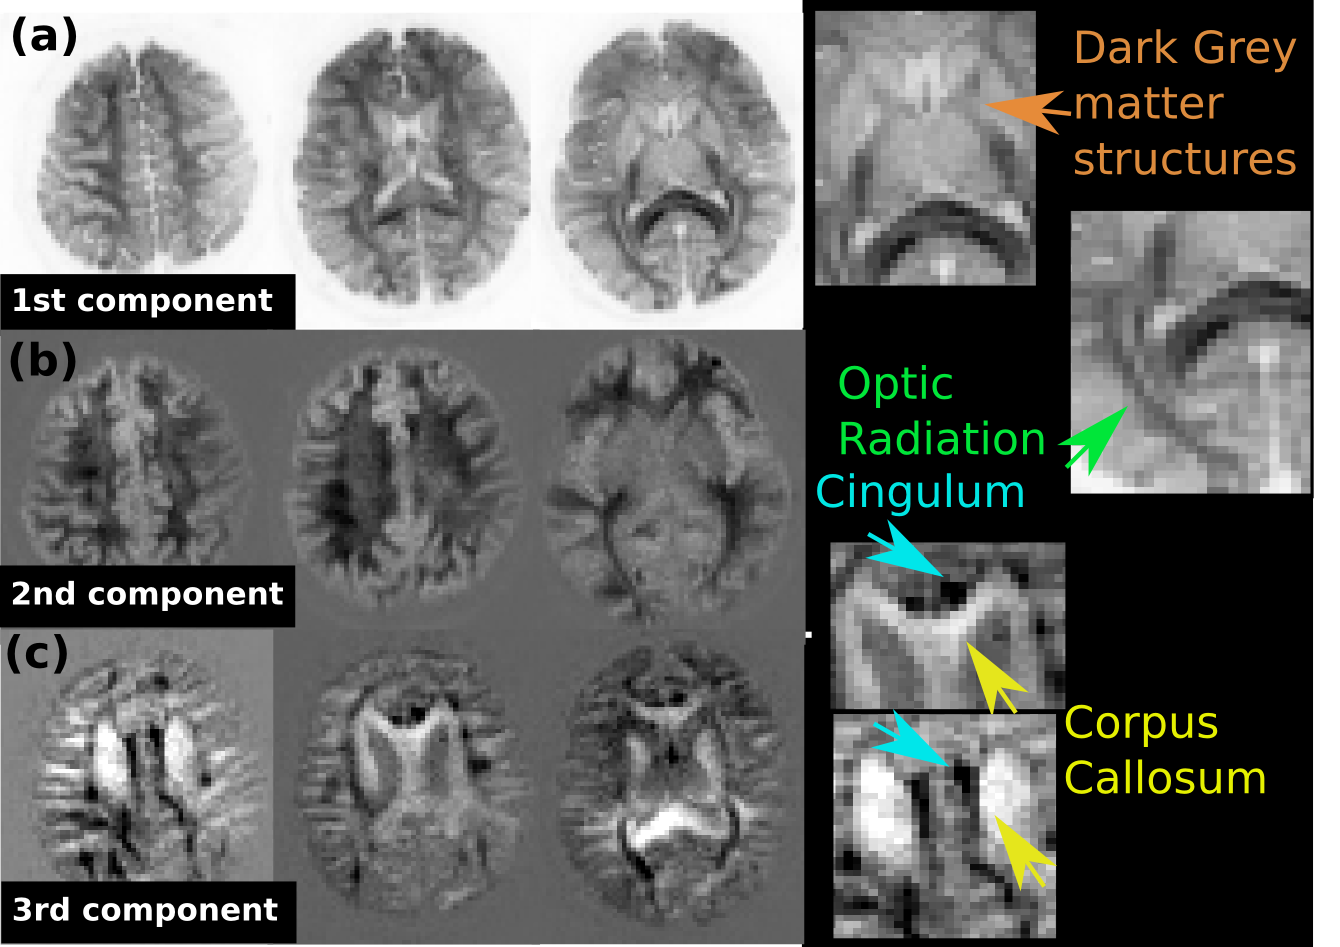
Full brain coverage with 896 volumes, each sampling a unique combination of b-value, b-vector, TI and TE (5-dimensional parameter space) was obtained in 31 minutes on each of three adult volunteers. Imaging parameters were: MB=2,SENSE=2, halfscan=0.7, FOV=200x220x140mm2, TR/TE=8000/[80,102,126,148]ms, Ns=56 slices, resolution (2.5mm)3. ZEBRA parameters were Ni=7, Nti=4 and T1opt=1500ms, Nd=224, b=0,2000,3000. The increased variety in signal introduced from logarithmic sampling compared to uniform sampling in time is illustrated in Fig. 3b. Quantitative evaluation using the Cramer-Rao-Lower-Bound estimation for 4 target T1s showed a clear decrease in parameter estimation variation for the proposed logarithmic schemes (Fig. 3c). The 6 depicted k-means clusters (Fig.4a-c) identified sub-regions within anatomical structures with clearly different signal signatures (signal over all parameter combinations). The spatial clusters identify cerebellar and deep grey matter substructures in a single-subject analysis. Separation of e.g. the cingulum and the corpus collosum (Fig. 5, PCA analysis results) is in line with previous T1-diffusion results1.Conclusion
Optimized sampling strategies for efficient and information-rich combined T2*-T1-diffusion acquisitions using ZEBRA were shown. An exploratory model-free analysis, aiming to leverage the high-dimensional signal to separate sub-brain regions complements this approach. However, the presented ZEBRA data is ideally suited to modelling approaches aimed at obtaining quantitative microstructural information. The high rate of data capture in this optimized acquisition, yielding 896 unique contrasts in 31 minutes on a clinical scanner, paves the way for future multi-parametric studies in both research and clinical settings.Acknowledgements
This work was supported by the NIH Human Placenta Project grant 1U01HD087202-01 (Placenta Imaging Project (PIP)), the Wellcome Trust (Sir Henry Wellcome Fellowship, 201374/Z/16/Z), and the EPSRC (grants N018702 and M020533) and by the National Institute for Health Research (NIHR) Biomedical Research Centre based at Guy’s and St Thomas’ NHS Foundation Trust and King’s College London. The views expressed are those of the authors and not necessarily those of the NHS, the NIHR or the Department of Health.References
1 DeSantis, Neuroimage 2016
2 Veraart, Neuroimage 2017
3 Benjamini, MRM 2016
4 Hutter, SciRep 2018
5 Price, ISMRM Workshop 2015
6 Setsompop, MRM 2012
7 Zhu IEEE Trans Med Imag. 2016.
8 Nadakuditi, IEEE Trans. Inf. Theory 2014
Figures