0224
Application of an Extended Stretched-Exponential Model for Morphometric Analysis of Accelerated Diffusion-weighted 129Xe MRI of the Rat Lung1Robarts Research Institute, London, ON, Canada, 2Lawson Imaging, Lawson Health Research Institute, London, ON, Canada, 3Translational Medicine Program, Peter Gilgan Centre for Research and Learning, The Hospital for Sick Children, Toronto, ON, Canada, 4Department of Medical Biophysics, University of Toronto, Toronto, ON, Canada, 5Department of Medical Biophysics, Western University, London, ON, Canada, 6Division of Respirology, Department of Medicine, Western University, London, ON, Canada
Synopsis
Hyperpolarized 129Xe pulmonary MRI is poised for clinical translation due in part to the clinical-relevance of 129Xe MRI biomarkers of lung disease. A rapid multi-b diffusion-weighted 129Xe MRI requires for clinical morphometry due to the challenges in acquiring a fully-sampled dataset during the relatively short 10-16sec breath-holds. Therefore, in this proof-of-concept evaluation, our objective was to measure morphometry estimates in a small group of control-rats as well as rats with early stage radiation-induced-lung-injury, and compare the stretched-exponential-model based morphometry estimates for three different cases: 1) fully-sampled k-space 2) 85% retrospectively under-sampled k-space, (acceleration factor (AF)=7), and 3) 90% retrospectively under-sampled (AF=10) k-space.
Introduction:
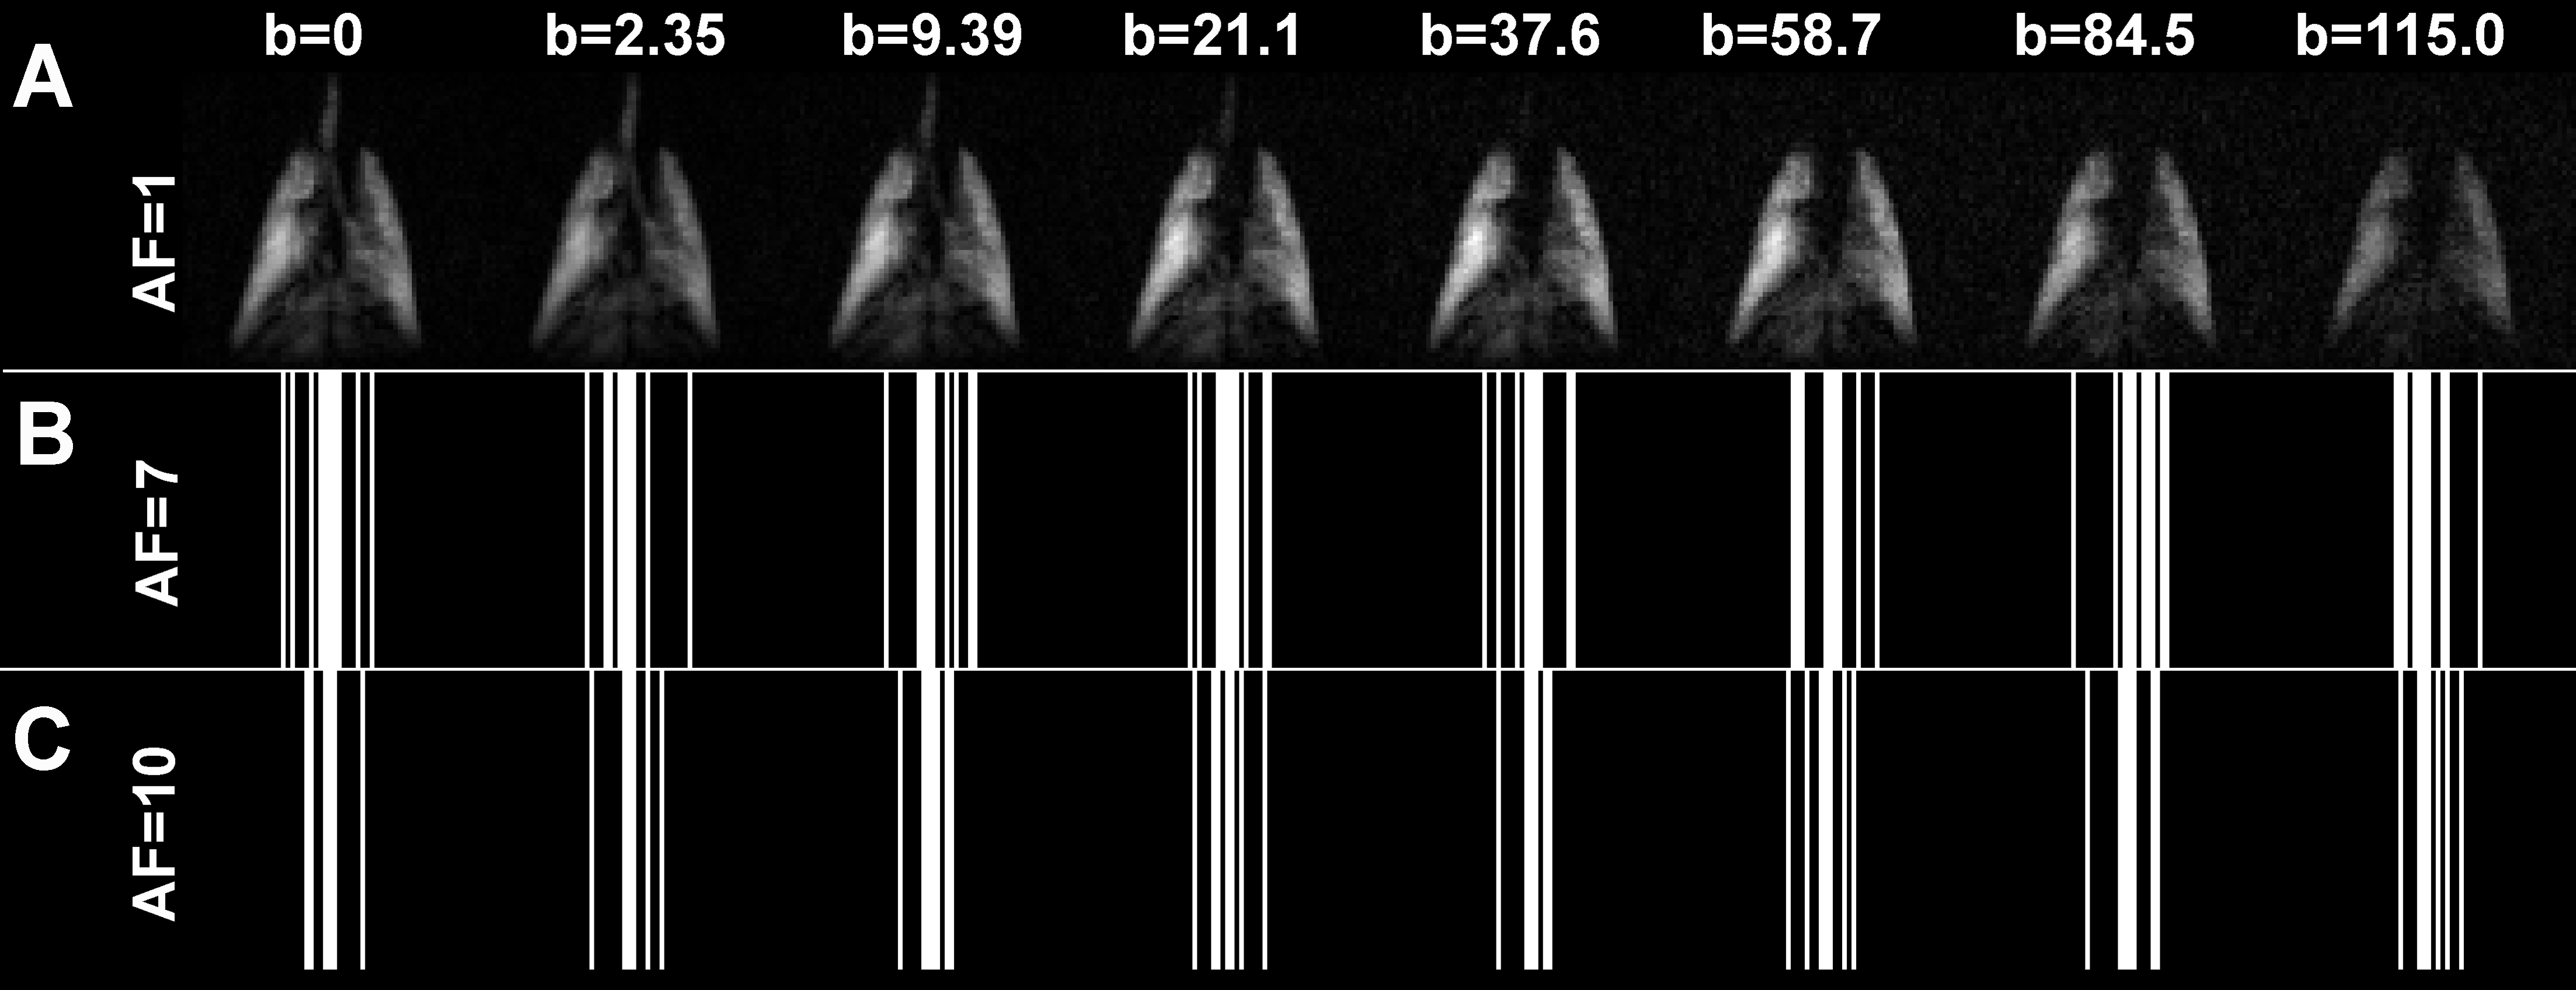
Hyperpolarized 129Xe pulmonary MRI is poised for clinical translation due in part to the clinical relevance of 129Xe MRI biomarkers of lung disease, a stable supply of 129Xe gas and the commercial availability of polarizers that generate large volumes of highly polarized gas.A rapid multi-b diffusion-weighted 129Xe MRI method is required for clinical morphometry due to the challenges in acquiring fully-sampled datasets during the relatively short 10-16sec breath-holds.1 Acquisition of whole-lung 3D multi-b diffusion-weighted data acquired in a single breath-hold has been shown to be feasible for clinical 3He lung MRI using traditional k-space sampling2 and accelerated sampling with both parallel imaging3 and compressed-sensing (CS).4-6 Recently, a stretched-exponential-model4,7 (SEM) combined with the CS was proposed for the rapid acquisition (up to 10x faster) and evaluation of hyperpolarized gas multiple b-value diffusion-weighted 3He MRI.8,9 SEM is not constrained to a specific range of diffusion-times (D), thus, it may be able to reveal information about the lung microstructure at different diffusion-length-scales where non-Weibel-like acinar-ducts are present, as in cases of post-irradiation-fibrosis or severe-emphysema. Unfortunately, this approach doesn’t provide clinically-relevant information about the lung parenchyma microstructure such as mean-linear-intercept (Lm).9-11 We hypothesize that there is a correlation between the specific diffusion length scale (LmD)4,6 estimated using SEM and the measurement of Lm estimated using a validated morphometry approach.9,10 Therefore, in this proof-of-concept evaluation, our objective was to measure LmD/Lm estimates in a small group of control rats as well as rats with early stage radiation-induced lung injury, and compare the SEM-based LmD/Lm estimates for three different cases: 1) fully-sampled k-space (Figure 1a), 2) 85% retrospectively under-sampled k-space in the diffusion-weighting direction, (acceleration factor (AF)=7, Figure 1b), and 3) 90% retrospectively under-sampled (AF=10, Figure 1c) k-space in the diffusion-weighting direction.Methods:
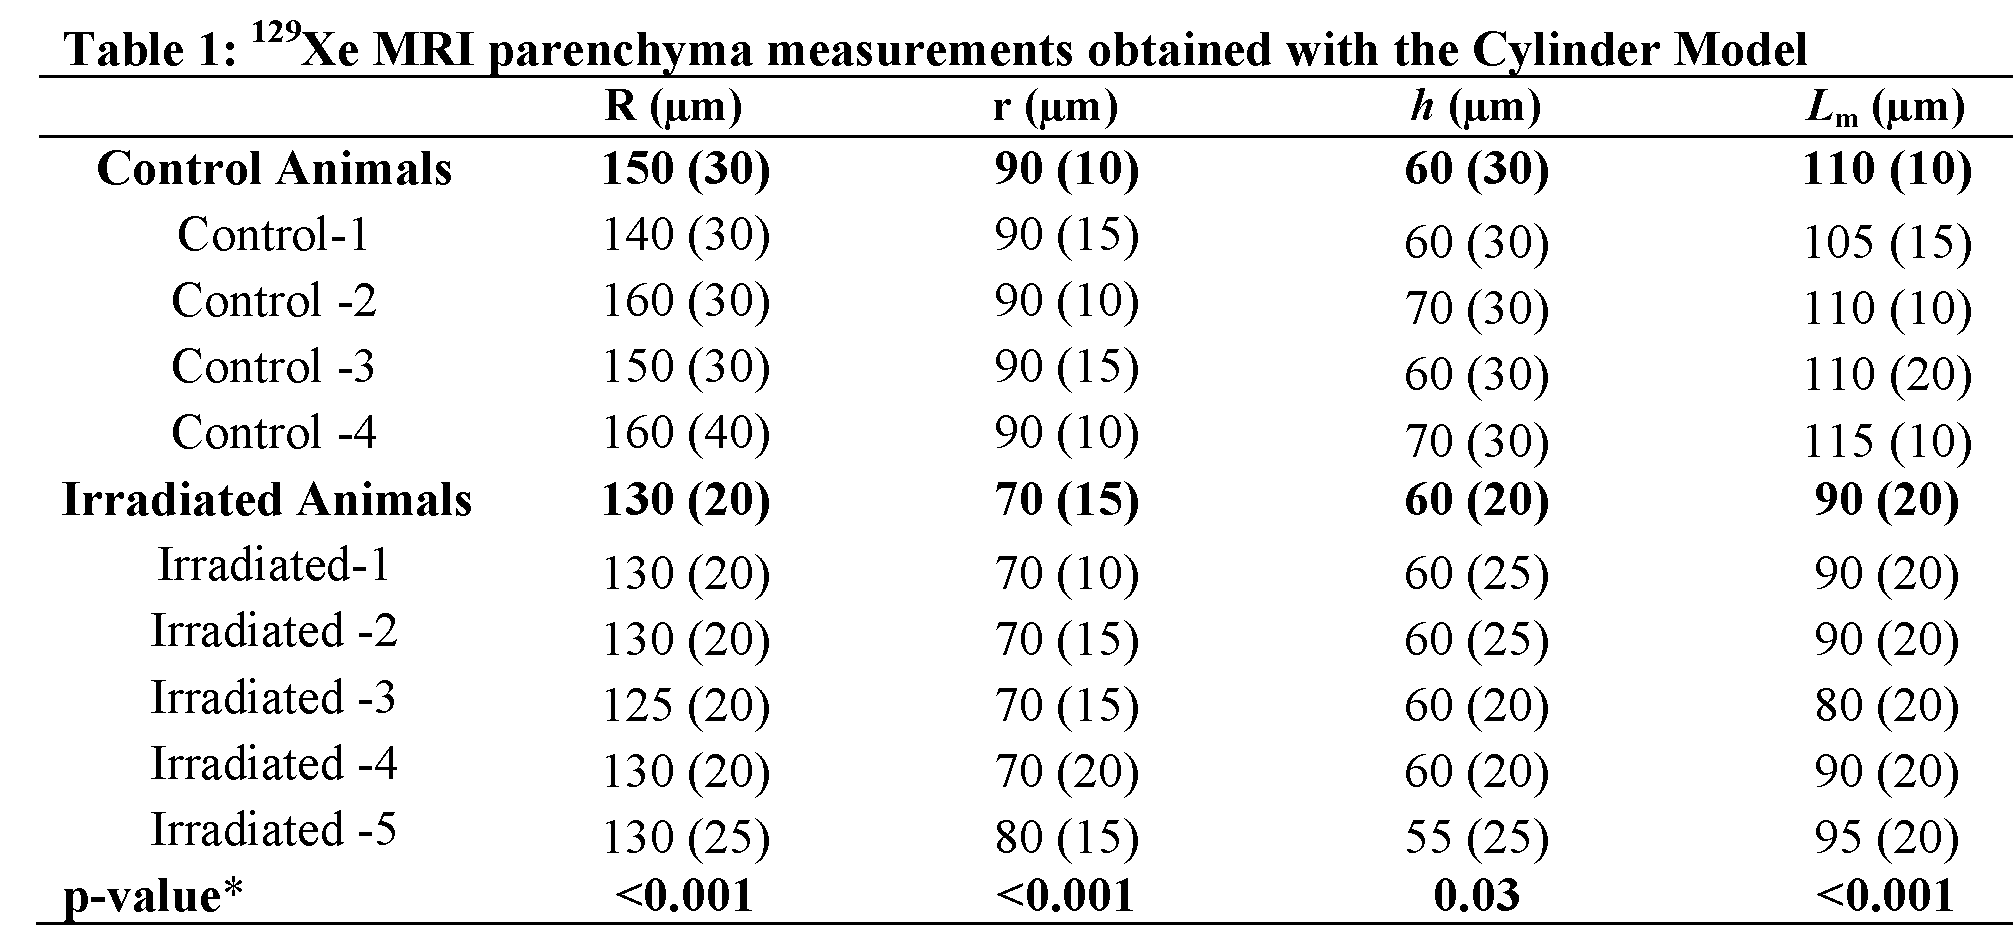
Four control-animals (372±37g) and five irradiated-animals (380±30g) (Sprague Dawley rats) were studied (ethics-board-approved-protocol). Animal irradiations were carried out using a Cobalt-60 source having a mean dose rate of 190cGy/min as previously described.12 Imaging was performed at 3.0T (MR750, GEHC, WI) using a high-performance insert-gradient-coil (G=500mT/m, slew-rate=2000T/m/s)13 and a commercial, xenon-quadrature-rat-sized RF coil14 (Morris Instruments, Canada). In all xenon measurements the diffusion-sensitization gradient pulse ramp up/down time=500μs, constant time=2ms, Δ=5.0ms, providing eight b-values 0, 2.35, 9.39, 21.1, 37.6, 58.7, 84.5 and 115s/cm2. A single breath-hold, interleaved (eight interleaves) centric 2D FGRE diffusion-weighted sequence was acquired for a coronal slice (TE/TR=10.3ms/14.5ms, BW=8kHz, matrix size=64x64, and FOV=50x50mm2, variable-flip-angle, 10sec breath-hold). Hyperpolarized 129Xe (83%) gas was provided by turn-key, spin-exchange polarizer systems (Polarean 9800, polarization range: 7-15%; Xemed XeBox-E1015, polarization range: 20-35%). Four wash-in-breaths of 129Xe were administered to the rats prior to imaging. Diffusivity (DDC), heterogeneity-index (α), LmD and morphometry maps (acinar-duct external/internal radius; (R/r), alveolar-sleeve-depth (h), Lm) were generated using the cylinder-model (CM) as previously described.6,10,11,16,17 Two k-space masks mimicking AF=7/AF=10 were retrospectively applied to the fully-sampled k-space data in order to obtain under-sampled k-spaces with two different AFs. The histological mean-linear-intercept (MLI) estimates were obtained as previously described.12Results:
Table 1 shows the CM-based morphometry estimates for all rats. Mean R/r/h/Lm estimates for control rats were significantly different from corresponding mean R/r/h/Lm estimates for irradiated rats (p<.03; for all, AF=1). Table 2 shows LmD estimates obtained for all rats at three different AF. Mean LmD estimates for the control rats were significantly different from corresponding mean LmD estimates for the irradiated rats (p<.01; for all AF). Figure 2B shows the LmD values correlated with Lm (histological MLI estimates) and the empirical relationship. This relationship was used to calculate the Lm estimates for three different AF (Table 2). Figure 3 shows representative DDC/α/LmD/Lm maps for the Control-4 reconstructed from the AF=1/AF=7/AF=10 k-spaces. The mean differences of 7.0%/(9.0%), 2.0%/(2.0%), 2.0%/(2.0%) and 6.0%/(5.0%) were observed between AF=1 and AF=7/(AF=10) for the DDC/α/LmD/Lm values, respectively. Figure 4 shows representative DDC/α/LmD/Lm maps for the Irradiated-1 reconstructed from the AF=1/AF=7/AF=10 k-spaces. The mean differences of 3.0%/(2.0%), 1.0%/(2.0%), <1.0%/(<1.0%) and <1.0%/(<1.0%) were observed between AF=1 and AF=7/(AF=10) for the DDC/α/LmD/Lm values, respectively.Discussion and Conclusion:
In this proof-of-concept study we showed that
the SEM can be extended to provide clinically-relevant morphometry estimates. We also show that the differences in 129Xe
MRI-based LmD/Lm estimates from fully-sampled
and under-sampled (AF=7/AF=10) k-space were similar to those observed with accelerated 129Xe
multi-b diffusion-weighted MRI.4 Figures 2 and
3 suggest that morphometry estimates were reasonably close between
AF=1/AF=7/AF=10 acquisitions. This,
supported by the measured histological MLI
estimates (Figure 2B) suggests that the accelerated SEM may be used as an
alternative to the cylinder-model. Moreover, by
utilizing AF=10, within a single 1sec
breath-hold, whole lung projection 129Xe MRI-based morphometry estimates can potentially
be generated.Acknowledgements
The authors wish to acknowledge the following sources of funding: Canadian Institutes for Health Research (Operating grant MOP-123431), Ontario Research Fund (Ontario Preclinical Imaging Consortium) and the Natural Sciences and Engineering Research Council. The authors would also like to thank Adam Farag, Paula Pflugfelder and Zack Zytner for assistance with MRI experiments and data analysis.
Authors thank Abascal, et all for providing Matlab code for the image reconstruction.
References
1 Ouriadov, A. et al.
Lung morphometry using hyperpolarized (129) Xe apparent diffusion coefficient
anisotropy in chronic obstructive pulmonary disease. Magn Reson Med 70,
1699-1706, doi:10.1002/mrm.24595 (2013).
2 Paulin, G. A. et al. Noninvasive quantification of alveolar morphometry in
elderly never- and ex-smokers. Physiol
Rep 3, doi:10.14814/phy2.12583
(2015).
3 Chang, Y. V., Quirk, J. D. & Yablonskiy, D. A. In vivo lung morphometry with accelerated hyperpolarized (3) He diffusion MRI: a preliminary study. Magn Reson Med 73, 1609-1614, doi:10.1002/mrm.25284 (2015).
4 Chan, H. F., Stewart, N. J., Norquay, G., Collier, G. J. & Wild, J. M. 3D diffusion-weighted (129) Xe MRI for whole lung morphometry. Magn Reson Med 79, 2986-2995, doi:10.1002/mrm.26960 (2018).
5 Zhang, H. et al. Lung morphometry using hyperpolarized (129) Xe multi-b diffusion MRI with compressed sensing in healthy subjects and patients with COPD. Med Phys 45, 3097-3108, doi:10.1002/mp.12944 (2018).
6 Chan, H. F., Stewart, N. J., Parra-Robles, J., Collier, G. J. & Wild, J. M. Whole lung morphometry with 3D multiple b-value hyperpolarized gas MRI and compressed sensing. Magn Reson Med 77, 1916-1925, doi:10.1002/mrm.26279 (2017).
7 Parra-Robles, J., Marshall, H. & Wild, J. M. Characterization of 3He Diffusion in Lungs using a Stretched Exponential Model [abstract]. ISMRM 21st Annual Meeting, 0820 (2013).
8 Abascal, J. F. P. J., Desco, M. & Parra-Robles, J. Incorporation of prior knowledge of the signal behavior into the reconstruction to accelerate the acquisition of MR diffusion data. ArXiv e-prints 1702 (2017). <http://adsabs.harvard.edu/abs/2017arXiv170202743A>.
9 Westcott, A., Guo, F., Parraga, G. & Ouriadov, A. Rapid Single-breath Hyperpolarized Noble Gas MRI Based Biomarkers of Airspace Enlargement. J Magn Reson Imaging, doi:10.1002/jmri.26574 (2018).
10 Ouriadov, A., Lessard, E., Sheikh, K., Parraga, G. & Canadian Respiratory Research, N. Pulmonary MRI morphometry modeling of airspace enlargement in chronic obstructive pulmonary disease and alpha-1 antitrypsin deficiency. Magn Reson Med 79, 439-448, doi:10.1002/mrm.26642 (2018).
11 Yablonskiy, D. A. et al. Quantification of lung microstructure with hyperpolarized 3He diffusion MRI. J Appl Physiol (1985) 107, 1258-1265, doi:10.1152/japplphysiol.00386.2009 (2009).
12 Ouriadov, A. et al. Early stage radiation-induced lung injury detected using hyperpolarized (129) Xe Morphometry: Proof-of-concept demonstration in a rat model. Magn Reson Med 75, 2421-2431, doi:10.1002/mrm.25825 (2016).
13 Foster-Gareau, P., Heyn, C., Alejski, A. & Rutt, B. K. Imaging single mammalian cells with a 1.5 T clinical MRI scanner. Magn Reson Med 49, 968-971, doi:10.1002/mrm.10417 (2003).
14 Kaushik, S. S. et al. Single-breath clinical imaging of hyperpolarized (129)Xe in the airspaces, barrier, and red blood cells using an interleaved 3D radial 1-point Dixon acquisition. Magn Reson Med 75, 1434-1443, doi:10.1002/mrm.25675 (2016).
15 Hersman, F. W. et al. Large production system for hyperpolarized 129Xe for human lung imaging studies. Acad Radiol 15, 683-692, doi:10.1016/j.acra.2007.09.020 (2008).
16 Kirby, M. et al. Hyperpolarized 3He and 129Xe MR imaging in healthy volunteers and patients with chronic obstructive pulmonary disease. Radiology 265, 600-610, doi:10.1148/radiol.12120485 (2012).
17 Sukstanskii, A. L. & Yablonskiy, D. A. Lung morphometry with hyperpolarized 129Xe: theoretical background. Magn Reson Med 67, 856-866, doi:10.1002/mrm.23056 (2012).
Figures
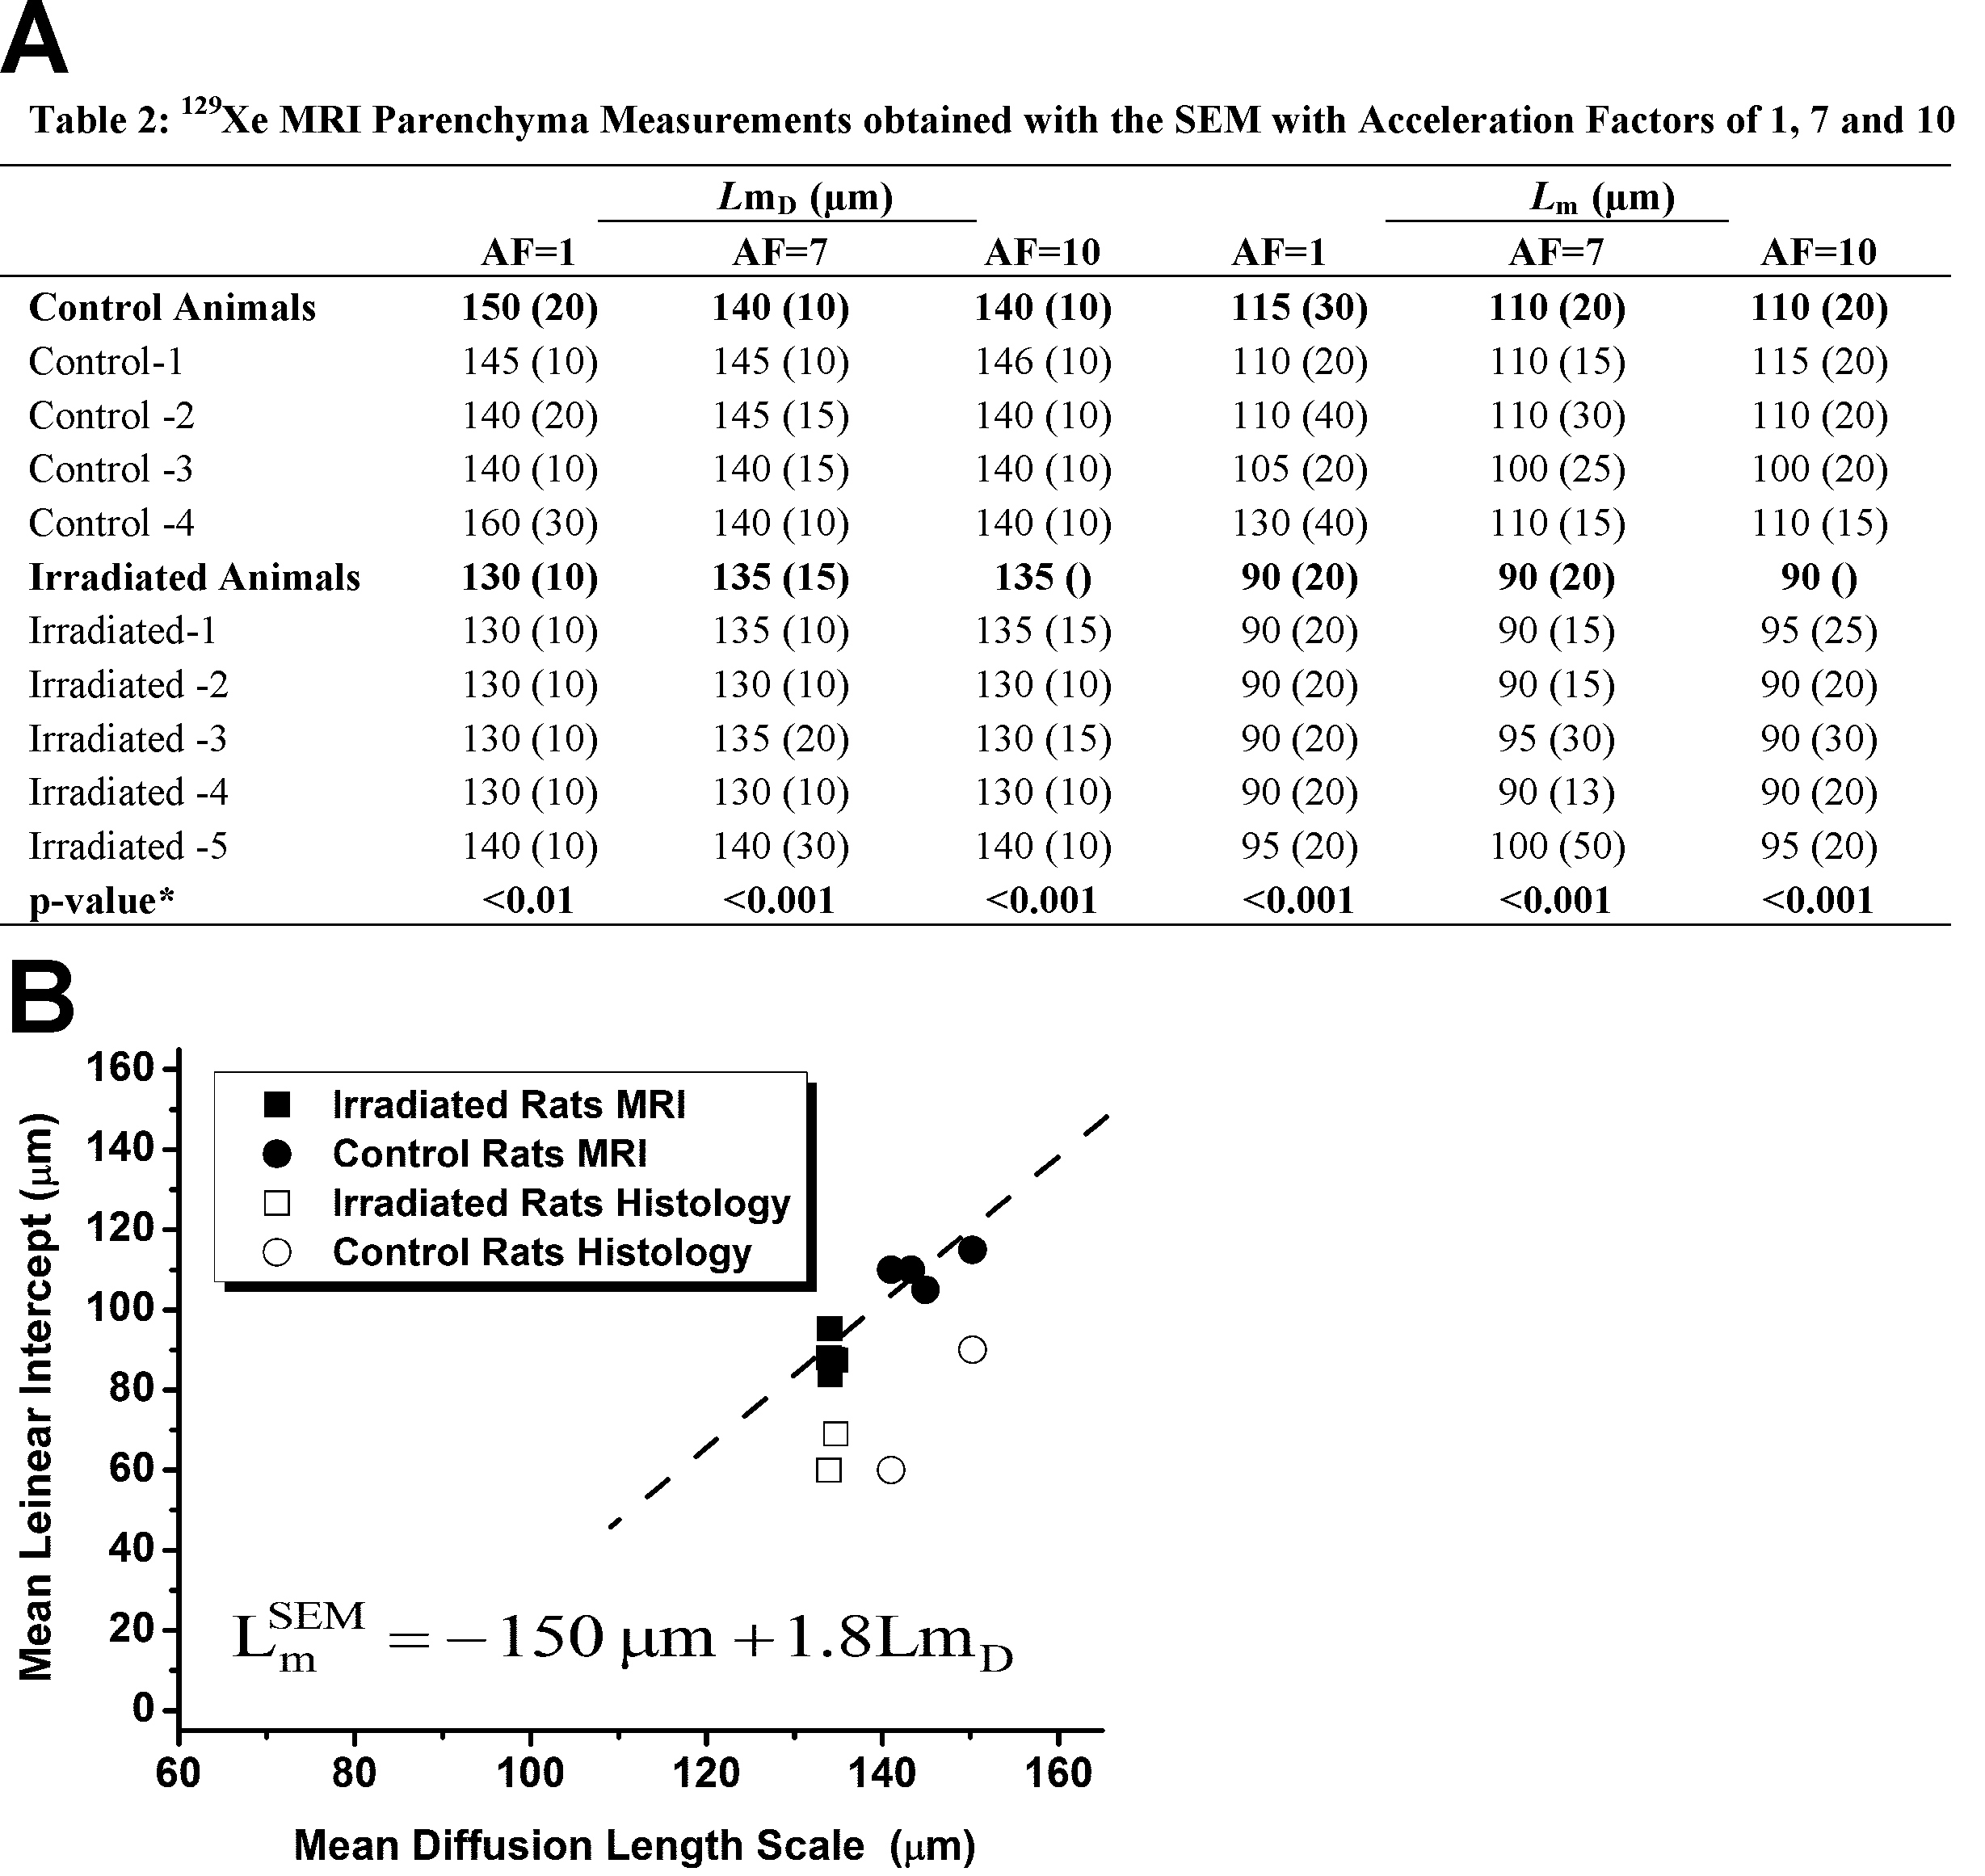
(A) *ANOVA between control and irradiated rats; SEM =stretched exponential model; AF = Acceleration Factor; LmD = specific to acinar duct mean diffusion length; Lm = mean linear intercept estimate.
(B)
Figure
2B. Relationships for mean linear
intercept (cylinder-model) with diffusion-scales (stretched-exponential-model).
Relationship for LmD
= mean-diffusion-length-scale with Lm
and MLI for irradiated (solid
squares) and control (solid circles) (R = 0.94; y = 1.8x – 150µm; p < 0.0006) rats. Histological
data (MRI-based LmD vs MLI) are shown for demonstration purposes
only. MLI = histological mean-linear-intercept.
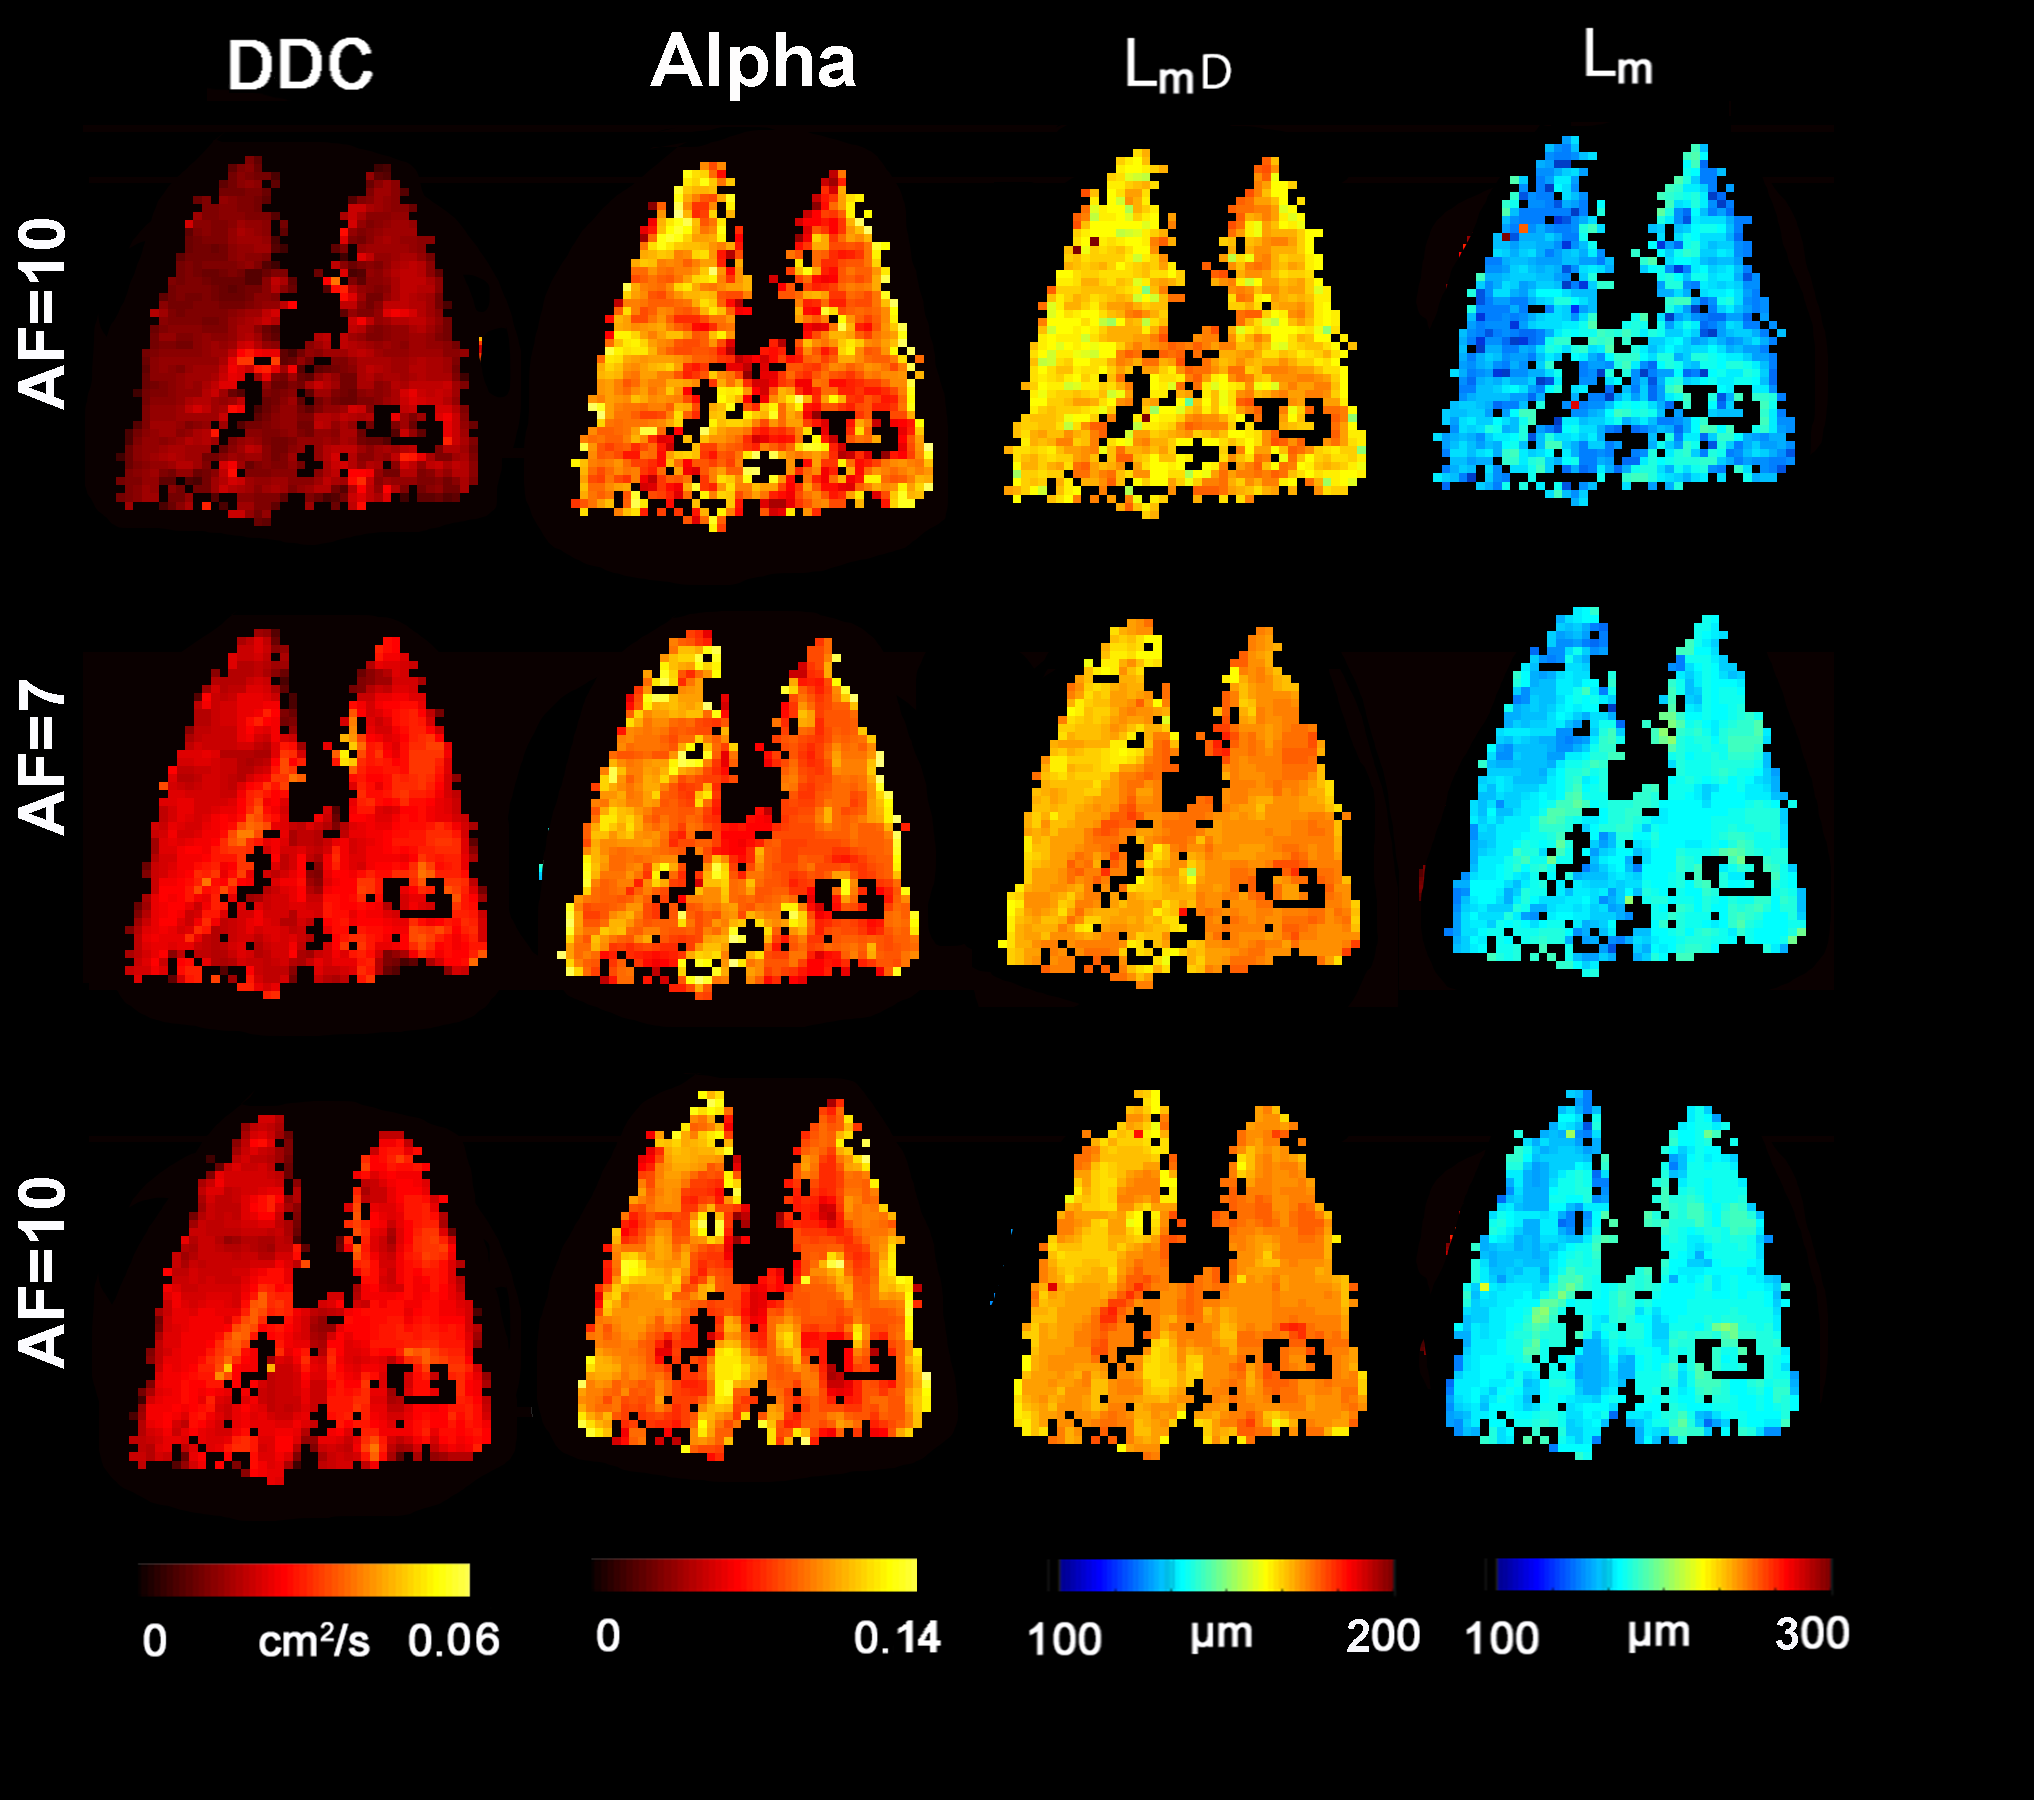
Figure 3. Representative 129Xe MRI maps obtained with the SEM for the Control Rat (C4) with acceleration of 1, 7 and 10.
DDC = MRI-derived apparent diffusivity estimate; Alpha (α) = MRI-derived heterogeneity index; LmD = MRI specific to acinar duct mean-diffusion-length; Lm = MRI mean-linear-intercept estimate; AF = Acceleration Factor.
AF=1: DDC = .013cm2s-1, α = .80, LmD = 160µm, Lm = 130µm;
AF=7: DDC = .020cm2s-1, α = .80, LmD = 140µm, Lm = 110µm;
AF=10: DDC = .020cm2s-1, α = .80, LmD = 140µm, Lm = 110µm.
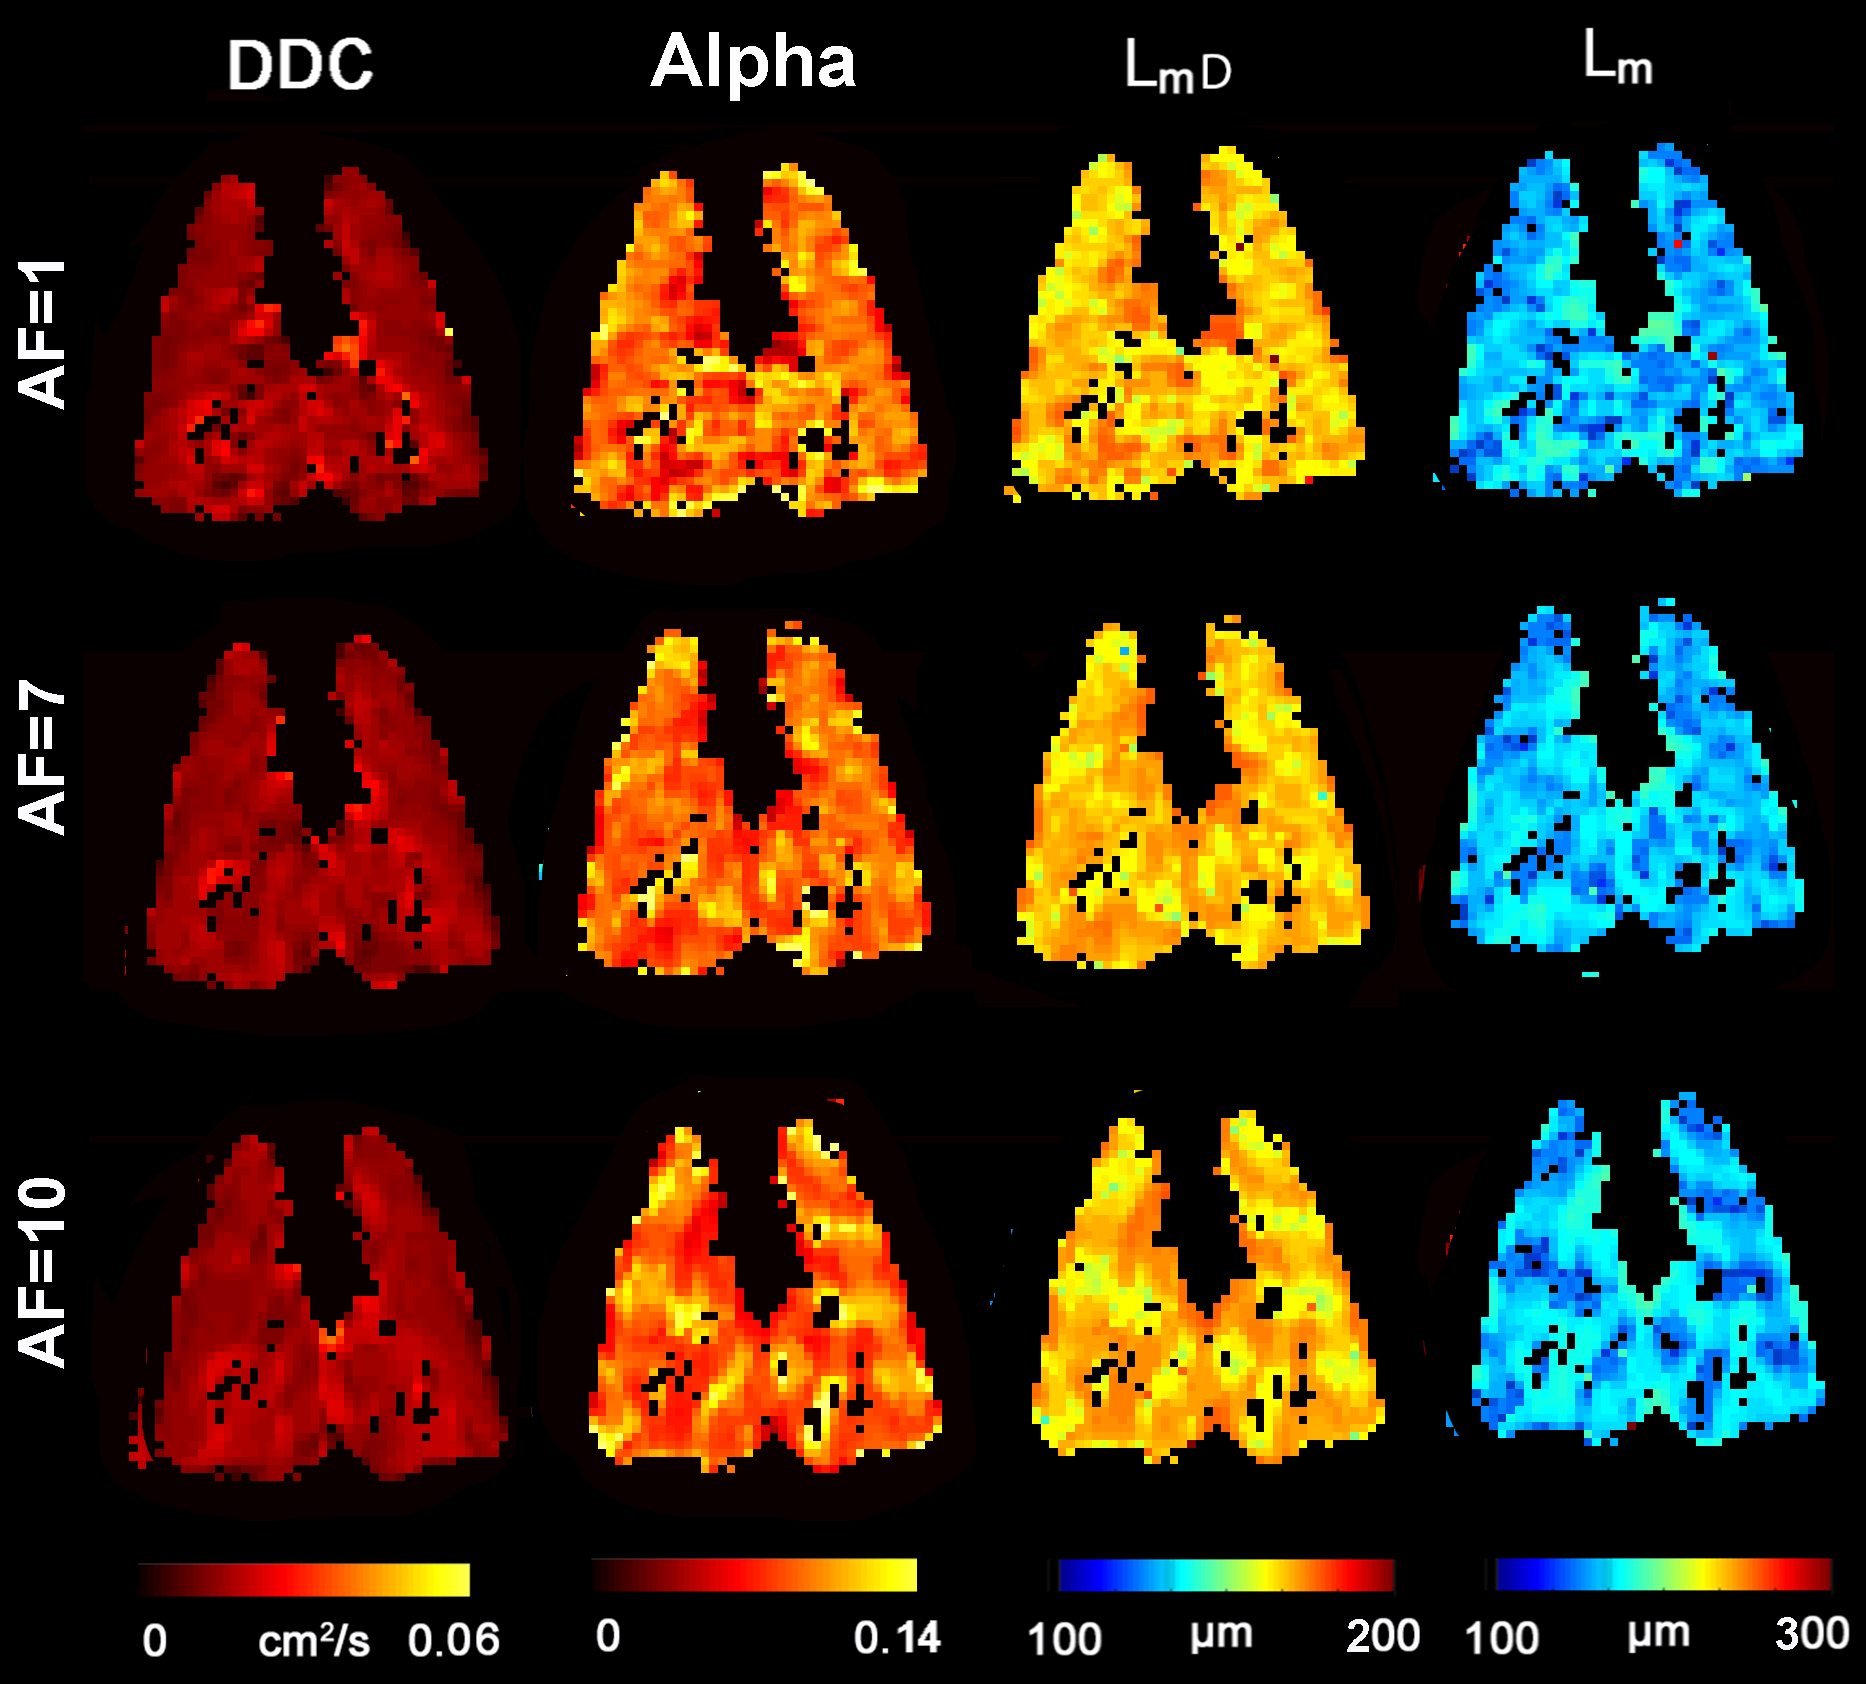
Figure 4. Representative 129Xe MRI maps obtained with the SEM for the Irradiated Rat (I-1) with acceleration of 1, 7 and 10.
DDC = MRI-derived apparent diffusivity estimate; Alpha (α) = MRI-derived heterogeneity index; LmD = MRI specific to acinar duct mean-diffusion-length; Lm = MRI mean-linear-intercept estimate; AF = Acceleration Factor.
AF=1: DDC = .013cm2s-1, α = .80, LmD = 130µm, Lm = 90µm;
AF=7: DDC = .013cm2s-1, α = .80, LmD = 135µm, Lm = 90µm;
AF=10: DDC = .013cm2s-1, α = .80, LmD = 135µm, Lm = 95µm.