0222
A GRANDIOSE sequence to time-lock BOLD and diffusion-weighted fMRI contrasts in humans using ultra-strong gradients and spirals1CUBRIC, School of Psychology, Cardiff University, Cardiff, United Kingdom
Synopsis
Diffusion-weighted fMRI (dfMRI) has been suggested to provide more direct and specific correlates to neuronal activation than BOLD fMRI. However, its underpinnings are debated. A sequence that captures BOLD and dfMRI contrasts simultaneously can play a vital role in elucidating the dfMRI contrast mechanisms. Hence, we developed a sequence that leverages the ultra-strong gradients for diffusion-weighting and spiral-in and spiral-out trajectories to acquire BOLD and dfMRI contrasts near-simultaneously. We demonstrate its functionality using visual stimulation in humans. This novel sequence enables a direct comparison between BOLD and dfMRI contrasts and offers new opportunities to improve our understanding of these contrasts.
Introduction
Due to the complementary characteristics of gradient-echo (GE) and spin-echo (SE) BOLD contrasts1-3, they have been acquired near-simultaneously in some functional studies4,5. Diffusion has played an important role in enhancing our understanding of BOLD contrast6-9. Thus, extending the concurrent acquisition strategy to diffusion-weighted fMRI (dfMRI) is highly desirable. However, realizing this in a single repetition time (TR) in humans has been infeasible, mainly due to the long echo time (TE) that would result from diffusion-weighting. The advent of human scanners with 300 mT/m gradient systems10,11 has provided an unprecedented opportunity in this regard. Yet, with conventional EPI, the shortest TE achievable with b=1000 s/mm2 and 3 mm2 resolution in-plane is ≈40 ms. An additional EPI readout to acquire gradient-echo BOLD contrast with a suitable TE (TE1 ≈30 ms) would push the diffusion-weighted SE (TE2) beyond 80 ms, leading to severe SNR loss. However, replacing the EPIs with spiral-in and spiral-out trajectories for GE and SE would shorten TE2 significantly. This motivated our spiral-based GRadient-echo ANd DIffusiOn-weighted Spin Echo (GRANDIOSE) sequence.METHODS
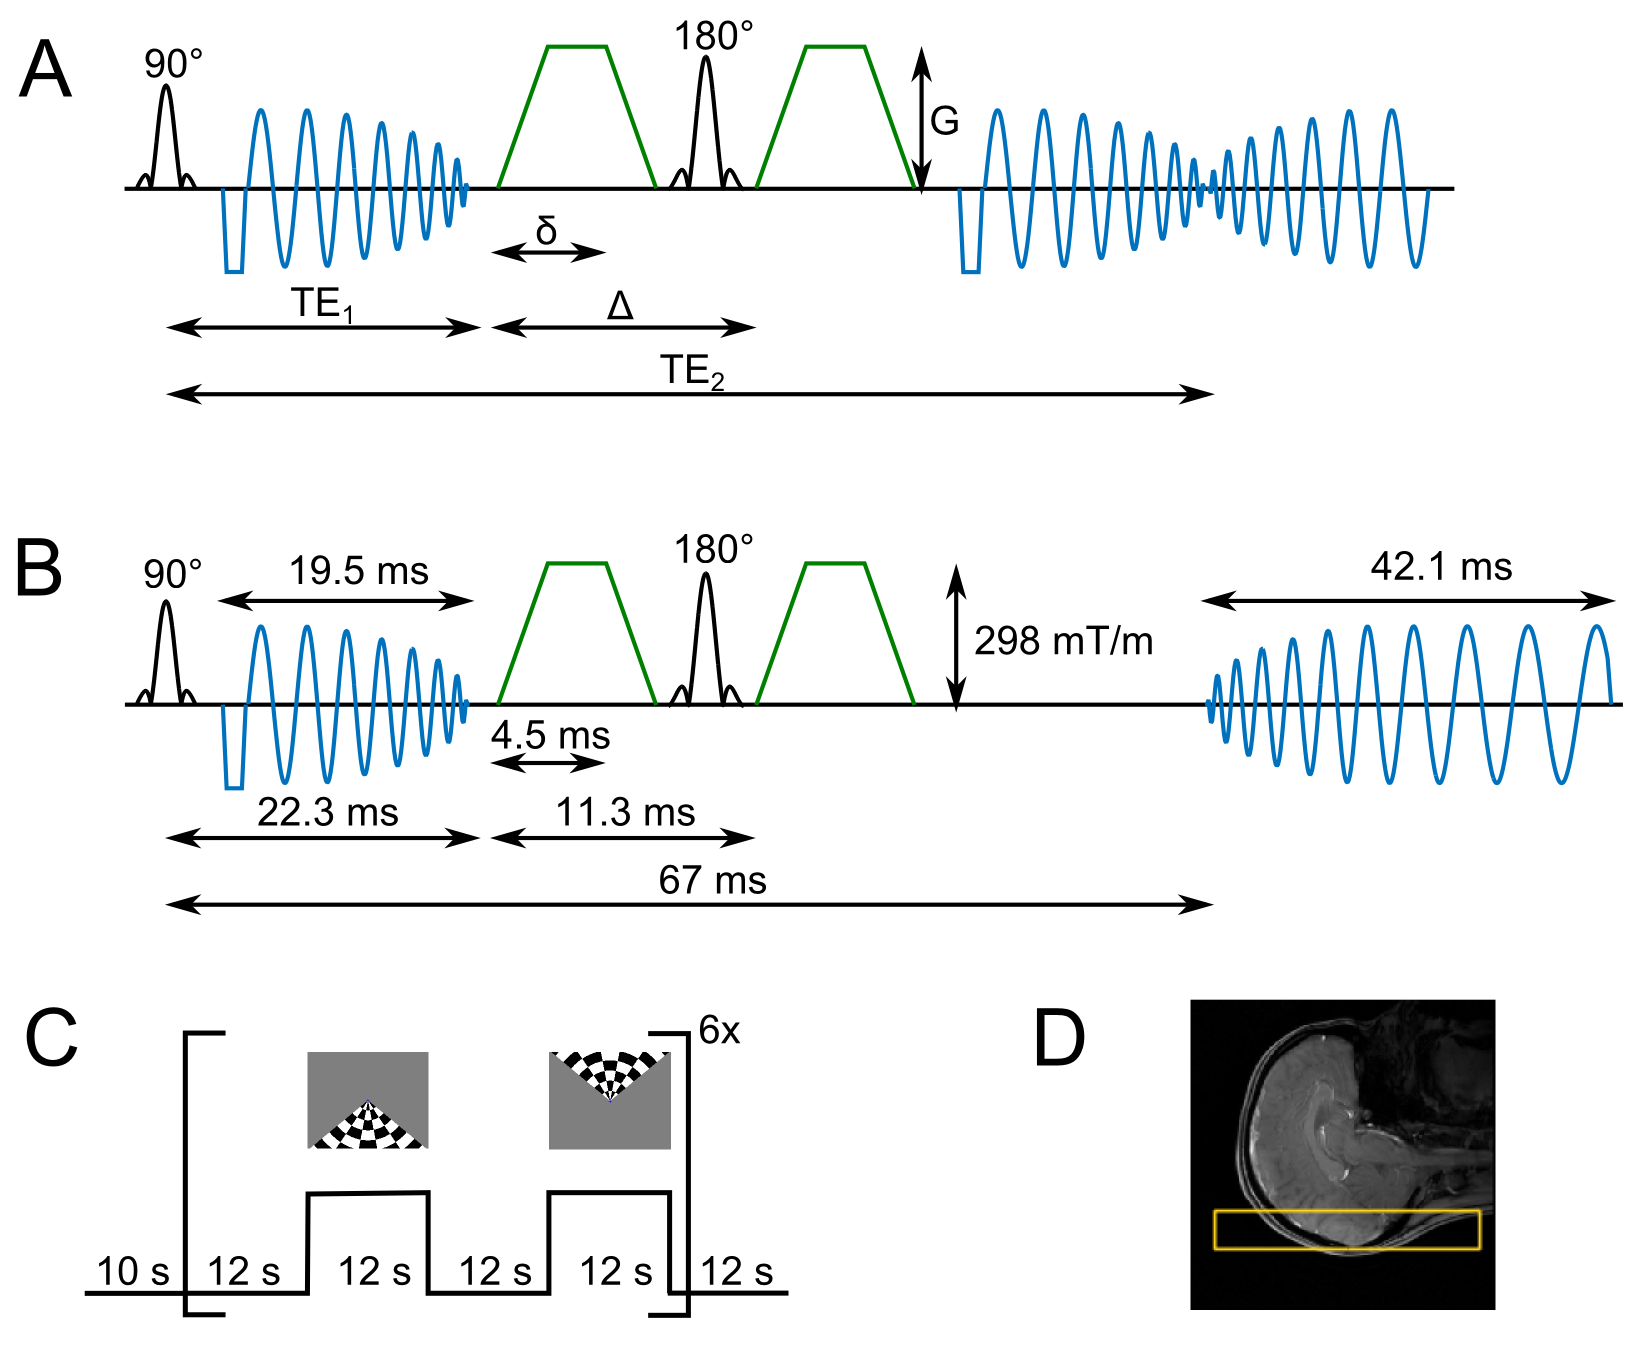
The GRANDIOSE sequence was implemented on the Siemens 3T Connectom scanner with 300 mT/m gradients. We used full k-space, time-optimal spiral trajectories12 for all acquisitions and used a field camera (Skope Inc.) for trajectory measurements13. Fig. 1 illustrates two versions of GRANDIOSE. Fig. 1A shows a general schematic, with a spiral-in-and-out14-17 for the SE, with which one could acquire two images to boost the SNR. Alternatively, a single SE readout can be performed with a different resolution than GE as shown in Fig. 1B, which depicts timings of a particular implementation of GRANDIOSE used for the data presented here. We have implemented and tested both these versions (only one is shown).
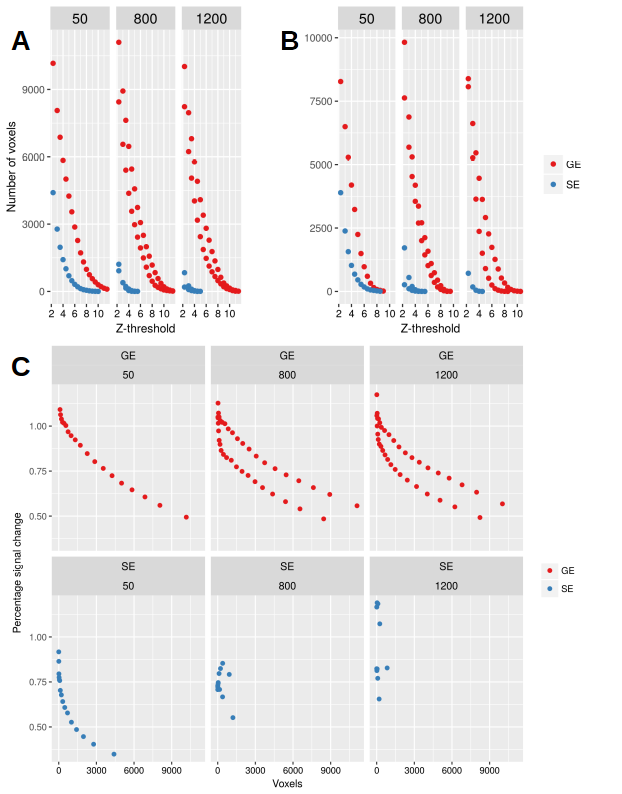
Three healthy volunteers were scanned with the sequence depicted in Fig. 1B during visual hemifield stimulation18 using the paradigm shown in Fig. 1C, with a 32-channel receive head coil. Five fMRI runs were acquired in each session, with a single b = 50 s/mm2 scan and two repetitions of 800 and 1200 s/mm2 scans. The other sequence parameters were: FOV: 18.2 cm2, Resolution: 3 mm2 for GE and 1.75 mm2 for SE, 13 coronal slices (2 mm thick) covering the visual cortex, left-right (X) diffusion weighting direction. Data were reconstructed using gridding and optimal coil combination. The GE data was reconstructed to the same resolution as SE by zero-padding and filtering in k-space.
After motion correction, high-pass filtering and spatial smoothing (5 mm FWHM), fMRI analysis was carried out using FEAT19. Z (Gaussianised T/F) statistic images were thresholded using clusters determined by Z > 2.3 and a (corrected) cluster significance threshold of P = 0.05. We also obtained ICA results on all the datasets. We calculated the activation volume detected with GE and SE scans for different runs in a single session and estimated percentage signal change (%SC) in the activated voxels.
Results
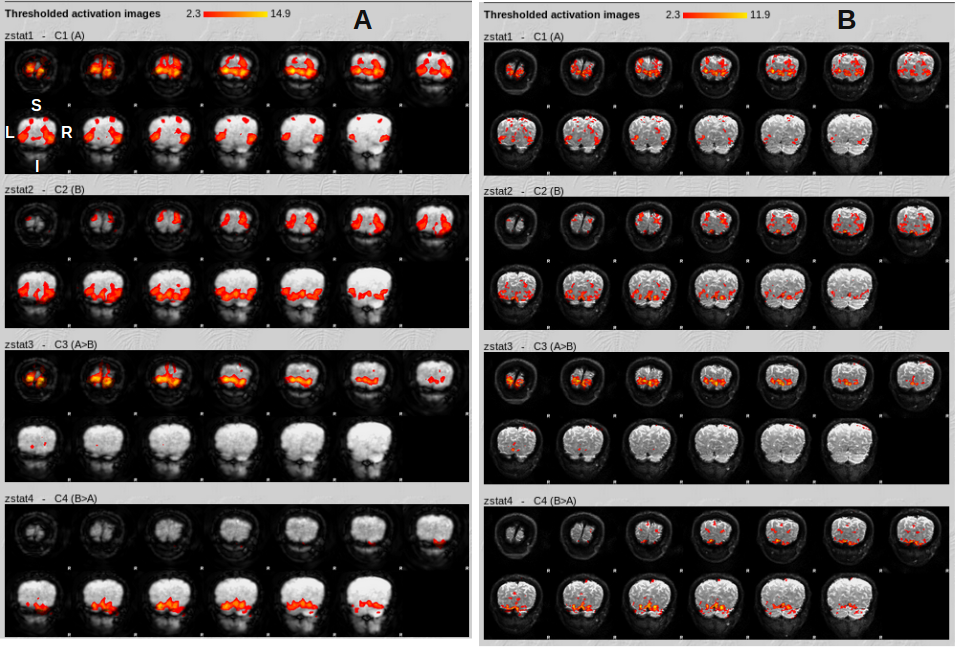
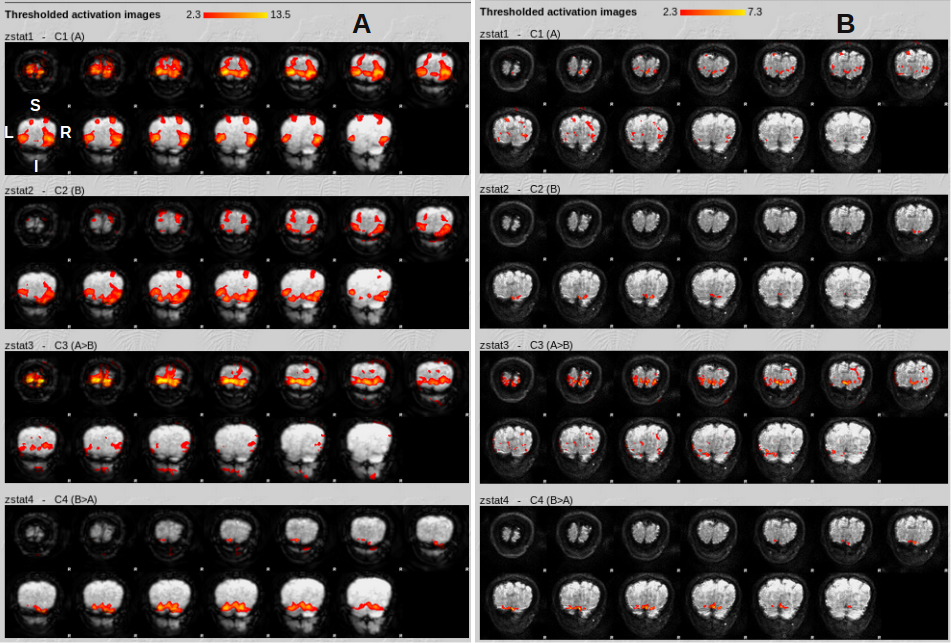
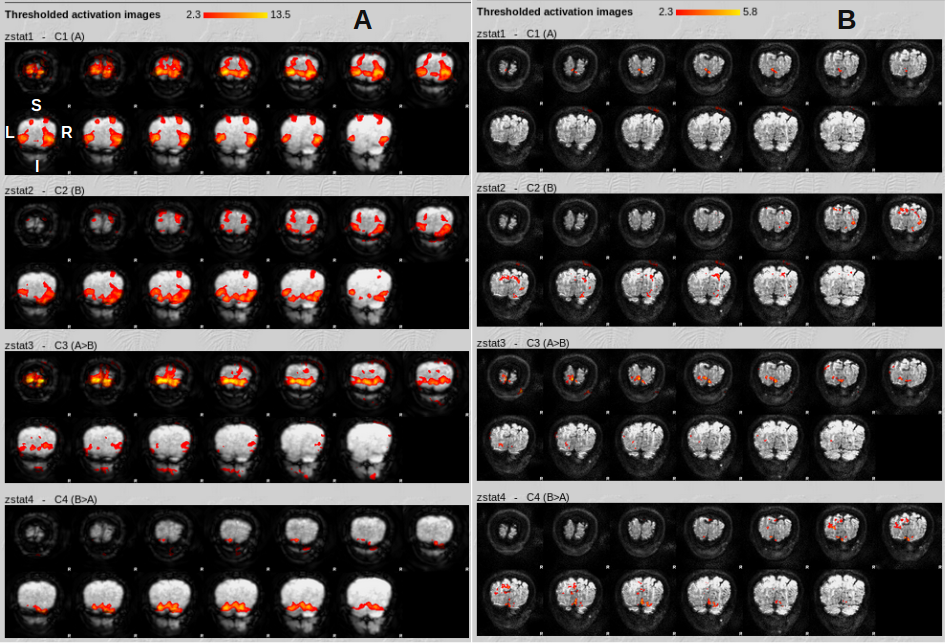
Fig. 2 shows the activation patterns that emerge from fMRI analysis of GRANDIOSE GE and dfMRI datasets from one volunteer. Explanatory variable A represents activation from lower triangular checkerboard stimulation and thus shows activation in superior regions of the visual cortex and vice versa for variable B. The GE and SE activation patterns co-localize well and the greater sensitivity of GE is clearly visible. Crucially, the physiology underlying GE and SE data are time-locked. Similarly, Figs. 3 and 4 show the fMRI analysis results from time-locked GE and dfMRI contrasts obtained at b = 800 and 1200 s/mm2. Fig. 5 shows statistics obtained from one of the datasets. Figs. 5A and B show the number of voxels that responded statistically significantly to the two hemifield events A and B under different Z-thresholds under GE and SE scans. While the GE scans did not undergo diffusion-weighting and show similar responses for each run, we find significantly reduced regions of activation with SE with increasing b-values. Fig. 5C shows the %SC due to activation under hemifield event A, as observed with GE and diffusion-weighted SE acquisitions. While GE responses stay at an identical level, SE responses vary significantly and show an increase with b-value.Discussion
Using ultra-strong gradients and spiral trajectories, we have developed a novel sequence to obtain concurrent GE and SE/dfMRI measurements which can shed new light on the dfMRI contrast mechanisms. We demonstrated its ability to discern different regions of the visual cortex using a hemifield stimulation. Statistics on a GRANDIOSE dataset revealed the expected behaviour of dfMRI contrast, which shows increases in %SC with increasing diffusion-weighting, while the GE response remains constant. We only showed the technical feasibility of GRANDIOSE here and plan to exploit its flexibility in future work to better understand dfMRI.Acknowledgements
The data were acquired at the UK National Facility for In Vivo MR Imaging of Human Tissue Microstructure funded by the EPSRC (grant EP/M029778/1), and The Wolfson Foundation. This work was also funded by a Wellcome Trust Investigator Award (096646/Z/11/Z) and a Wellcome Trust Strategic Award (104943/Z/14/Z).References
1. Norris DG. Spin-echo fmri: The poor relation? NeuroImage, August 2012, 62:1109-1115.
2. Budde J, Shajan G, Zaitsev M, Scheffler K, and Pohmann R. Functional mri in human subjects with gradient-echo and spin-echo epi at 9.4 t. Magnetic resonance in medicine, January 2014, 71:209-218.
3. Rua C, Costagli M, Symms MR, Biagi L, Donatelli G, Cosottini M, Del Guerra A, and Tosetti M. Characterization of high-resolution gradient echo and spin echo epi for fmri in the human visual cortex at 7t. Magnetic resonance imaging, July 2017, 40:98-108.
4. Glielmi CB, Xu Q, Craddock RC, and Hu X. Simultaneous acquisition of gradient echo/spin echo bold and perfusion with a separate labeling coil. Magnetic resonance in medicine, December 2010,64:1827-1831.
5. Cao P, Hyder F, Zhou IY, Zhang JW, Xie VB, Tsang A, and Wu EX. Simultaneous spin-echo and gradient-echo bold measurements by dynamic mrs. NMR in biomedicine, September 2017, 30.
6. Lee SP, Silva AC, Ugurbil K, and Kim SG. Diffusion-weighted spin-echo fMRI at 9.4 T: microvascular/tissue contribution to bold signal changes. Magnetic resonance in medicine, November 1999,42:919-928.
7. Jin T, Zhao F, and Kim SG. Sources of functional apparent diffusion coefficient changes investigated by diffusion-weighted spin-echo fMRI. Magnetic resonance in medicine, December 2006, 56:1283-1292.
8. Michelich CR, Song AW, and Macfall JR. Dependence of gradient-echo and spin-echo bold fmri at 4 t on diffusion weighting. NMR in biomedicine, August 2006, 19:566-572.
9. Jin T and Kim SG. Functional changes of apparent diffusion coefficient during visual stimulation investigated by diffusion-weighted gradient-echo fMRI. NeuroImage, July 2008, 41:801-812.
10. Setsompop K, Kimmlingen R, Eberlein E, Witzel T, Cohen-Adad J, McNab JA, Keil B, Tisdall MD, Hoecht P, Dietz P, Cauley SF, Tountcheva V, Matschl V, Lenz VH, Heberlein K, Potthast A, Thein H, Van Horn J, Toga A, Schmitt F, Lehne D, Rosen BR, Wedeen V, and Wald LL. Pushing the limits of in vivo diffusion MRI for the human connectome project. NeuroImage, October 2013, 80:220-233.
11. Jones DK, Alexander DC, Bowtell R, Cercignani M, Dell'Acqua F, McHugh DJ, Miller KL, Palombo M, Parker GJM, Rudrapatna US, and Tax CMW. Microstructural imaging of the human brain with a 'super-scanner': 10 key advantages of ultra-strong gradients for diffusion MRI. NeuroImage,November 2018, 182:8-38.
12. Lustig M, Kim SJ, and Pauly JM. A fast method for designing time-optimal gradient waveforms for arbitrary k-space trajectories. IEEE transactions on medical imaging, June 2008, 27:866-873.
13. Dietrich BE, Brunner DO, Wilm BJ, Barmet C, Gross S, Kasper L, Haeberlin M, Schmid T, Vannesjo SJ, and Pruessmann KP. A fi eld camera for mr sequence monitoring and system analysis. Magnetic resonance in medicine, April 2016, 75:1831-1840.
14. Glover GH and Law CS. Spiral-in/out bold fmri for increased snr and reduced susceptibility artifacts. Magnetic resonance in medicine, September 2001, 46:515-522.
15. Law CS and Glover GH. Interleaved spiral-in/out with application to functional mri (fmri). Magnetic resonance in medicine, September 2009, 62:829-834.
16. Glover GH. Spiral imaging in fmri. NeuroImage, August 2012, 62:706-712.
17. Jung Y, Samsonov AA, Liu TT, and Buracas GT. High efficiency multishot interleaved spiral-in/out: acquisition for high-resolution bold fmri. Magnetic resonance in medicine, August 2013, 70:420-428.
18. Murphy MC, Conner IP, Teng CY, Lawrence JD, Sa ullah Z, Wang B, Bilonick RA, Kim SG,Wollstein G, Schuman JS, and Chan KC. Retinal structures and visual cortex activity are impaired prior to clinical vision loss in glaucoma. Scienti c reports, August 2016, 6:31464.
19. Woolrich MW, Ripley BD, Brady M, and Smith SM. Temporal autocorrelation in univariate linear modeling of fMRI data. NeuroImage, December 2001, 14:1370-1386. (www.fmrib.ox.ac.uk/fsl)
Figures