0209
Spatial-temporal dynamics of the visual cortex stiffness driven by a flashing checkerboard stimulus1School of Biomedical Engineering and Imaging Sciences, King’s College London, London, United Kingdom, 2Siemens Healthcare Limited, Frimley, United Kingdom, 3Department of Radiology, Brigham and Women’s Hospital, Boston, MA, United States, 4King's College London, London, United Kingdom
Synopsis
In this
Introduction
Previously we demonstrated the ability to perform functional MRE (fMRE) measurements in humans with higher temporal resolution than traditional BOLD fMRI1, which is limited by the slow hemodynamic response function in the order of seconds. In this work, we study the spatial-temporal dynamics of the stiffness in the visual cortex driven by a 12Hz flashing checkerboard stimulation with a range covering low switching times where stiffness changes are linked to the hemodynamic response and faster switching speeds where a new coupling mechanism is necessary to explain the stiffness variation. This study shows the ability to potentially probe neuronal activity non-invasively at temporal resolutions not limited by the hemodynamic response function providing a new tool to understand the brain circuitry.Methods
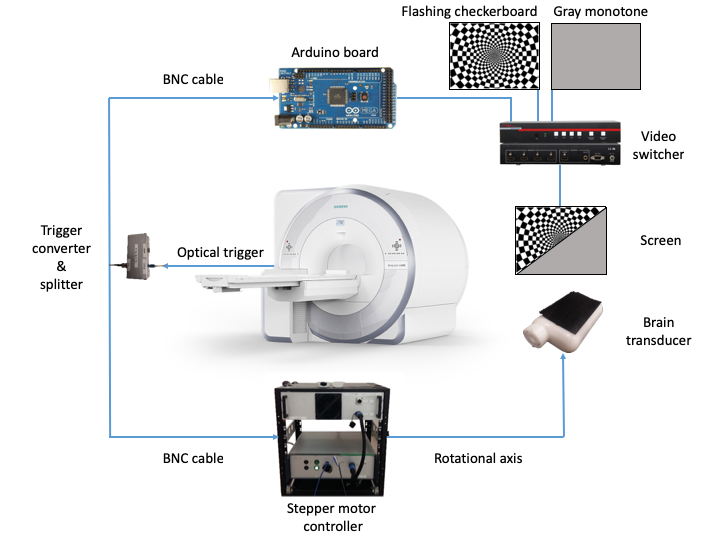
To drive a flashing checkerboard stimulus, we updated the fMRE system (Fig.1) recently presented1 with a seamless HDMI video-switcher [SSW-HD-4, Hall Research, Tustin, CA, USA] controlled by an Arduino microcontroller. The video switcher toggled two continuous video streams, showing a gray monotone and a 12 Hz flashing checkerboard respectively, synchronously with the data acquisition. We developed a non-interleaved multi-slice fMRE sequence to acquire images in switching times compatible to the classical fMRI acquisition, as well as an interleaved multi-slice fMRE sequence for the faster acquisitions on a 3T scanner [Prisma, Siemens Healthcare, Erlangen, Germany]. The sequence encodes wave motion while synchronizing the flashing checkerboard stimulus, a mechanical transducer and the data acquisition. Sequence details were: FLASH readout, flip angle = 25 deg, TE/TR: 12.3/168 ms, scan time: 4 min 56 seconds, MEG amplitude: 55 mT/m, 7 slices, 5 wave phases, GRAPPA: acceleration factor 2, 24 reference lines; FOV: 192x192 mm, 64x64 matrix and 3x3x3 mm3 resolution, 4 repetitions: 3 MEG encoding directions and a reference scan without MEG used as a phase reference. Different paradigm switching schemes were designed to drive different visual stimuli on human subjects: (I) a static monotone gray screen in both paradigms as a control scan to characterize reproducibility of the experiment and visual stimulus switching every (II) 36.96s and (II) 840ms.
Data Analysis: Displacement modulated MR-phase data are pixel-wise Fourier transformed and the according amplitudes and phases at the mechanical driving frequency used to compose the complex valued displacement vector U. Viscoelasticity is solved via a FEM-approach using divergence-free basis functions to eliminate pressure whereby relying on 1st order spatial derivatives instead of 3rd order derivatives2. This provides elevated sensitivity to subtle changes in tissue stiffness.
Results
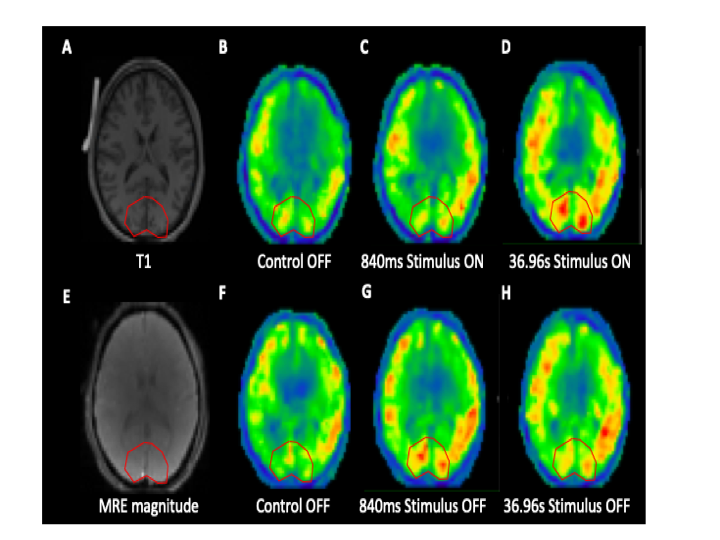
Mean values of the shear modulus within a region of interest in the visual cortex varied for human control experiments by ~0.13 kPA (i.e. about 5%), providing a significance threshold. Slow visual stimulus experiments (switching every 36.96s) showed a localized increase in the shear modulus up to ~0.37 kPA between ON and OFF states (Fig.2 D-H), while the slow showed a decrease up to ~0.4 kPA between the ON and the OFF states. The BOLD response is entirely saturated at those switching frequencies. Thereby, the observed stiffness changes every 840ms between ON and OFF state localized in the visual cortex cannot be explained by changes in the hemodynamics.Discussion and conclusion
The localized changes observed in viscoelastic parameters of human brain tissue when presented to switching visual stimuli are in agreement with the fMRE response measured previously in humans1 and mice. In this analysis we bridge the gap between slow switching times used in classical fMRI experiments (36.96s) and the new domain of fast switching times that are not accessible to clinical BOLD fMRI, i.e. 0.840s. We observe during visual activation for slow switching times an increase in stiffness compared to the OFF state. Intuitively one would attribute the elevated stiffness to the increased hemodynamic response. Interestingly, when switching at 0.840s, we observe the stiffening now during the OFF state of the visual paradigm. Since at 0.840s switching we have a saturated BOLD response, the difference in stiffness between ON and OFF cannot be explained via the classical hemodynamic response function. Another mechanism, more closely linked to primary neuronal activity must therefore be responsible for the observed localized stiffness increase. One potential mechanism is water influx after ionic changes that translates cellular osmotic pressure into hydrostatic pressure. The exact cause for the observed stiffness increase and switch in polarity with timescale is subject to current research.Acknowledgements
This project has received funding from the European Union’s Horizon 2020 research and innovation programme under grant agreement No 668039, from NIH R21EB030757 and from the Brigham and Women's Hospital Research Institute. We thank Adomas Bunevicius and Jeremy Bredfeldt for their invaluable assistance during data acquisition. We would also like to show our gratitude to Ayse Sila Dokumaci for her support with the transducer code, and Giorgia Grisot for her advice on the batch analysis of our results.References
1. de Arcos J, Fovargue D , Schregel K et al. Imaging Primary Neuronal Activity in the Human Optical Cortex at 1.35Hz. In: Proc. Intl. Soc. Mag. Reson. Med. 26. Paris; 2018.
2. Fovargue D, Kozerke S, Sinkus R, Nordsletten D. Robust MR elastography stiffness quantification using a localized divergence free finite element reconstruction. Medical image analysis 44 (2018): 126-142.
3. Patz S, Nazari N, Barbone PE, et al. Functional neuro-imaging with magnetic resonance elastography. In: The Journal of the Acoustical Society of America 141, 3492; 2017.
Figures