0208
Baseline Striatal Dopamine Binding Potential Predicts Functional Connectivity to Ventral Tegmental Area in Control but not in MDD: A Simultaneous [11C] Raclopride PET-fMRI Study1Center for Biomedical Imaging Research, Department of Biomedical Engineering, Tsinghua University, Beijing, China, 2Radiological Sciences Laboratory, Department of Radiology, Stanford University, Palo Alto, CA, United States, 3Harvard-MIT Health Sciences and Technology, MIT, Boston, MA, United States, 4A. A. Martinos Center for Biomedical Imaging, Department of Radiology, Massachusetts General Hospital, Boston, MA, United States, 5Center for Social and Affective Neuroscience, Linköping University, Linköping, Sweden, 6Department of Radiology, Harvard Medical School, Boston, MA, United States, 7Department of Psychology, Stanford University, Palo Alto, CA, United States, 8Applied Science Lab, GE Healthcare, Menlo Park, CA, United States
Synopsis
Our previous work has indicated a significant connection between dopamine release/binding and fMRI activation during reward processing in healthy controls (CTL), but not in major depressive disorder (MDD). It motivates us to explore whether there is a similar disrupting effect in the coupling of resting-state fMRI and baseline dopamine binding potential in MDD. By conducting a simultaneous [11C] Raclopride PET and fMRI study, we obtained significant correlations between striatal dopamine binding potential and VTA-striatum functional connectivity in CTL, but not in MDD, indicating that the decoupling of dopaminergic system and striatum may play a vital role in the pathophysiology of MDD.
Background
The interaction between the midbrain dopaminergic system and the striatum is a crucial component of reward processing. For major depressive disorder (MDD) patients, fMRI studies have shown an impaired functional connectivity (FC) of VTA (ventral tegmental area, key node of the dopaminergic system) to striatum (key node of the reward network) during reward processing1, while PET studies have revealed increased non-displaceable binding potential (BPND) in the striatum2. It’s reasonable that the reduced VTA-striatum functional connectivity might be the consequence of the failure of dopamine binding in striatum. Previously, we’ve conducted a concurrent PET-fMRI study during a monetary incentive delay (MID) task, and showed that a significant correlation between dopamine release in striatum and fMRI activation in VTA observed in healthy controls (CTL), was disrupted in MDD3. However, it is still unknown whether there is a similar disrupting effect in the coupling of resting-state VTA-striatum functional connectivity and baseline striatum BPND in MDD. In the current study, we analyzed resting-state fMRI data and baseline PET data from the simultaneous PET-fMRI study to explore the relation of baseline dopamine release/binding and resting-state functional connectivity in MDD and CTL. We hypothesized that disrupted coupling would be observed in the MDD group.Methods
Participants: We recruited fifteen MDD participants (13 unmedicated; average age = 32.2 years; 8 female, 7 male) and fourteen CTL subjects (average age = 32.5 years; 10 female, 4 male) in the study. Written informed consent was obtained from participants.
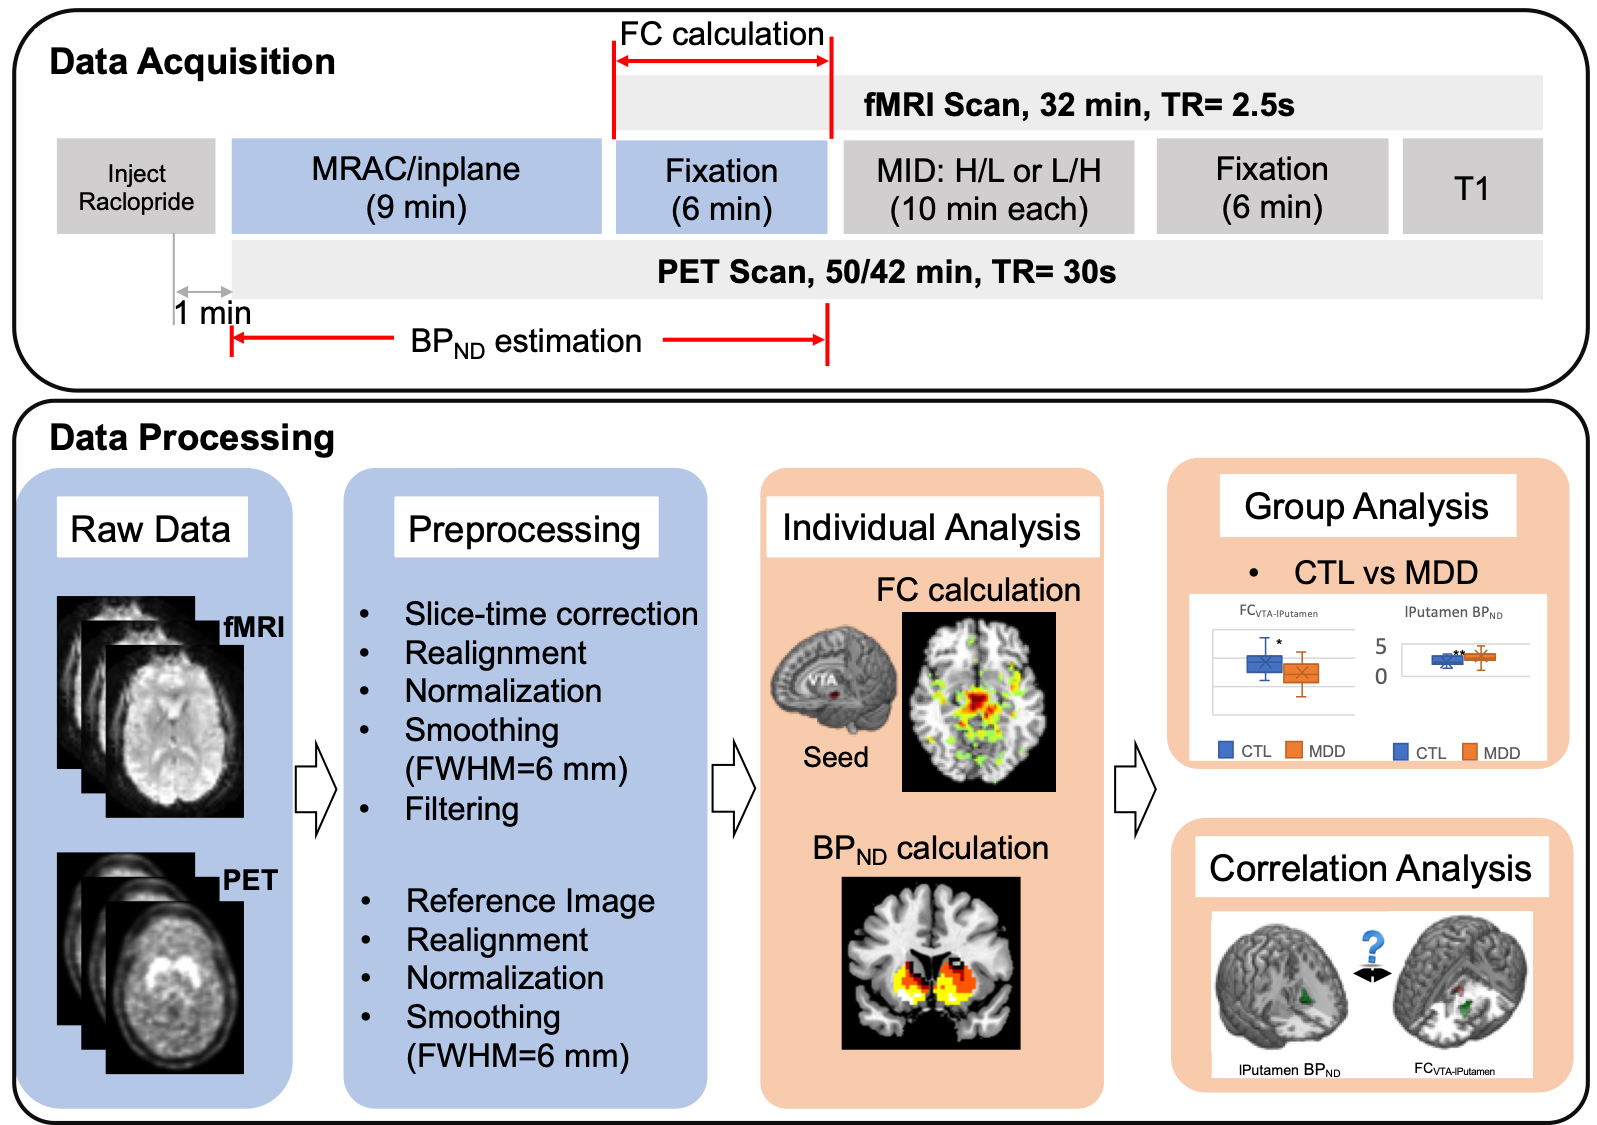
Data Acquisition: The data analyzed was a small portion of a simultaneous PET-fMRI study (Fig. 1), during which all subjects underwent 2 resting-state scans and a MID task. In the current analysis, we only focused on the first 6-min resting-state fMRI data and PET data collected before and during the resting-state. One minute after the injection of [11C] Raclopride, the PET scan was started and took place for 42-minutes or 50-minutes. Nine minutes after the injection, the resting-state scan (6-min) was initiated to allow for the radiotracer uptake. All data were collected on a time-of-flight (TOF) PET-MRI scanner (SIGNA PET-MRI; GE Medical Systems, USA).
Preprocessing and data analysis (Fig. 1) were implemented in DPABI (http://rfmri.org/DPARSF), SPM8 (http://www.fil.ion.ucl.ac.uk/spm/software/spm8/) and self-developed MATLAB code.
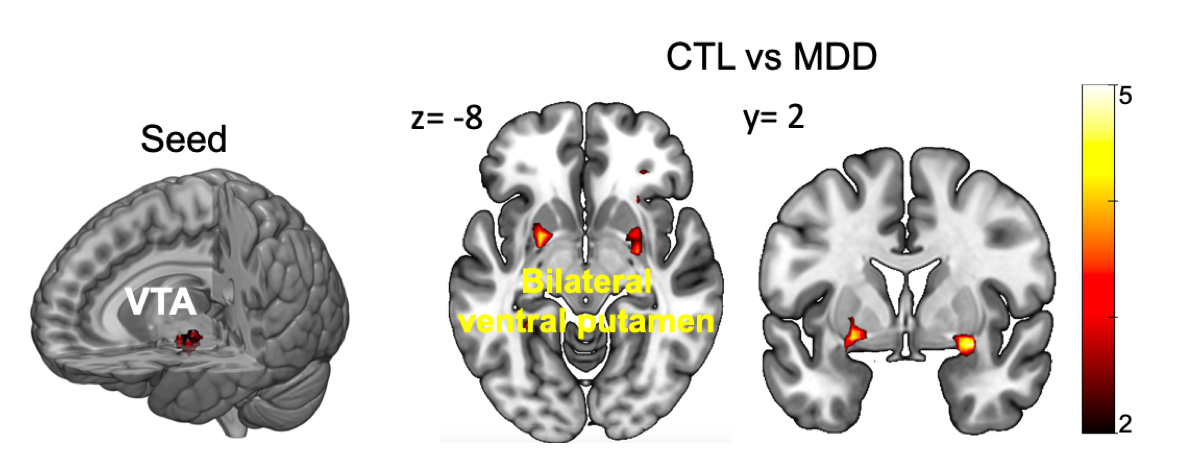
fMRI Data Analysis: fMRI data was preprocessed by a routine pipeline. Percent signal change was calculated with respect to the mean activity over the entire resting-state scan. The VTA was extracted as the seed for functional connectivity (FC) analysis for each individual by applying a well-established VTA atlas4 on the group average activation map of MID task (Fig. 2).
PET Data Analysis: The 2-8 minutes pre-task PET data was averaged as a reference image for a rigid body realignment across different timepoints, and then all PET images were co-registered to the mean fMRI image. PET images were normalized and smoothed with the same parameters as for fMRI. PET data from minute 1 to minute 15 was extracted for baseline BPND estimation5 by applying a linear simplified reference tissue model (LSRTM).
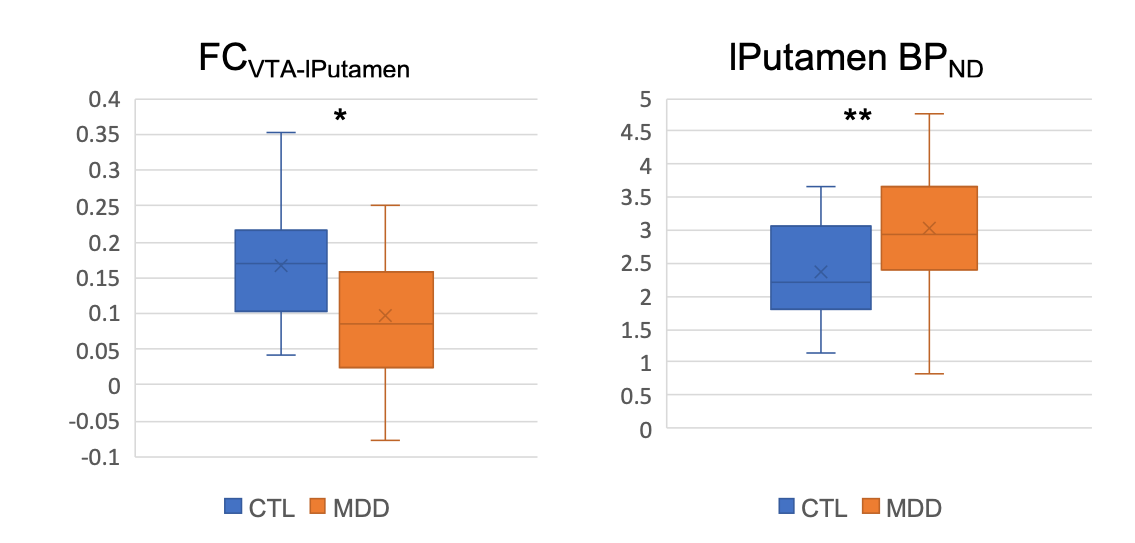
Group Analysis: A two sample t-test was conducted for seed-based functional connectivity comparison between MDD and CTL groups in striatum. Regions showing group differences were extracted for further BPND comparison. The statistical significance criterion was set at p<0.05, FDR-corrected for multiple comparisons.
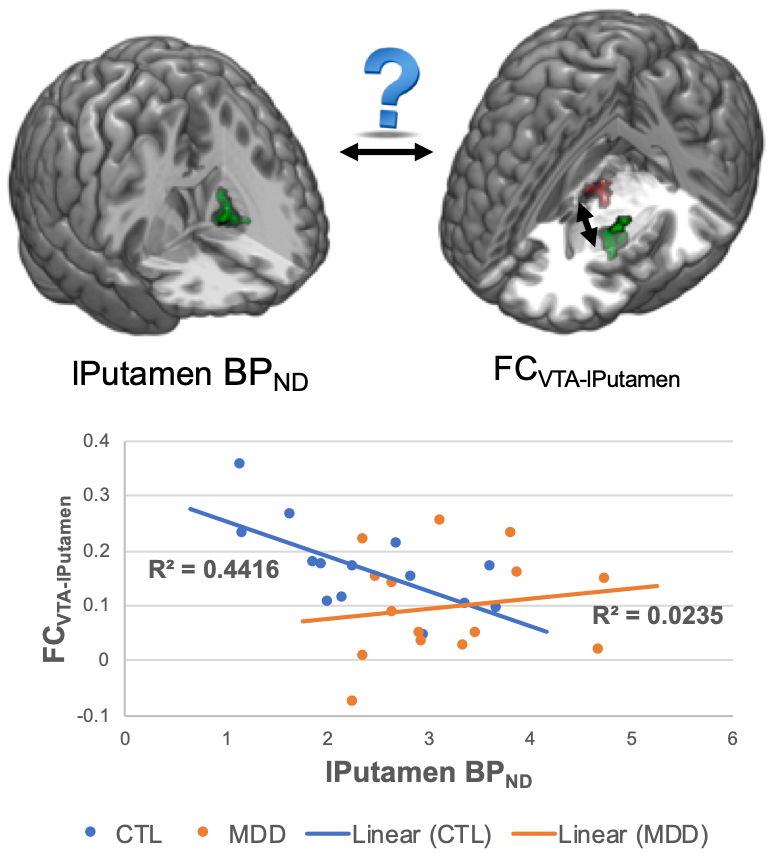
Correlation Analysis: BPND from regions which showed group difference - left putamen - was extracted to correlate to the VTA to left putamen functional connectivity (Fig. 4) for CTL and MDD groups separately.
Results
Functional connectivity & BPND: Consistent with previous literatures, group analysis revealed a reduced VTA to bilateral putamen FC in MDD compared with CTL (Fig. 2, Fig. 3), while the BPND in left putamen was significantly higher in MDD than CTL (p=0.007) (Fig. 3).
Correlation Analysis: For the CTL group, BPND in left putamen was correlated with the functional connectivity of VTA to left putamen (p=0.007) (Fig. 4). However, no significant correlation was observed for the MDD group as we hypothesized.
Discussion and Conclusion
We conducted a
concurrent PET-fMRI study to explore the relation between baseline dopamine binding
potential and functional connectivity of dopaminergic system and reward network
for MDD. As we hypothesized, there was a significant correlation in CTL, which
might indicate the regular information transfer from midbrain to striatum
through mesolimbic pathway. While in MDD the correlation was disrupted, it
might reflect the failure of dopamine triggering the reward network’s activity,
and the disconnection between dopaminergic system and striatum may be a key
factor in the development of MDD.Acknowledgements
We thank Prof. Brian Knutson for assistance with the task design, Matthew Sacchet, Hershel Mehta and Christina Schreiner for scanning. This work was supported in part by NIH EB015891 (GG, JC) and Weston Havens Foundation (IHG, JPH).References
1. Kumar, P., et al., Impaired reward prediction error encoding and striatal-midbrain connectivity in depression. Neuropsychopharmacology, 2018. 43(7): p. 1581-1588.
2. Meyer, J.H., et al., Elevated putamen D(2) receptor binding potential in major depression with motor retardation: An [(11)C] raclopride positron emission tomography study. American Journal of Psychiatry, 2006. 163(9): p. 1594-1602.
3. Zhang, X., Dopamine Release and Neural Activation Differs between Control and MDD during Reward Anticipation: a Simultaneous [11C]Raclopride PET-fMRI Study. Proc. Intl. Soc. Mag. Reson. Med., 2018.
4. Murty, V.P., et al., Resting state networks distinguish human ventral tegmental area from substantia nigra. Neuroimage, 2014. 100: p. 580-589.
5. Hamilton, J.P., Striatal dopamine deficits predict reductions in striatal functional connectivity in major depression: A concurrent 11C-raclopride positron emission tomography and functional magnetic resonance imaging investigation. Translational Psychiatry, In press.
Figures