0207
Functional Magnetic Resonance Electrical Impedance Tomography of Aplysia abdominal ganglion1Arizona State University, Tempe, AZ, United States
Synopsis
Functional Magnetic resonance electrical impedance tomography (
Introduction
Functional Magnetic resonance electrical impedance tomography (fMREIT) is a novel neural activity imaging technique1,2,3. In MREIT, an external trickle current is injected to the tissue, synchronized with a pulse sequence. Changes in the cell membrane conductivity during neural activity should be reflected in MREIT current flow patterns, resulting in differential phase accumulation in phase images. The Aplysia abdominal ganglion (AAG) was used as a source of spontaneous activity in our study. We employed a potassium chloride (KCl) solution to stop the AAG activity4. The results from the treatment group (KCl) were compared to results from the control group that had artificial sea water (ASW) administered.Materials and Methods
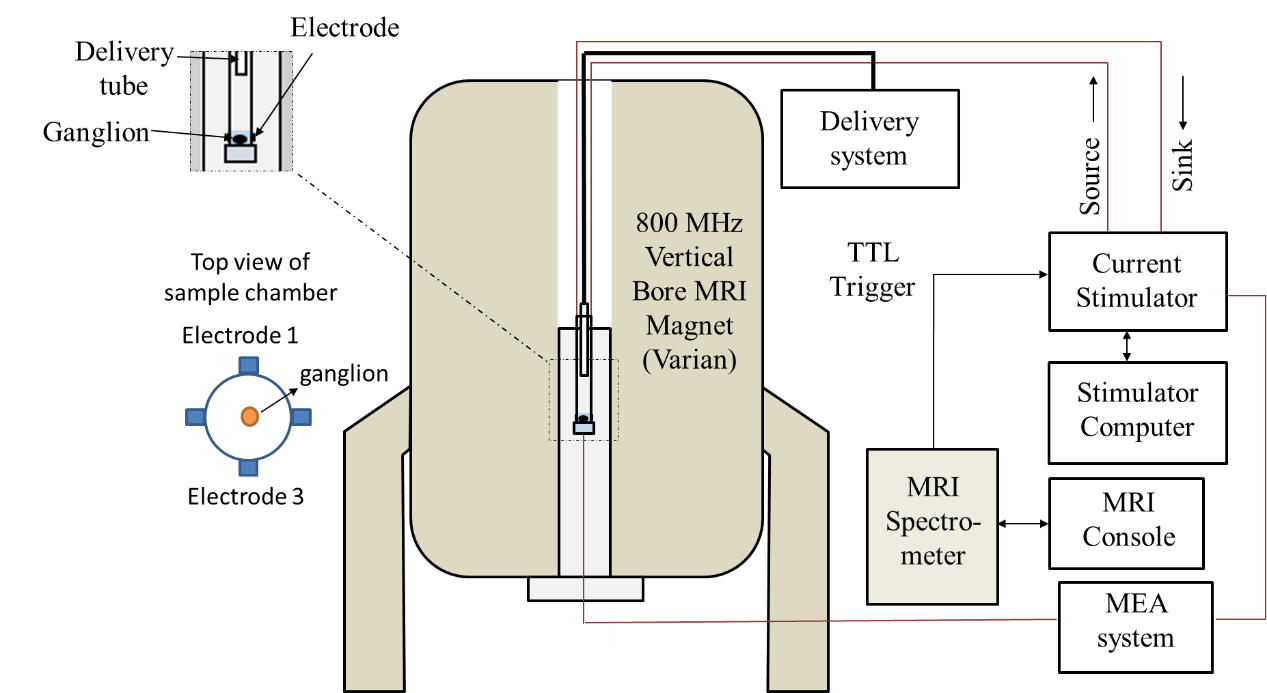
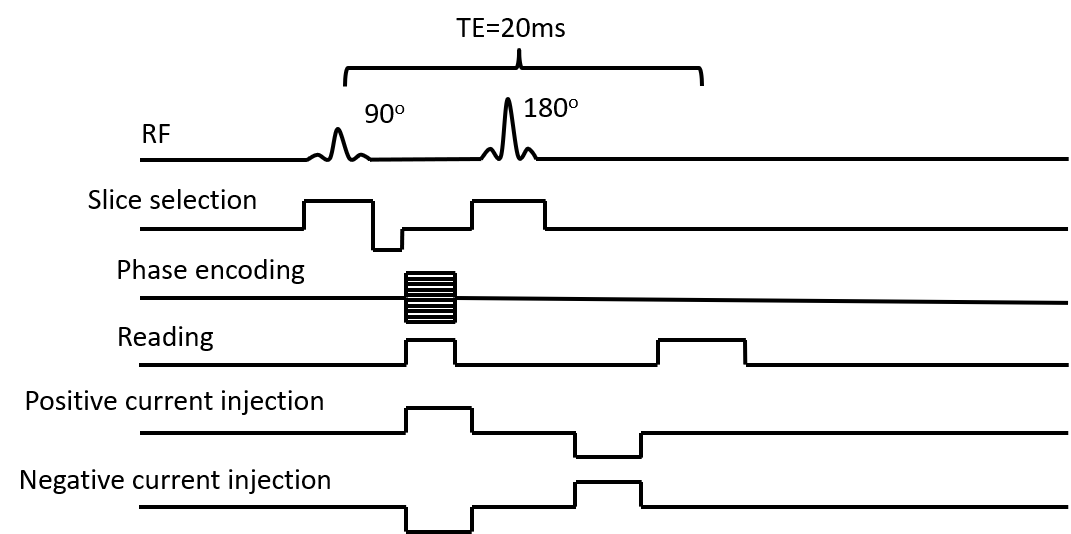
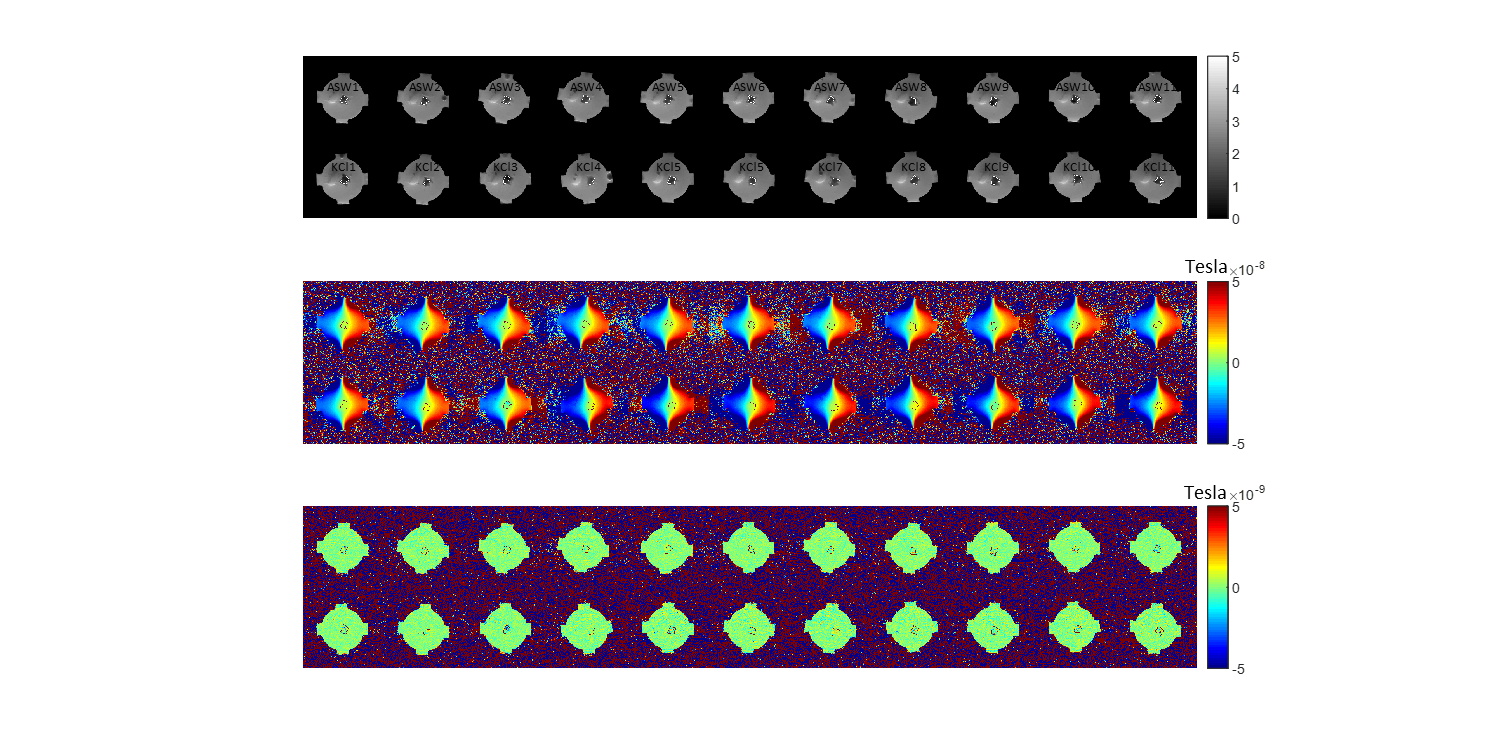
Small juvenile Aplysia were obtained from the NIH/University of Miami National Resource for Aplysia Facility. Animals were anesthetized with a magnesium chloride solution. The AAG was removed and placed on a flexible multi-electrode array (flexMEA) (Multichannel Systems, Reutlingen, Germany) within a 3D-printed sample chamber. Multichannel Systems MC_Rack software was used to monitor neural activity recorded on the MEA. The sample chamber was then placed into an MR imaging probe (Doty Scientific, Columbia, SC), within an 800MHz VNMRS system. The sample chamber had 4 equally-spaced circular carbon electrodes attached on the wall. The top view of the sample chamber is shown in Figure 1. An amplitude of 1 mA and total pulse width of 18 ms external current was injected into the chamber between an opposing pair of electrodes (1, 3) by using a constant current source (TDT Inc., Alachua, FL). During data acquisition, the current injection was synchronized with a spin echo MRI sequence (Fig. 2). Imaging parameters used were TR/TE = 300/20 ms, FOV = 14 x 14 mm2, slice thickness = 1mm, NEX = 12, matrix size = 256 x 256 (pixel dimension 55 µm) and number of slices = 1. Each scan took 15 mins to acquire. The MREIT phase images were obtained by complex division (subtraction) of positive- and negative-current-injected MRI data. A solution with increased KCl concentration was made by adding 9 g KCl to 40 ml ASW and was administered to stop the neural activity in the treatment group. Eleven Aplysia were used in each treatment or control group. fMREIT imaging was interleaved with flexMEA recordings lasting five minutes each. There were eight fMREIT scans performed in total for each animal, four before solution administration and four after. The first two scans were with the current application via electrodes 1 and 3 (separate positive- and negative-current-injection images). This was repeated for the third and fourth scans. The same protocol was followed after the solution (control or treatment) was administered. MREIT phase images were obtained by complex dividing positive and negative current MRI data. A region of interest (ROI) within the tissue was chosen (Fig. 3) as well as a similar-size ROI in the background media. The standard deviation in phase data (scaled to magnetic flux density) and phase Laplacians within the tissue and background ROIs were then calculated and compared.Results
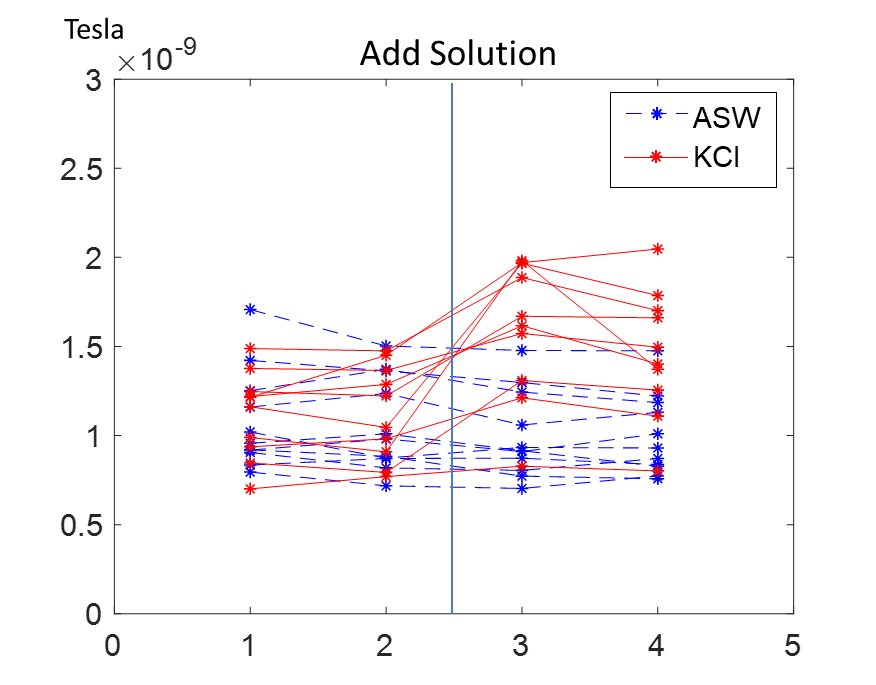
Example results for the standard deviation of Laplacian phase data are plotted in Figure 4. Because KCl increases and then stops ganglion neuronal activity4, this caused the average membrane conductivity of AAG to be more variable. This was reflected in the time course of Laplacian standard deviations observed in subtracted MREIT phase images. The ROI standard deviations found for the control group (ASW administered) animals were observed to be less variable than those treated with KCl.Discussion
The Laplacian standard deviation differences could be caused by conductivity changes in individual ganglion cell membranes. In future work, we will use pixel-by-pixel statistical analysis on phase images from multiple ganglia with and without neuronal activity. The MEA recordings will be co-registered with MR images to determine if the results are related to changes in spiking activity levels at lower levels. This may be useful in studies of cell neuromodulation as the need to insert electrodes would be avoided.Conclusion
fMREIT may have the potential to directly image neuronal activity. The contrast dependence on current injection should make it possible to use fMREIT to study the mechanism of neuromodulation techniques such as transcranial direct-current stimulation (tDCS) or deep brain stimulation (DBS).Acknowledgements
This research was supported by the National Institute Of Neurological Disorders and Stroke of the National Institutes of Health under Award Number R01NS077004 to RJS.References
Sadleir RJ, Grant S, Woo EJ. Can high-field MREIT be used to directly detect neural activity? Theoretical considerations. NeuroImage 2010;52(1):205-216.
Seo JK, Woo EJ. Magnetic resonance electrical impedance tomography (MREIT). SIAM review 2011;53(1):40-68.
Sadleir RJ, Fu F, Falgas C, Holland S, Boggess M, Grant SC, Woo EJ. Direct detection of neural activity in vitro using magnetic resonance electrical impedance tomography (MREIT). NeuroImage 2017;161:104-119.
Fu F, Chauhan M, Sadleir R. The effect of potassium chloride on Aplysia Californica abdominal ganglion activity. Biomedical Physics & Engineering Express. 2018 Apr 11;4(3):035033.
Figures