0206
Simultaneous fMRE and fMRI measures the viscoelastic and BOLD responses of the human brain to functional activation in the visual cortex1Bioengineering, Stanford University, Stanford, CA, United States, 2Radiology, Mayo Clinic, Rochester, MN, United States, 3Radiology, Stanford University, Stanford, CA, United States
Synopsis
Here, we demonstrate a novel multi-modal method to simultaneously acquire robust fMRE and fMRI activation maps. A block paradigm of 24s ON (flashing checkerboard at 10Hz) and 24s OFF (fixation cross) was used and images were acquired with a single-shot spin-echo EPI MRE sequence. Our results show that tissue stiffness within the visual cortex increases 6-12% with visual stimuli. Furthermore, the fMRE and fMRI activation maps agree and overlap spatially within the visual cortex, providing convincing evidence that fMRE is possible in the cortex.
Introduction
Brain tissues are viscoelastic, and their shear modulus (“stiffness”) properties can be measured via MR elastography, a technique that uses phase-contrast to acquire images of wave propagation in tissue as induced by an external source of mechanical vibration. Recent functional MRE (fMRE) studies have shown contradicting results of both increasing (1) and decreasing (2,3) “stiffness” in regions of the brain due to external stimuli. These studies made observations by comparing a single “stimulus on” stiffness map with a single “stimulus off” stiffness map. In this abstract, we introduce a novel method for fMRE, utilizing time series analysis similar in concept to that employed in fMRI, to produce statistical parametric maps that show highly statistically significant stiffness activation consequent to visual stimulation. Our results indicate that stiffness within the visual cortex increases with visual stimulus. Furthermore, our novel method is inherently multi-modal. We use the same set of raw spin-echo images acquired with the MRE pulse sequence to generate both BOLD (fMRI) and stiffness (fMRE) activation maps. This allows us to compare the spatially localized BOLD and stiffness changes within the same scan, eliminating confounds inherent in separately acquired scans.Methods
Experimental setup:
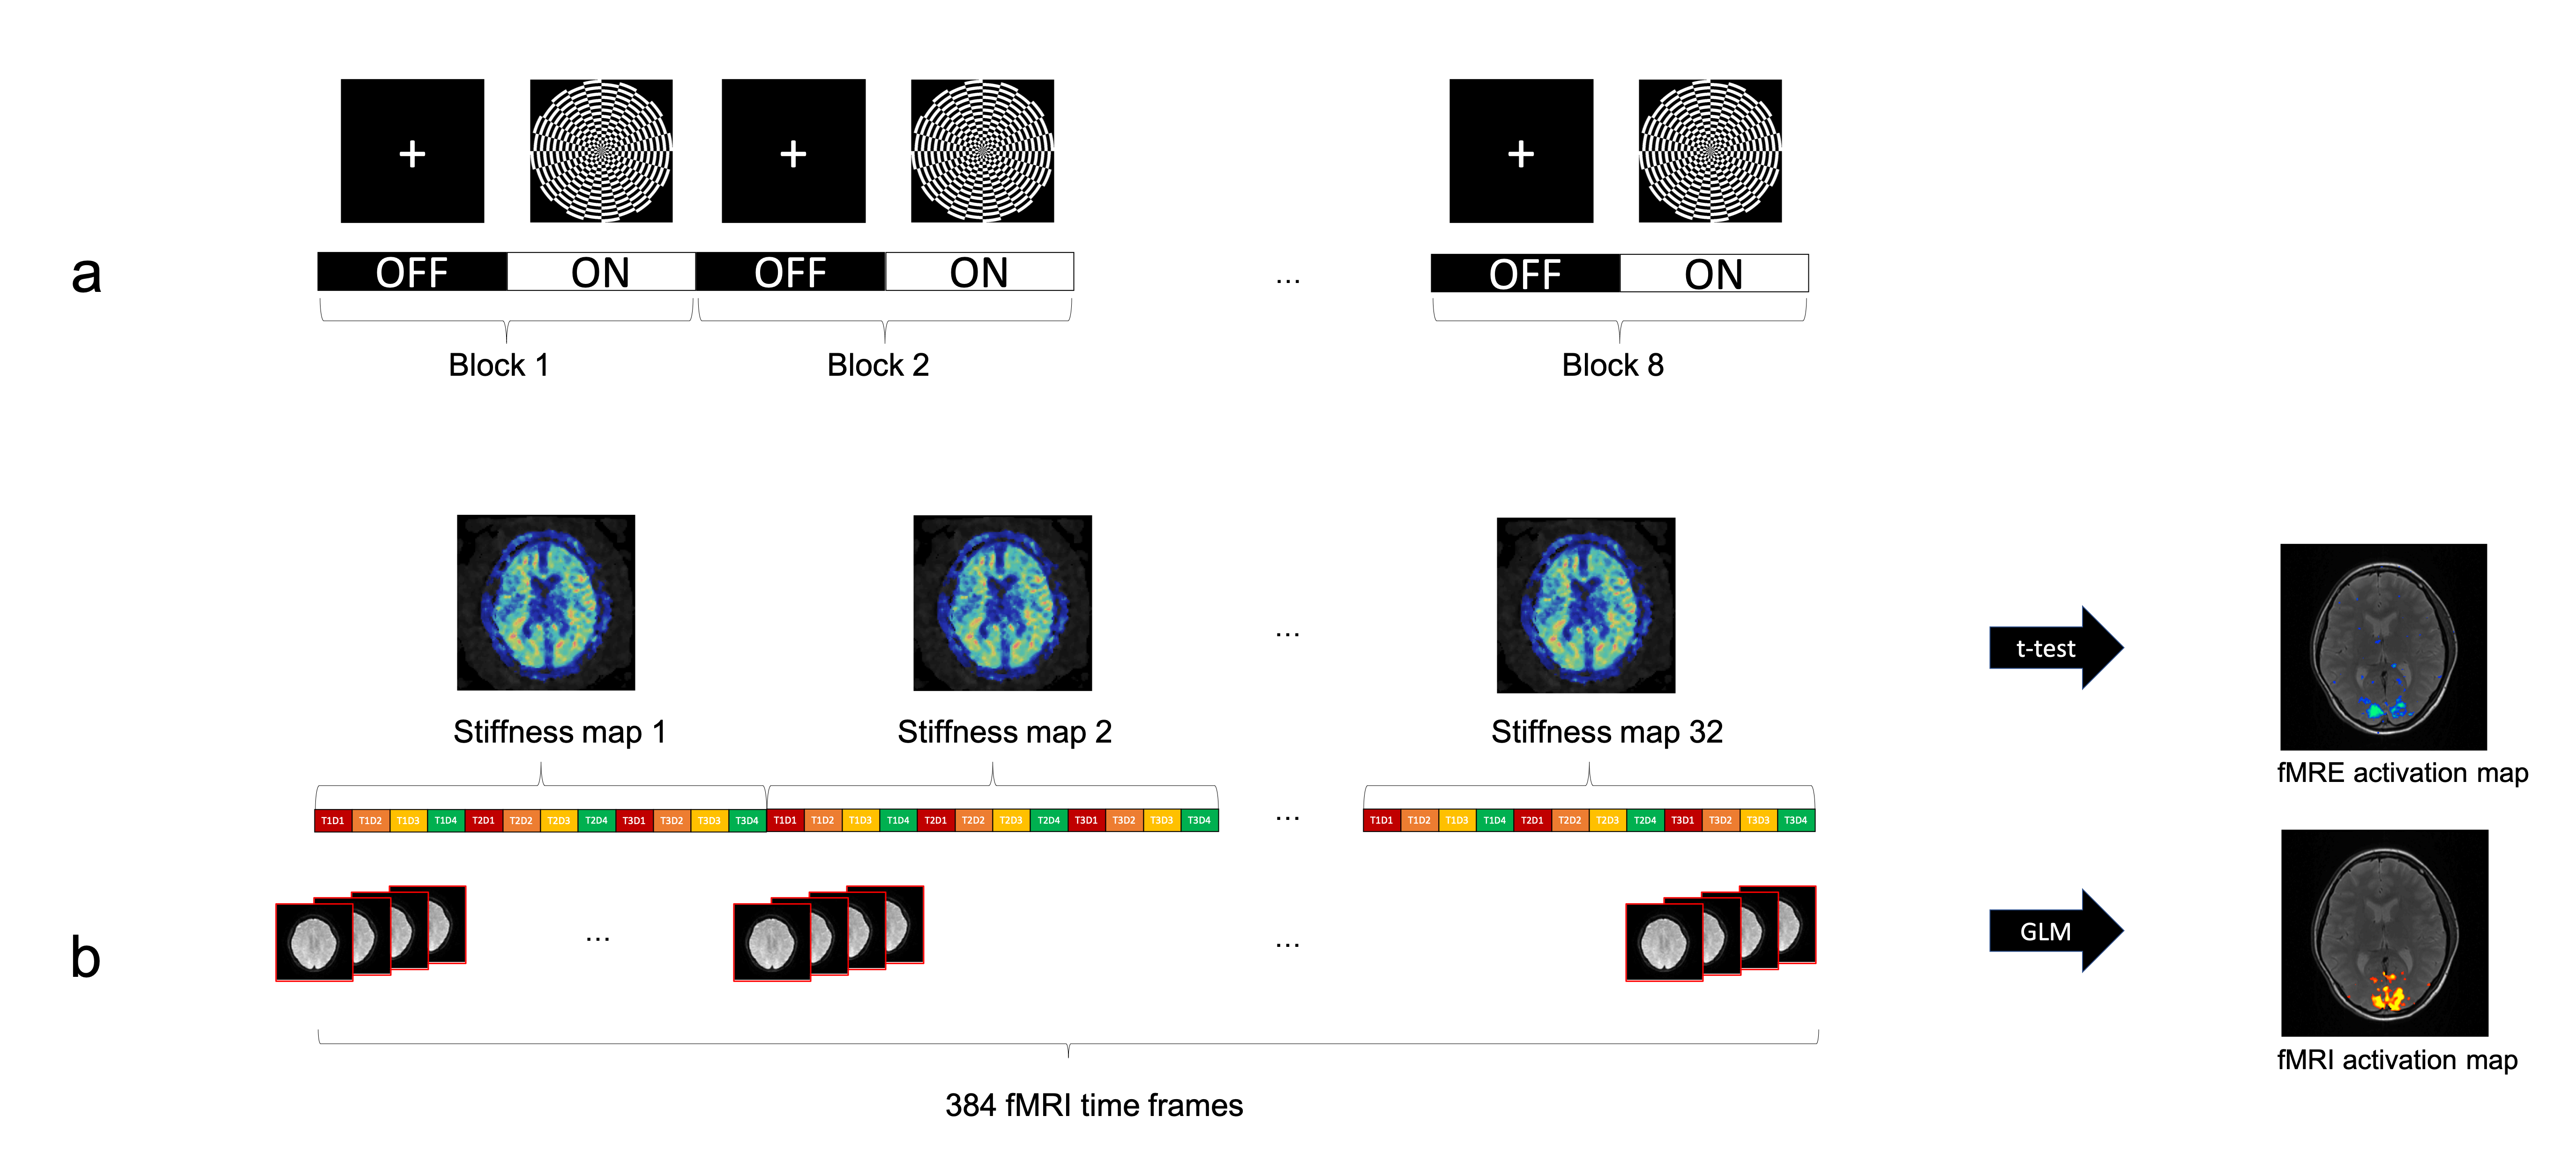
The functional scans were acquired using a block-design paradigm, with 8 blocks of 24s of contrast-reversing checkerboard visual stimulus flickering at 10Hz followed by 24s of fixation cross (Figure 1a).
Shear waves at 60Hz were induced in the brain using a pneumatic actuator connected to a soft, pillow-like passive driver placed under the subject’s head in a standard 8-channel receive-only coil as described by Murphy et al (4). Data from 3 healthy volunteers were acquired on a 3T-GE-Discovery MR-750 scanner using a single-shot, spin-echo EPI sequence with the following parameters: 12 contiguous oblique slices, TR/TE=1000/64.5ms, FOV=22cm, BW=+/-125kHz, 72x72 imaging matrix reconstructed to 128x128, 2x ASSET acceleration, 3.5mm thick slices, Hadamard motion-encoding (4 directions of motion-encoding gradients (MEGs)), and 3 phase-offsets sampled over one period of motion at 60Hz. The sequence of 4 MEGs x 3 phases was repeated 32 times for a total acquisition time of 384s (Figure 1b).
Processing & analysis:
Complex-valued images containing the motion in the X, Y, and Z directions were calculated from the 4 MEG directions. These volumes were smoothed in the Z direction using a 1D, 4th-order, Butterworth, low-pass filter with a cut-off frequency of 3 cycles per FOVz to reduce potential slice-to-slice phase jitter. The complex-valued shear modulus was then calculated as described by Murphy et al. and stiffness images were generated as the absolute value of the complex shear modulus (4,5). A standard two-sample t-test was performed on the 32 MRE “stiffness” time frames for fMRE activation maps (Figure 1b).
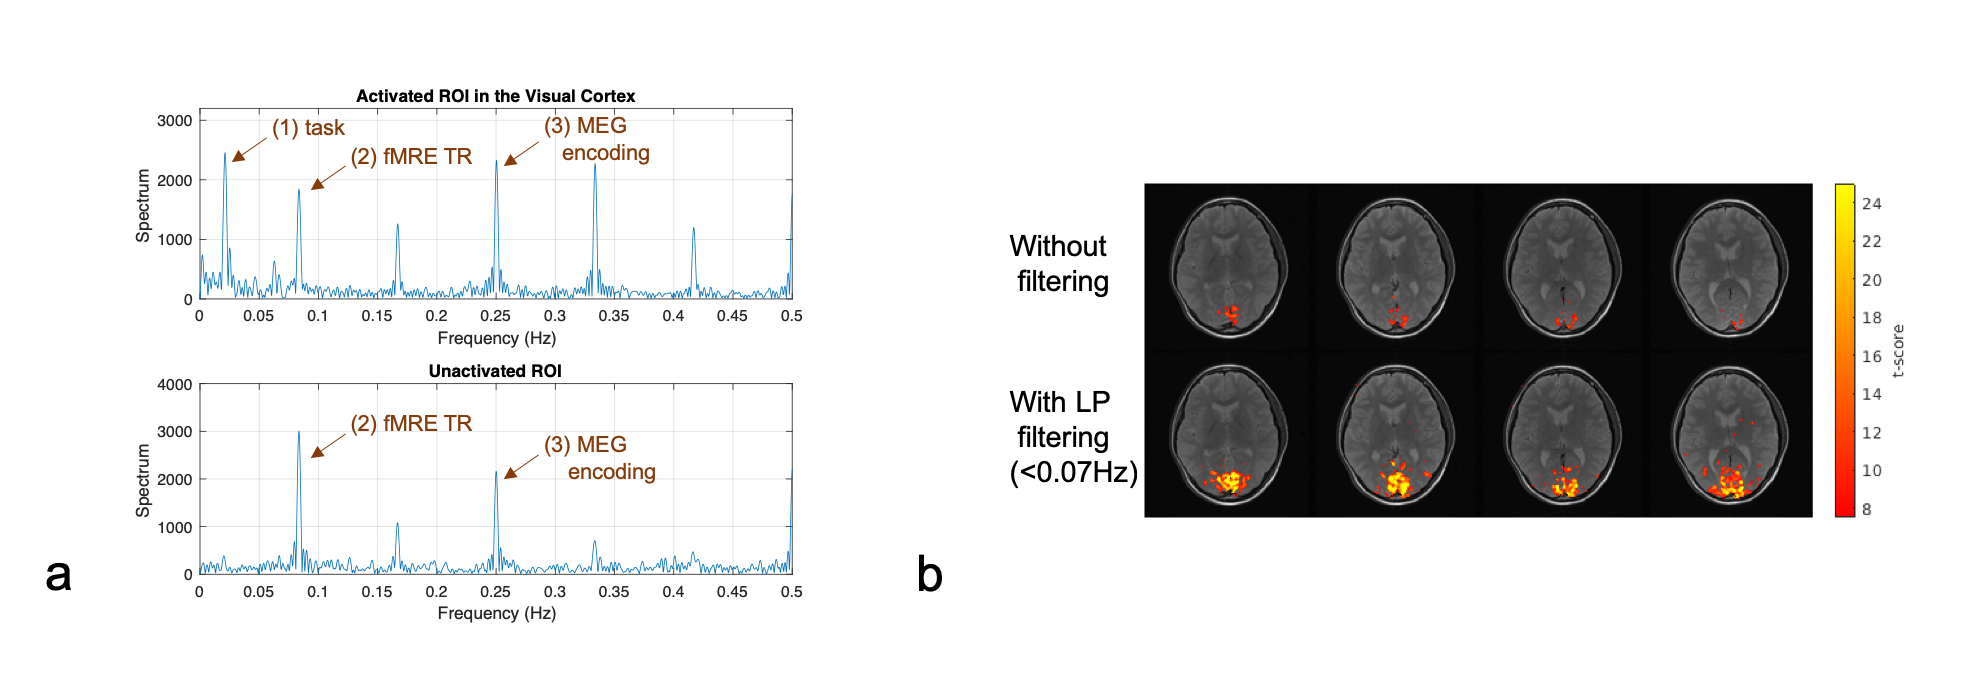
For fMRI, magnitude images were extracted from the same raw spin-echo images and low-pass filtered (<0.07Hz) to remove noise contribution from the MEGs and TRs peaks (Figure 2). GLM analysis was then performed on the 384 times frames to generate fMRI activation maps.
Results and Discussion
From the spectrum of the fMRI time series (Figure 2a), we see peaks at 0.25Hz and 0.083Hz due to the motion-encoding gradients, which create small periodic amplitude artifacts. By low-pass filtering (<0.07Hz), we were able to greatly increase the tSNR and thereby increase the t-scores of the activated voxels (Figure 2b).
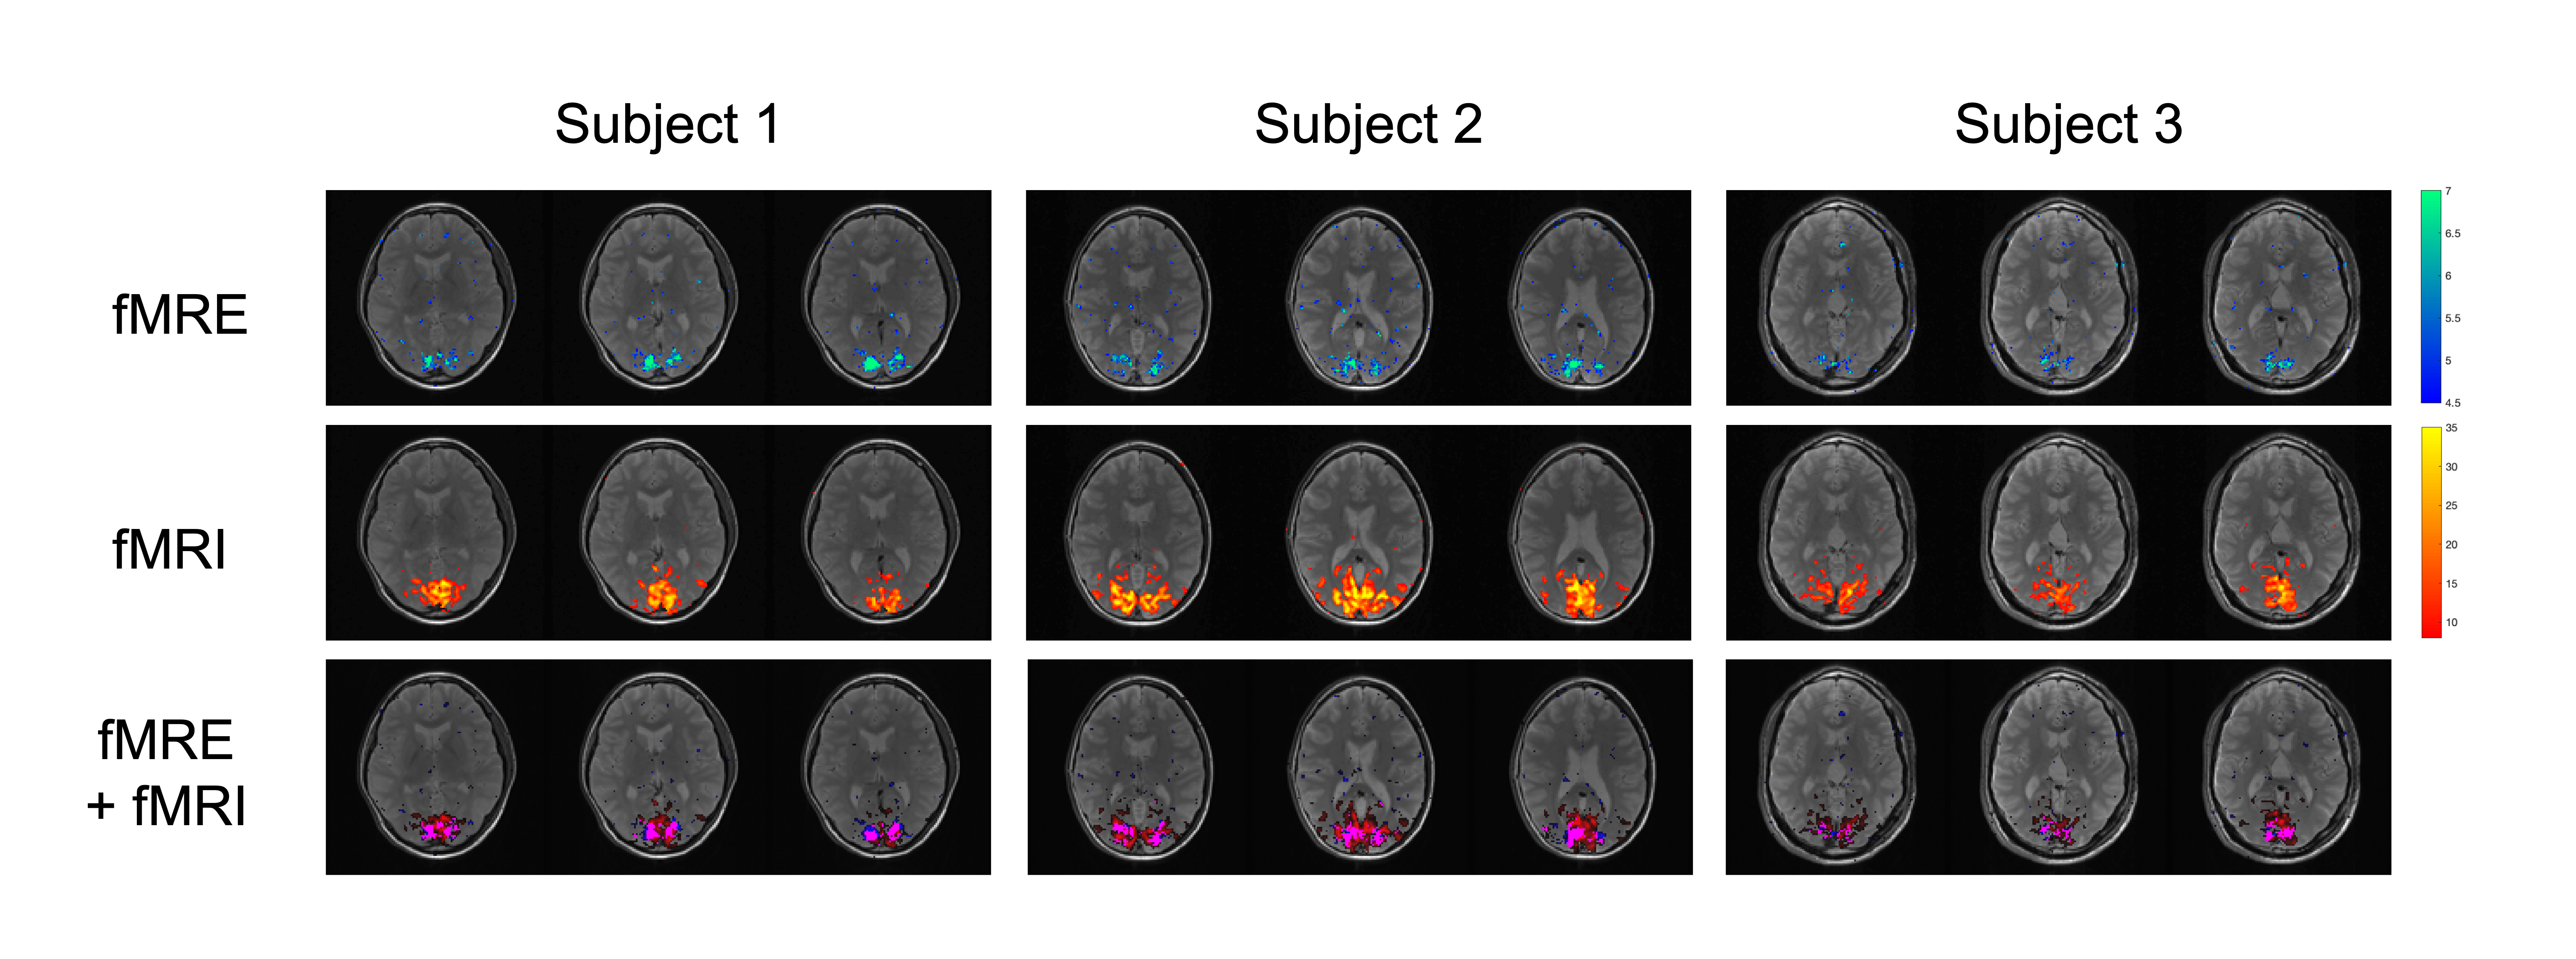
By taking the difference between the “ON” and “OFF” stiffness maps/frames, we see that the visual cortex increases in stiffness (~6-12%) when the visual stimulus is turned on, similar to the BOLD signal increasing when the visual stimulus is on. The fMRE activation maps show spatially localized stiffness changes in the visual cortex, similar to the BOLD activation maps (Figure 3). By overlaying the two activation maps, we see that the stiffness activation colocalizes with the BOLD activation in the visual cortex. This suggests convincing evidence that cortical fMRE is possible, even though previous studies have indicated that MRE in the cortex is susceptible to partial-volume artifacts (6,7); in this study the partial-volume effects remain constant between frames. Other results were also obtained with a motor planning task (not shown here).
Conclusion
In this study, we demonstrated that (1) very robust fMRE activation can be obtained using a novel time series method; (2) concurrent fMRE and fMRI is possible; and (3) fMRE and fMRI activation maps strongly overlap within the visual cortex. This opens up the possibility of a new form of multi-modal brain mapping in the human cortex using two widely different contrast mechanisms. The integration of both hemodynamic and viscoelastic signals may provide complementary information useful for understanding the underlying cognitive neurobiology mechanisms.Acknowledgements
Funding supplied by NIH-P41EB01589 and NIH-EB001981. We acknowledge Karla Epperson’s expertise in setting up the Resoundant pneumatic driver system.References
1. Patz S, Nazari N, Barbone PE, Fabry B, Fovargue D, Nordsletten D, Sinkus R. Functional Neuroimaging in the Brain using Magnetic Resonance Elastography. Abstract 242, ISMRM 2017; Honolulu, HI, USA.
2. Patz S, Fovargue D, Schregel K, Nazari N, Palotai M, Barbone PE, Fabry B, Hammers A, Holm S, Kozerke S, Nordsletten D, Sinkus R. Mapping Neural Circuitry at High Speed (10Hz) using functional Magnetic Resonance Elastography (fMRE). Abstract 704, ISMRM 2018; Paris, France.
3. de Arcos J, Fovargue D, Schregel K, Neji R, Patz S, Sinkus R. Imaging Primary Neuronal Activity in the Human Optical Cortex at 1.35Hz. Abstract 147, ISMRM 2018; Paris, France.
4. Murphy MC, Huston J, Jack CR, Glaser KJ, Manduca A, Felmlee JP, Ehman RL. Decreased brain stiffness in Alzheimer's disease determined by magnetic resonance elastography. J Magn Reson Imaging 2011;34(3):494-498.
5. Manduca A, Oliphant TE, Dresner MA, Mahowald JL, Kruse SA, Amromin E, Felmlee JP, Greenleaf JF, Ehman RL. Magnetic resonance elastography: non-invasive mapping of tissue elasticity. Med Image Anal 2001;5(4):237-254.
6. Hetzer S, Birr P, Fehlner A, Hirsch S, Dittmann F, Barnhill E, Braun J, Sack I. Perfusion alters stiffness of deep gray matter. J Cereb Blood Flow Metab 2018;38(1):116-125.
7. Guo J, Hirsch S, Fehlner A, Papazoglou S, Scheel M, Braun J, Sack I. Towards an elastographic atlas of brain anatomy. PLoS One 2013;8(8):e71807.
Figures