0203
Spanning spatiotemporal scales with simultaneous mesoscopic calcium imaging and functional MRI1Department of Radiology and Biomedical Imaging, Yale University, New Haven, CT, United States, 2Department of Neurobiology, Yale University, New Haven, CT, United States, 3Department of Biomedical Engineering, Yale University, New Haven, CT, United States, 4Department of Neuroscience, Yale University, New Haven, CT, United States, 5Kavli Institute for Neuroscience, Yale University, New Haven, CT, United States, 6Program in Cellular Neuroscience, Yale University, New Haven, CT, United States, 7Neurodegeneration and Repair, Yale University, New Haven, CT, United States, 8Department of Statistics and Data Science, Yale University, New Haven, CT, United States, 9The Child Study Center, Yale University, New Haven, CT, United States, 10Department of Ophthalmology and Visual Science, Yale University, New Haven, CT, United States, 11Department of Neurosurgery, Yale University, New Haven, CT, United States, 12Interdepartmental Neuroscience Program, Yale University, New Haven, CT, United States
Synopsis
Neuroscience interrogates brain function across multiple spatiotemporal scales. Yet, most research is confined to one spatiotemporal milieu limiting translation of knowledge across scales. Here we span spatiotemporal scales having built a custom apparatus and analytical framework for simultaneous wide field mesoscopic Ca2+ imaging of the entire cortex and fMRI at 11.7T in mice. We describe the new hardware/software, and present three findings: there is correspondence between spontaneous fluctuations in the magnitude of Ca2+ and fMRI evoked responses, Ca2+ and fMRI connectivity metrics are stable throughout an imaging session, and there is correspondence between Ca2+ and fMRI spontaneous activity patterns.
Introduction
We describe a novel multi-modal imaging technology which combines Ca2+ imaging of the full cortical surface with whole brain fMRI. Novel hardware and software were developed for the collection and analysis of these data. Furthermore, we present results from data collected using transgenic mice expressing fluorescently labeled Ca2+ within excitatory neurons (N=6).
Simultaneous Ca2+ and BOLD data have been collected before.1-5 However, in previous works, only one fiber was implanted to record a fluorescence time series from an ROI. In the present work, we use as array of one million fibers to record data from the whole cortex. This dramatic increase in spatial coverage enables these multi-modal data to be analyzed in novel ways to tackle neuroscience questions which could not be asked using previous methods.
Methods
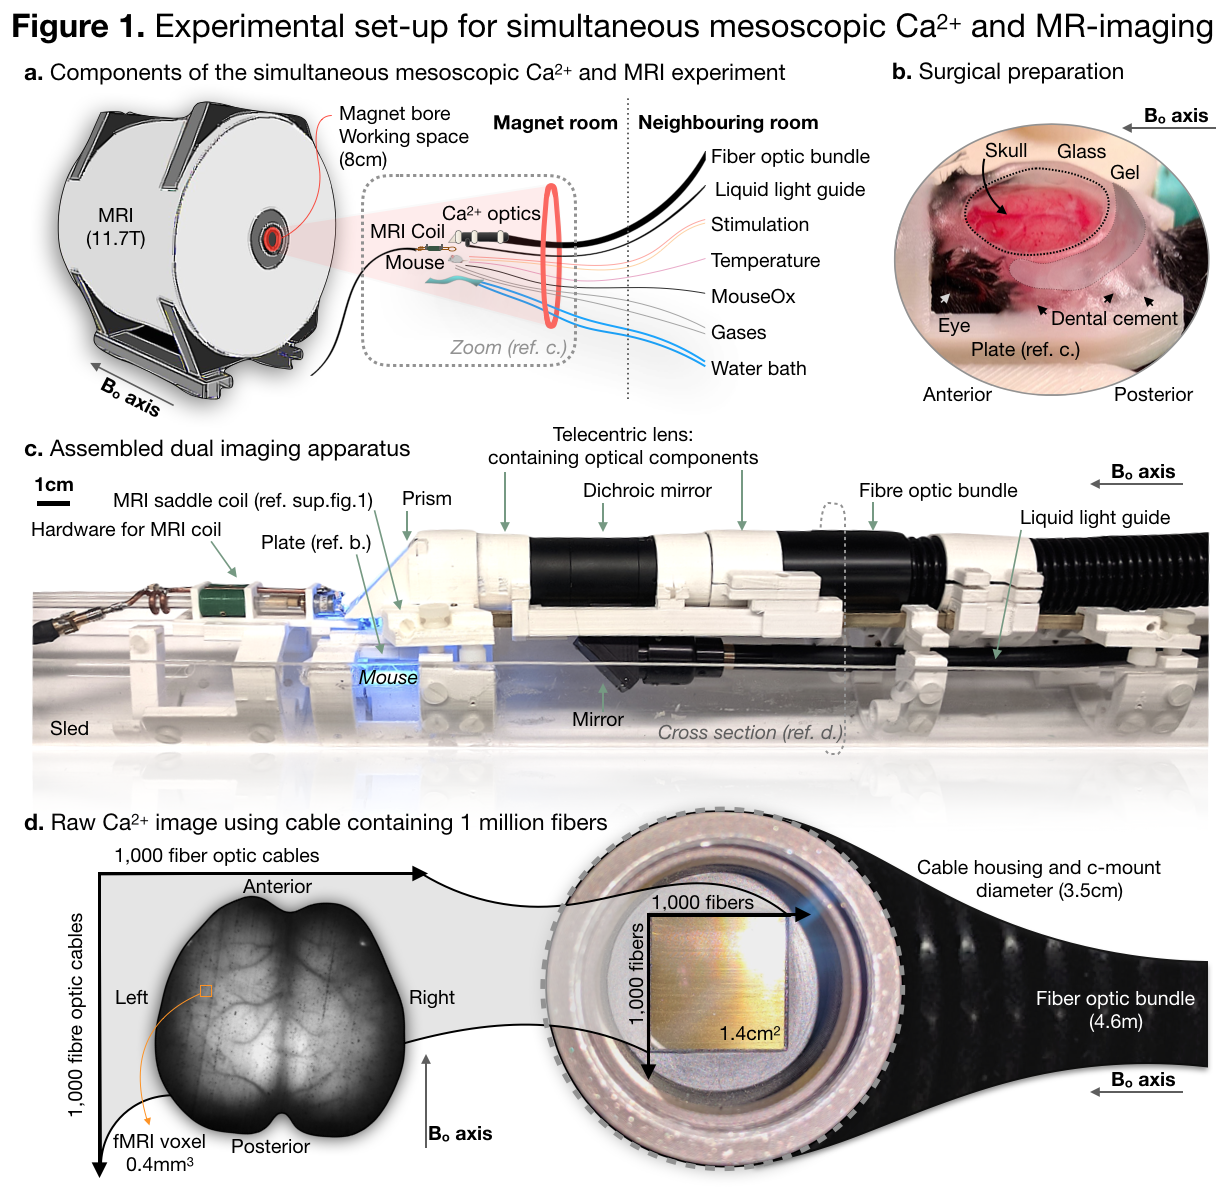
We image Ai193/CaMK2a-tTA/Slc17a7-Cre mice that express GCaMP6f in excitatory neuronal cell populations. Through intact-skull, Ca2+ data is collected simultaneously with BOLD-fMRI data (Figure 1) under light anesthesia (0.5-1.25% Isoflurane). We collect spontaneous activity and evoked responses to hind-paw stimulation (1mA, 5Hz, 5/55 seconds ON/OFF).
BOLD data are collected using a GE-EPI sequence (TR/TE=1000/9msec) at 0.4mm3. These data are motion corrected (AFNI)6, masked, spatially blurred within a mask (FWHM, 0.8mm), filtered (0.01-0.2Hz), the global signal is regressed, and the linear trend removed. The Ca2+ data are recorded at an effective rate of 0.1Hz. For background correction, violet (395/25) and cyan (470/24) illumination is interleaved: each at 0.05Hz. Exposure time for each channel is 40ms. These data are motion corrected, masked, baseline and drift corrected, the global signal is regressed, and the relative fluorescence ΔF/F calculated.7,8 ROIs in each modality of evoked responses are identified using generalized linear modeling. We compute Ca2+/BOLD functional parcellations and connectivity matrices using spontaneous activity data and multi-graph k-way clustering.9
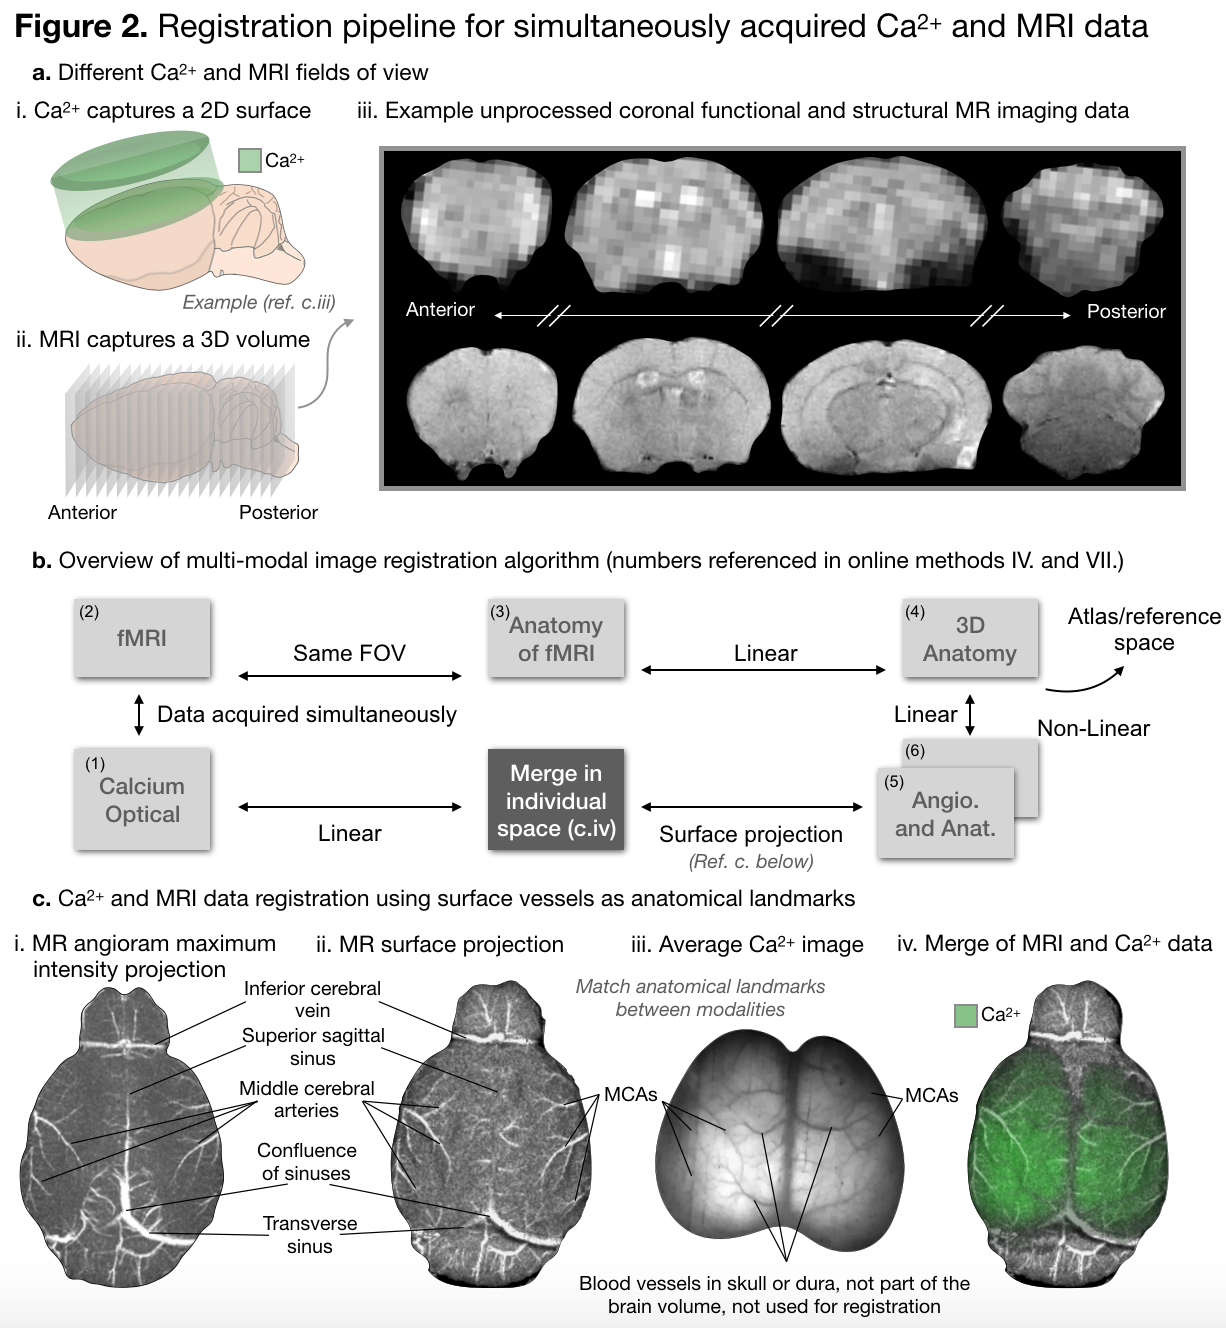
To move Ca2+ (2D-surface) and MR (3D-volume) images into the same space is a non-trivial registration problem, Figure 2. We accomplish this task using the anatomy of the vasculature on the surface of the cortex, which is visible in Ca2+ data and visualized by collecting a MR-angiogram (FLASH-TOF, TR/TE 130/4msec, yields a 0.05mm3 2.0x1.0x2.5cm3 image). All image registration is done using software developed in house (www.bioimagesuite.org).
Results
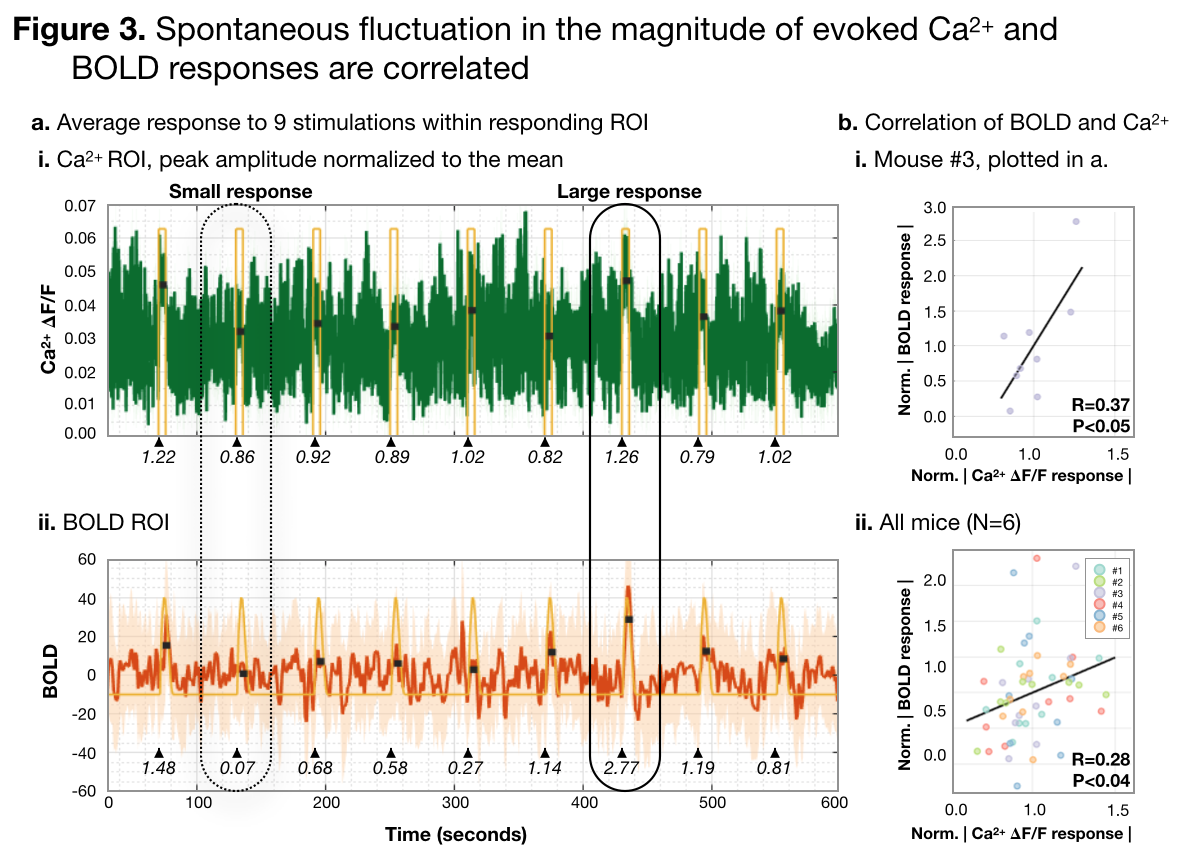
(1) From literature, larger/smaller elicited Ca2+ changes co-occur with larger/smaller BOLD signal changes when stimulus current/frequency is modulated.10 However, this does not realize the full potential of simultaneous imaging. Here, we hold the stimulus constant and probe for a relationship between spontaneous fluctuations in Ca2+/BOLD responses. We find that individual response amplitudes are moderately correlated, Figure 3. Given that individual responses are noisy, and that spontaneous fluctuations will have a small effect size, a moderate correlation is expected.
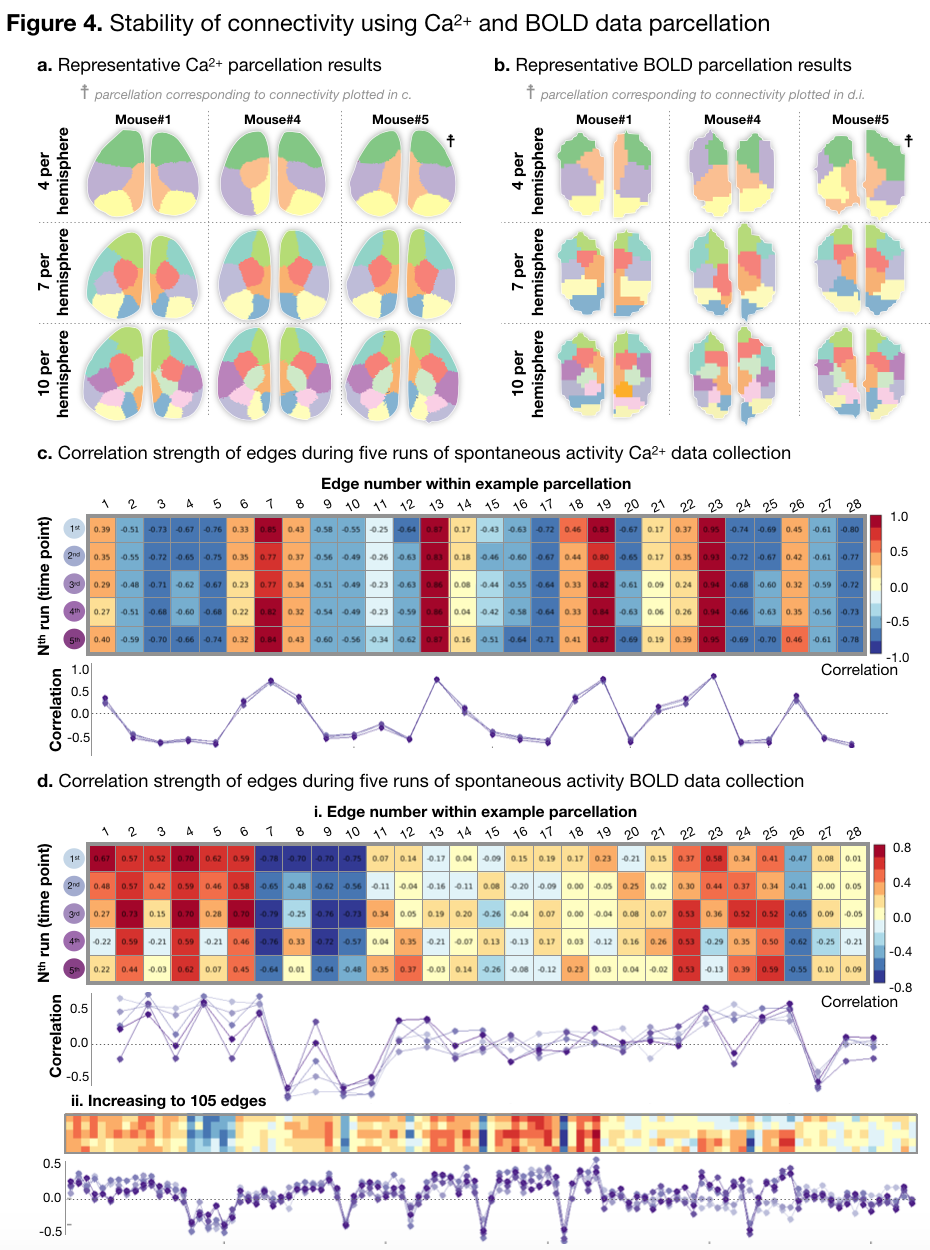
(2) We collect 5x10mins of spontaneous activity. Form these data we calculate Ca2+/BOLD parcellations which we apply to 10mins of data at a time, to calculate connectivity profiles that span the duration of our experiment (total 2.5hrs.). By computing the correlation of connectivity patterns across time points, we measure stability during our experiment. We find that connectivity is very stable, Figure 4.
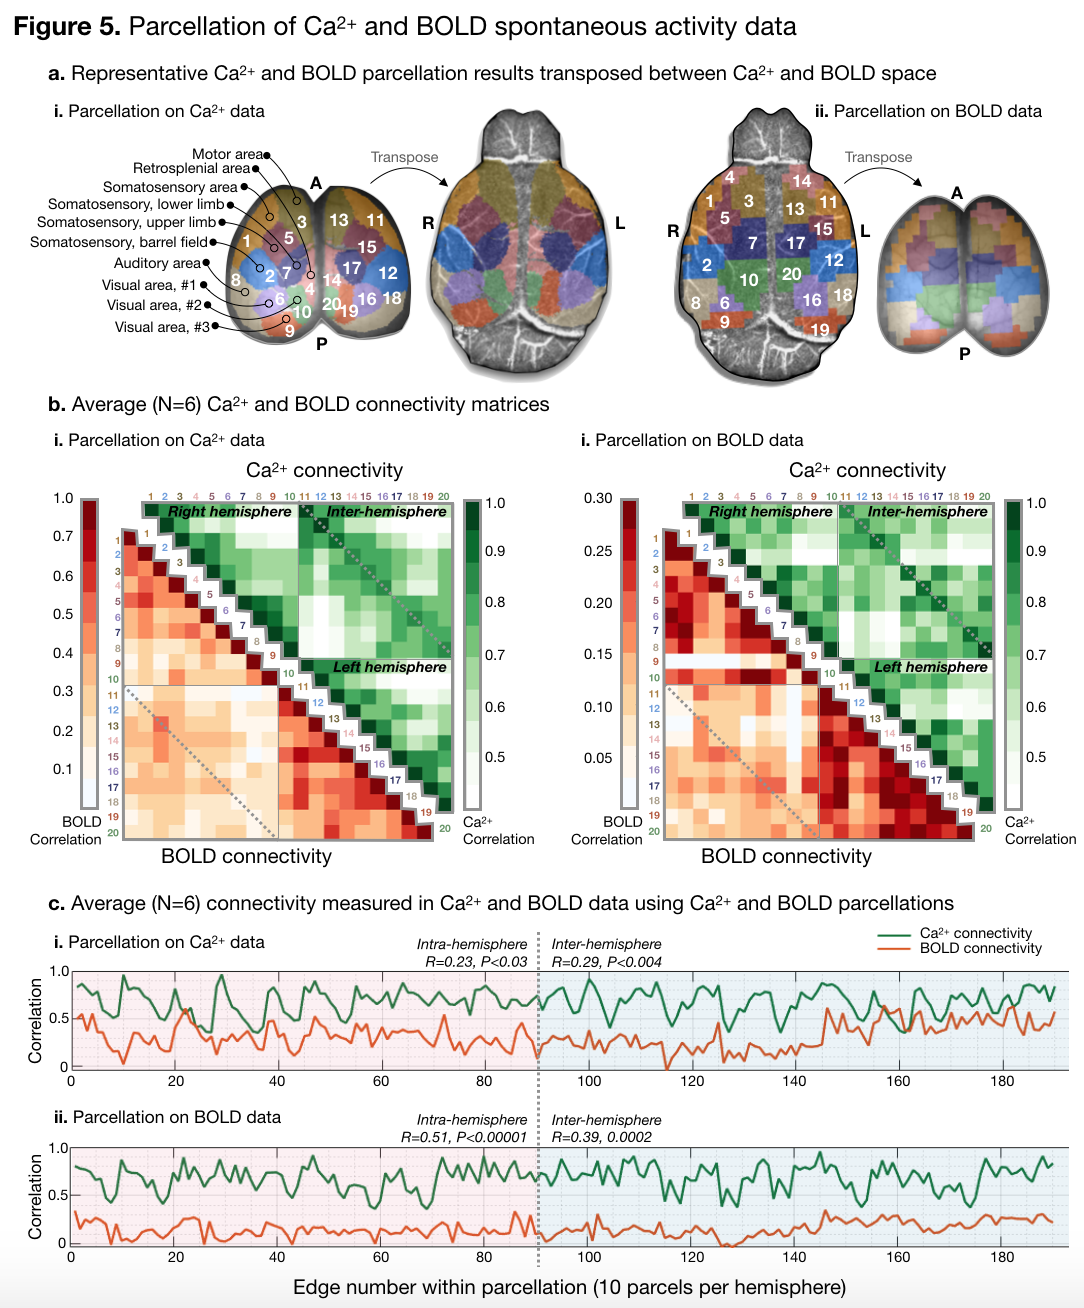
(3) With our multi-modal data in the same space, we transpose the Ca2+-parcellation onto the BOLD data, and the BOLD-parcellation onto the Ca2+ data (Figure 5), and examine parcel topology and patterns in connectivity. To quantify the similarity between Ca2+/BOLD activity patterns, we compute the correlation between Ca2+ and BOLD connectivity. We find connectivity patterns show a moderate-strong relationship between modalities. In other words, regions which show high/low synchrony in Ca2+ also show high/low synchrony in BOLD.
Discussion
New hardware and software were developed to enable the collection and analysis of these data. The hardware is <$60,000 and we have made the software available online. Thus, this method can be duplicated by fellow researchers. In addition, we show three results chosen to demonstrate method sensitivity and stability.Conclusion
The technology presented here is a tool which can be used to provide a firmer biological basis for understanding the functional organization of the brain in health and disease. With a direct link to an imaging contrast available in human subjects, the fundamental insights that can be gained stand to have a highly translatable impact on how we understand, analyze, and manipulate brain activity.Acknowledgements
R01 MH111424, NIH, NIMH
U01NS094358, NIH
References
- Schulz K, Sydekum E, Krueppel R, Engelbrecht CJ, Schlegel F, Schröter A, Rudin M, Helmchen F. Simultaneous BOLD fMRI and fire-optic calcium recording in rat neocortex. Nat Methods. 2012; 9(6): 597-602.
- Liang Z, Ma Y, Watson GDR, Zhang N. Simultaneous GCaMP6-based fiber photometry and fMRI in rats. J Neurosci Methods. 2017; 289: 31-38.
- Schwalm M, Schmid F, Waschsmuth L, Backhaus H, Kronfeld A, Aedo Jury F, Prouvot PH, Fois C, Albers F, van Alst T, Faber C, Stroh A. Cortex-wide BOLD fMRI activity reflects locally-recorded slow oscillation-associated calcium waves. Elife. 2017; 6; e27602.
- Albers F, Wachsmuth L, van Last TM , Faber C. Multimodal functional neuroimaging by simultaneous BOLD fMRI and fibre-optic calcium recordings and ontogenetic control. Mol Imaging Biol. 2018; 20(2): 171-182.
- Schlegel F, Sych Y, Schroeter A, Stobart J, Weber B, Helmchen F, Rudin M. Fibre-optic implant for simultaneous fluorescence-based calcium recordings and BOLD fMRI in mice. Nat Protoc. 2018; 13(5):840-855.
- Cox RW. AFNI: software for analysis and visualization of functional magnetic resonance neuroimages. Comput Biomed Res. 1996; 29,162-73.
- Wekselblatt JB, Flister ED, Piscopo DM, Niell CM. Large-scale imaging of cortical dynamics during sensory perception and behavior. J Neurophysiol. 2016; 115(6): 2852-2866.
- Allen WE, Kauvar IV, Chen MZ, Richman EB, Yang SJ, Chen K, et al. Global representation fo goal-directed behaviorin distinct cell types of mouse neocortex. Neuron. 2017; 94(4): 891-907.
- Shen X, Tokoglu F, Papademetris X, Constable RT. Groupwise whole-brain parcellation from resting-state fMRI data for network node identification. Neuroimage. 2013; 82:403-15.
- Schulz K, Sydekum E, Krueppel R, Engelbrecht CJ, Schlegel F, Schröter A et al. Simultaneous BOLD fMRI and fibre-optic calcium recording in rat neocortex. Nat Methods. 2012; 9(6): 597-602.
Figures