0200
Noninvasive MRI mapping of malignant infiltration into lymph nodes1Champalimaud Foundation, Lisbon, Portugal, 2Centre for Medical Image Computing, UCL, London, United Kingdom
Synopsis
Mapping malignant infiltration into lymph nodes can have a critical impact on patient decision making. We predicted that multigradient echo (MGE) experiments could reflect cellularity and cell-size changes due to underlying susceptibility distributions. Lymph nodes extracted from rectal cancer patients exhibited the predicted non-monotonic and non-mono-exponential MGE signal decay, which provided insights into the underlying microstructure. A simple model distinguished benign from malignant nodal tissue and the differences were at least partially explained by differences in cellularity and cell size. These results can impact lymph node staging accuracy, as already corroborated by our pilot results in-vivo, upon rectal cancer staging, at 1.5T.
INTRODUCTION
Pathologic lymph node status of the mesorectum constitutes the most important determinant of local recurrence and overall survival in rectal cancer patients (1). Standard assessment is based on hematoxylin and eosin (H&E) stained slides (1), in which small, loosily-packed leucocytes contrast with large, tightly-packed malignant epithelial cells. Knowledge of lymph node status before surgery is determinant for accurate selection of patients for neoadjuvant therapy but is hampered by limited imaging accuracy (2,3).
Multigradient echo (MGE) signal decay has recently been proposed to characterize tissue microstructure due to susceptibility distributions differences arising from objects with different sizes and shapes within the voxel (4). We hypothesized that tumour infiltration into lymph nodes could be determined by such MGE signals, assessed this hypothesis using simulations, and tested its validity ex-vivo in lymph nodes from rectal cancer patients. Potential clinical implications are discussed.
METHODS
This study was approved by local ethics committee and informed consent was obtained from the patients.
1: Simulations
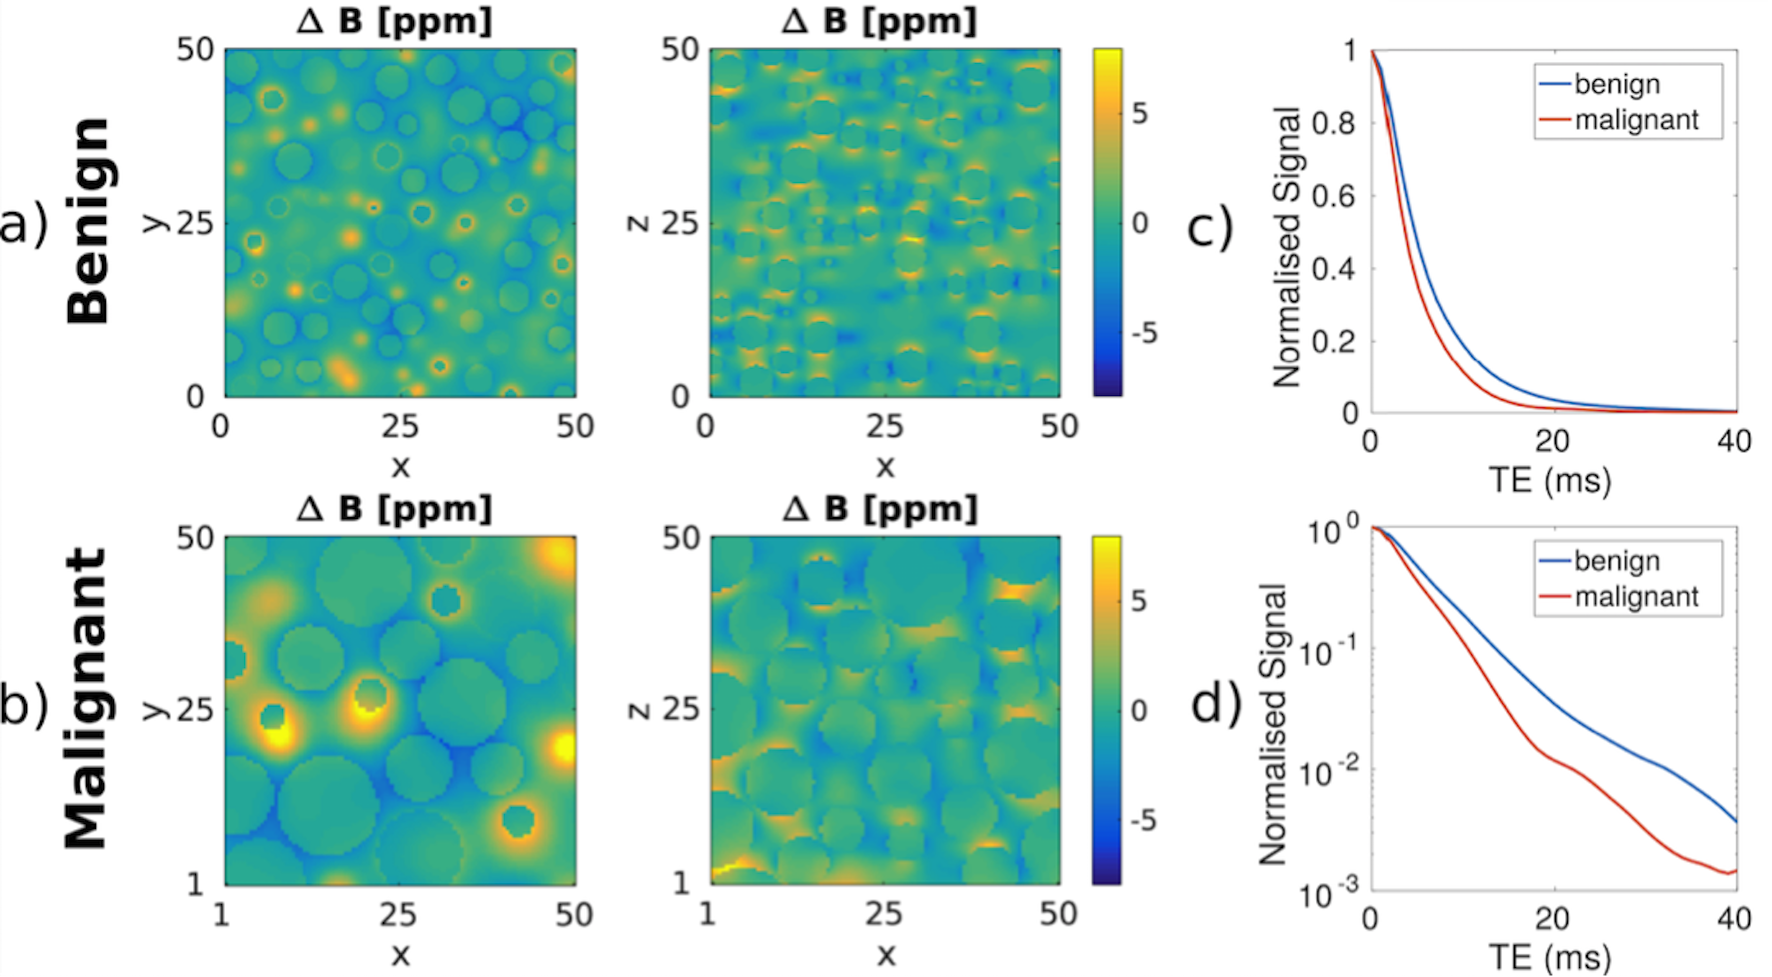
We first simulated susceptibility-driven magnetic field distribution maps arising from randomly packed spheres with 2 different configurations, guided by our histologic assessment: small size (x̅=12.2 μm2; SD=6.1 μm2) and intracellular volume fraction (24%) for benign nodal tissue; large size (x̅=92.7 μm2; SD=49.8 μm2) and intracellular volume fraction (61%) for tumour.
2: Ultrahigh field MGE of ex-vivo lymph nodes and histology matching
Then, we retrieved 29 benign and 35 malignant lymph nodes originating from the total mesorectal excision specimens of 11 N+ rectal cancer patients and acquired them at 37ºC on a 16.4T Bruker Aeon Ascend scanner using a Micro5 probe. A MGE acquisition was performed with the following parameters: 50 TEs starting at 1.6ms with 1.4ms interval, TR=1500ms, FA=50º, bandwidth=125kHz, ST=0.3mm, FOV= 12x12mm2,matrix=120x120, 25 NSAs (in-plane resolution=0.1x0.1mm2; total scan time=1h12m per node).
Scanned lymph nodes were embedded in paraffin and consecutive 4µm slices were cut every 50µm. One slice per interval was stained with H&E and analyzed by a gastrointestinal pathologist. Histology slides were scanned, stacked into a volume and registered to MGE images using SimpleElastix (5).
After denoising, benign and malignant histology matched regions of interest were defined in the most representative slice of each node. The mean magnitude signal value per node was computed for each TE and fitted to mono, bi and tri-exponential signal decay models, according to the equations 1, 2 and 3, respectively:
$$$S1C=S0.exp(-TE/T2*)$$$
$$$S2C=S0|fa.exp(-TE/T2*a)+(1-fa)exp[-TE(1/T2*b+i ∆ωb)]|$$$
$$$S3C=S0|fa-exp(-TE/T2*a)+fb-exp[-TE(1/T2*b+i ∆ωb)]+(-fa-fb)exp[-TE(1/T2*c+ i∆ωc)]|$$$
S0=signal at TE=0; T2*i=relaxation time of compartment i with a volume fraction=fi and frequency shift=∆ωi.
Voxel-by-voxel fitting to the compartment models analyzed was performed for the whole dataset. Measurements of cellularity and cell size were obtained from MGE-ROI-matching areas using Qupath®.
Signal decay models were compared based on Bayesian Information Criterion (BIC). To compare parameters extracted from the best performing model, Mann-Whitney U test was employed given data was not normally distributed. Spearman´s rank correlation test was used for statistical dependence assessment between model parameters and histology metrics. Bonferroni correction for multiple comparisons was employed.
RESULTS
1: Simulations
Numerical simulations results are represented in Figure 1 and reveal non-mono-exponential signal decay and stark differences between substracts, predicting slower decay for small spheres (benign tissue) compared to large spheres (tumour) and suggesting T2* measurements could inform about tissue microstructure.
2: Ultrahigh field MGE of ex-vivo lymph nodes and histology matching
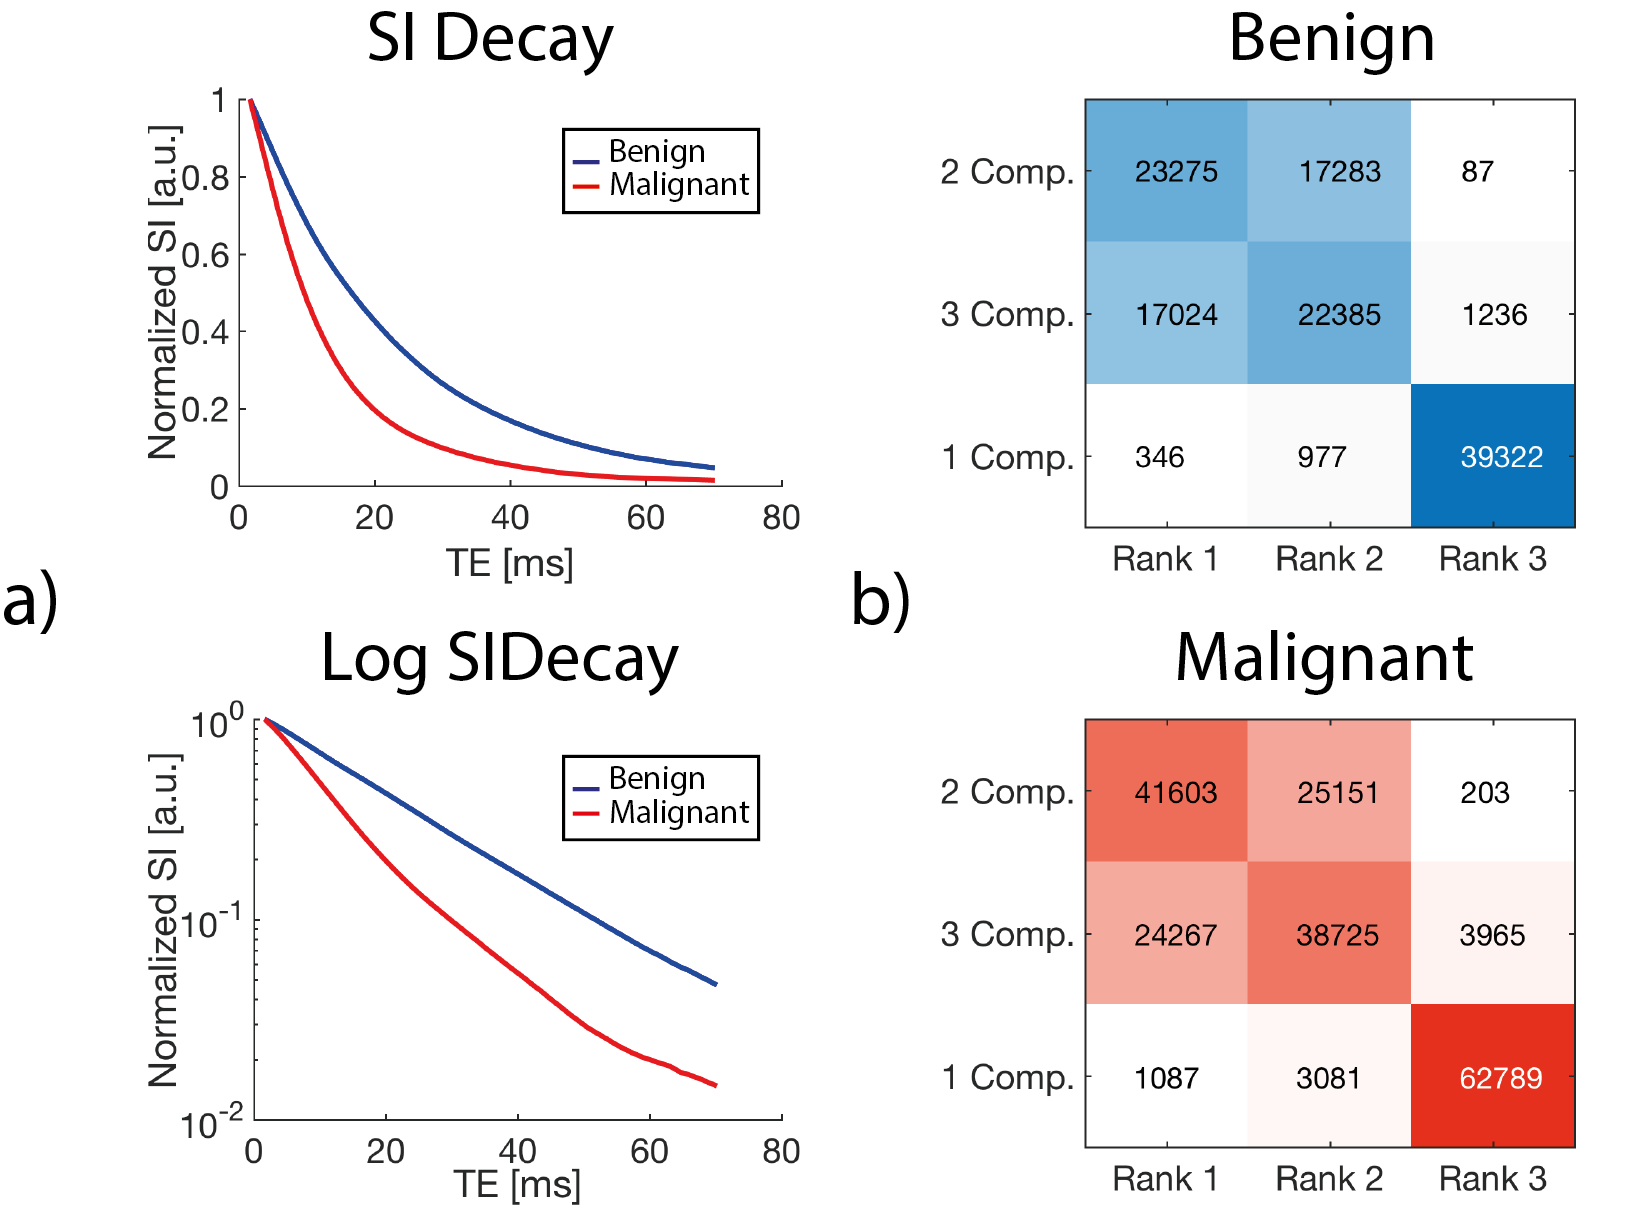
As depicted in Figure 2, the normalized average signal of our datasets approximated that predicted by simulations and BIC favored the 2-compartment model in both datasets.
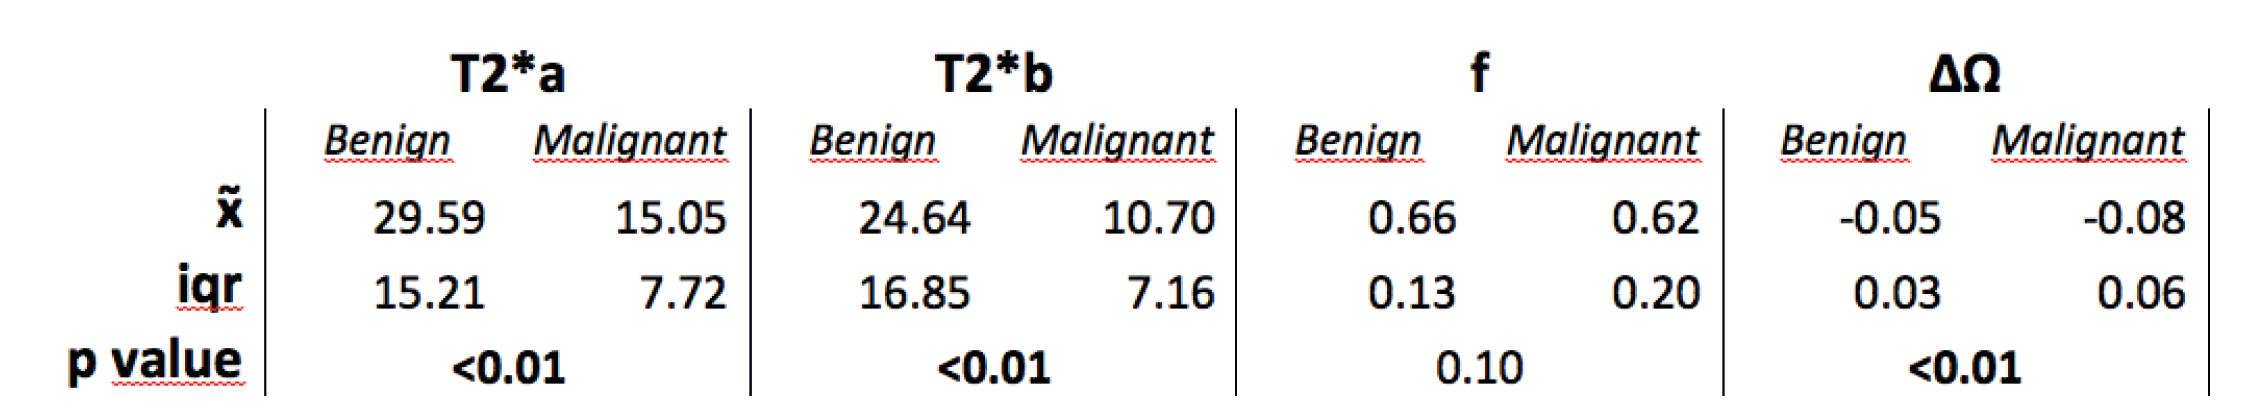
Quantitative differences in parameters derived from the 2-compartment model are shown in Figure 3, T2*b being most discriminative.
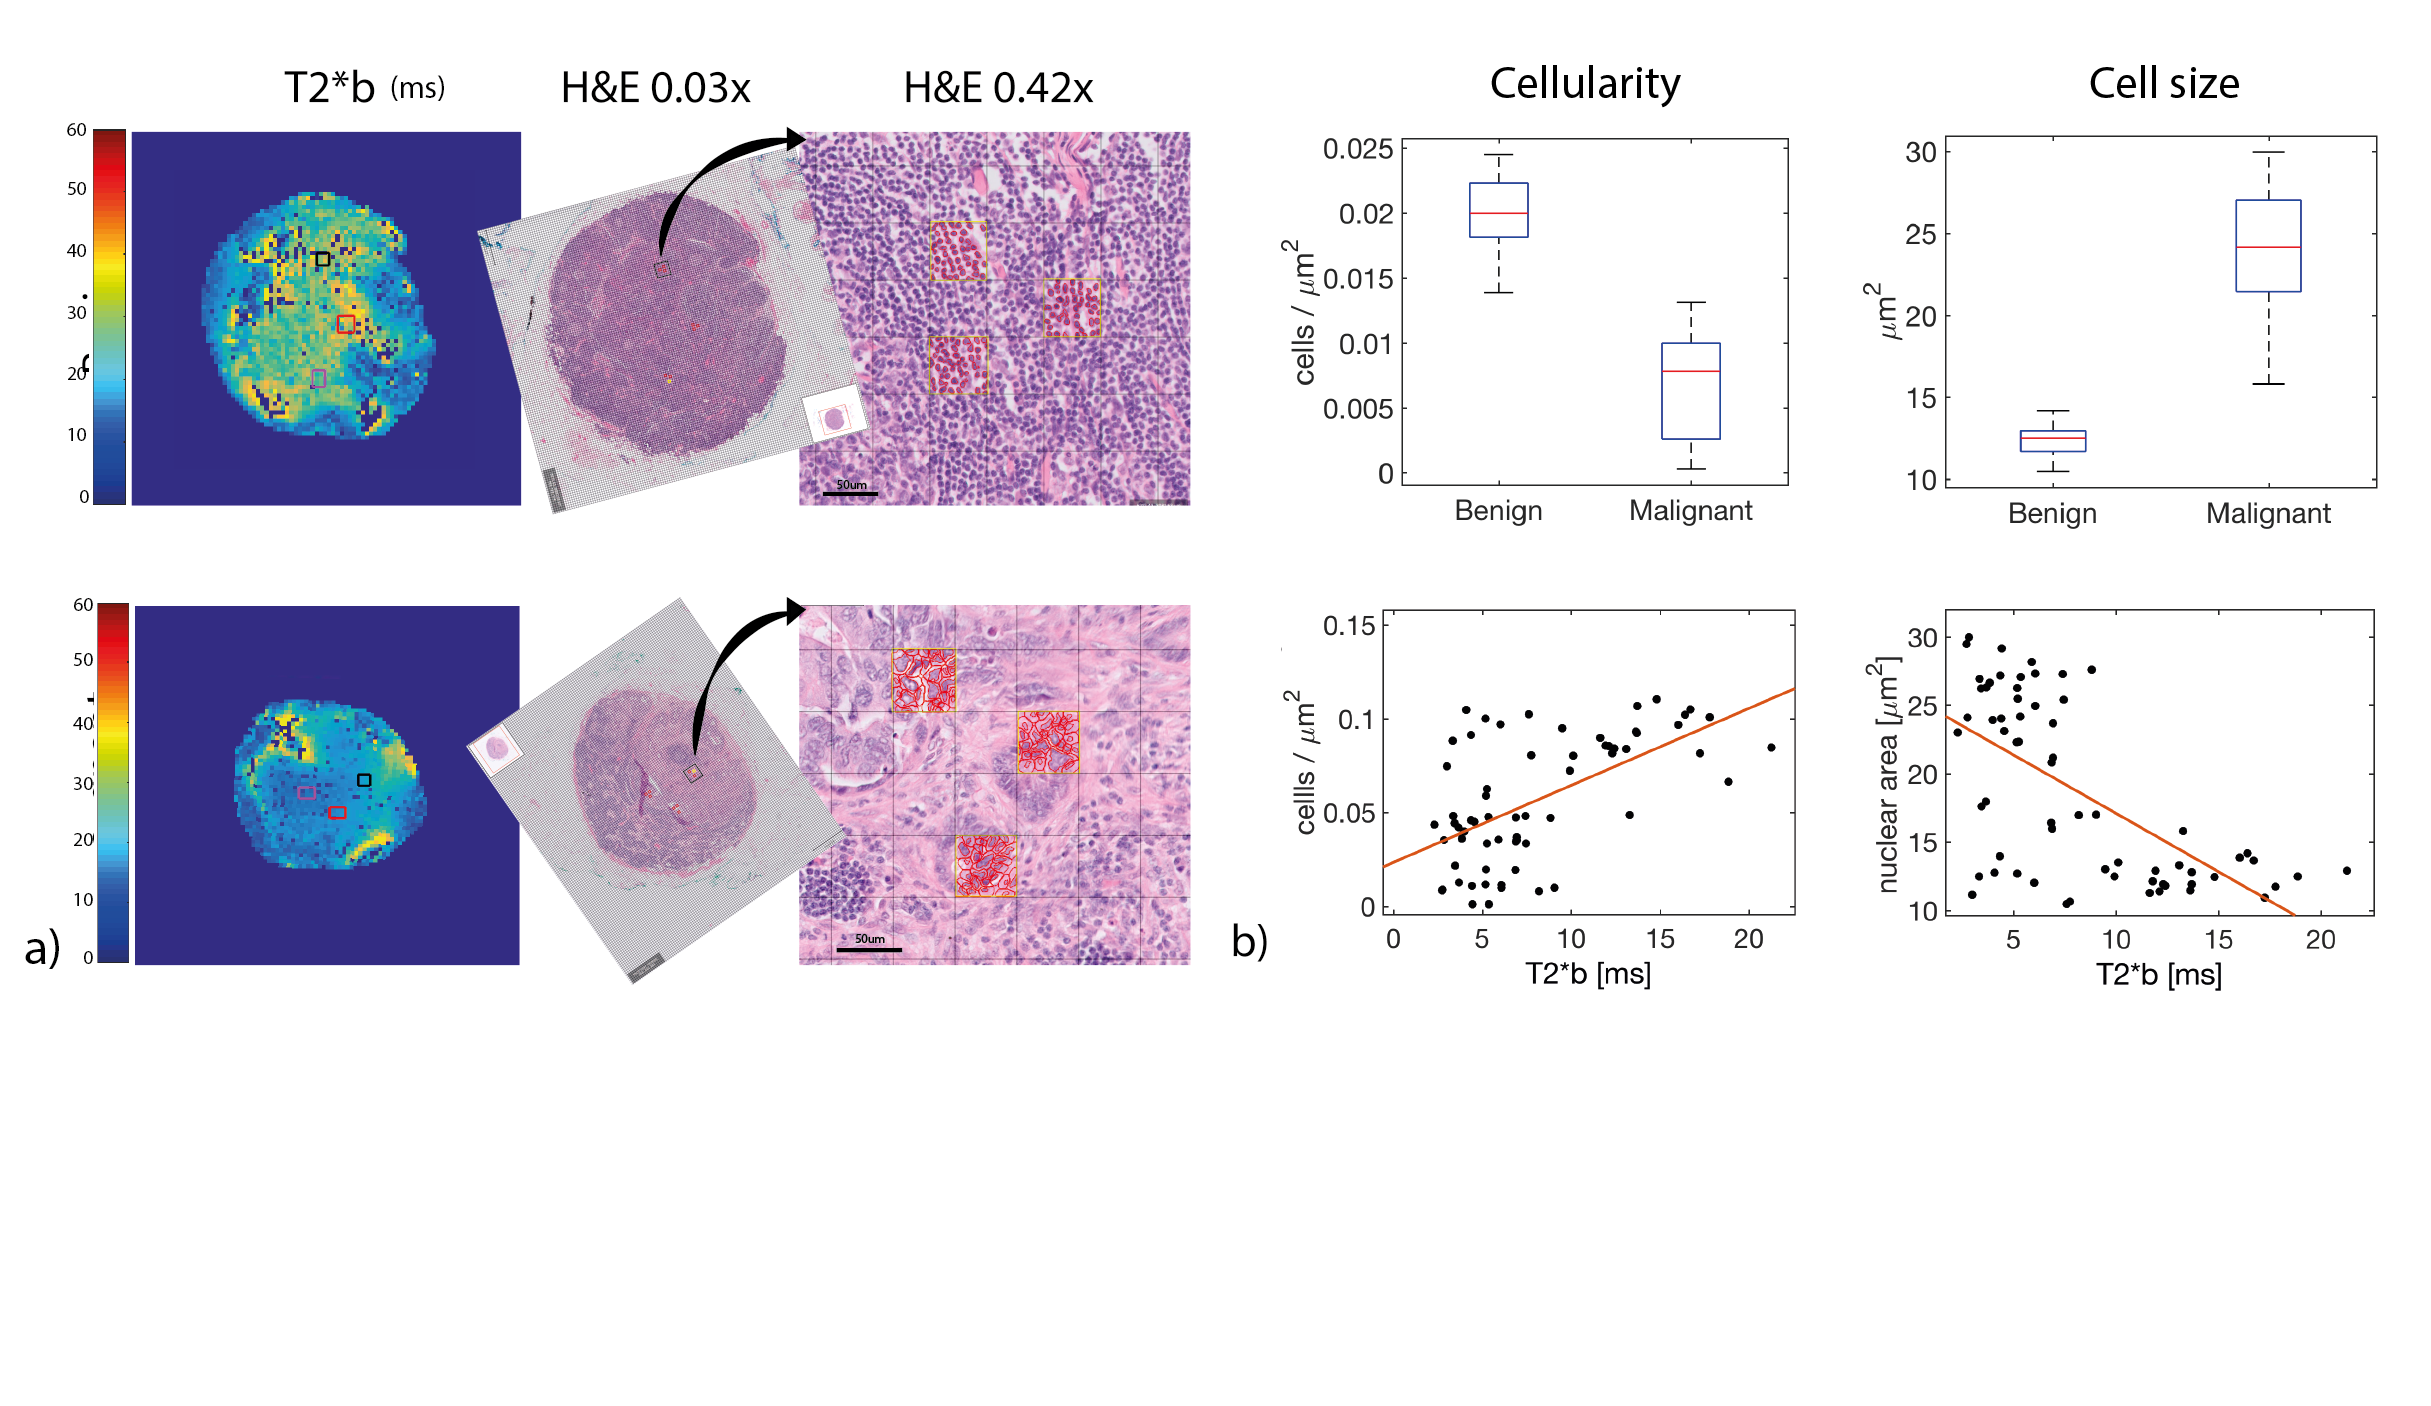
Examples of MGE-histology matching are shown in Figure 4a. Figure 4b shows the differences in cellularity and cell size between benign nodal tissue and tumour, and their correlation to T2*b.
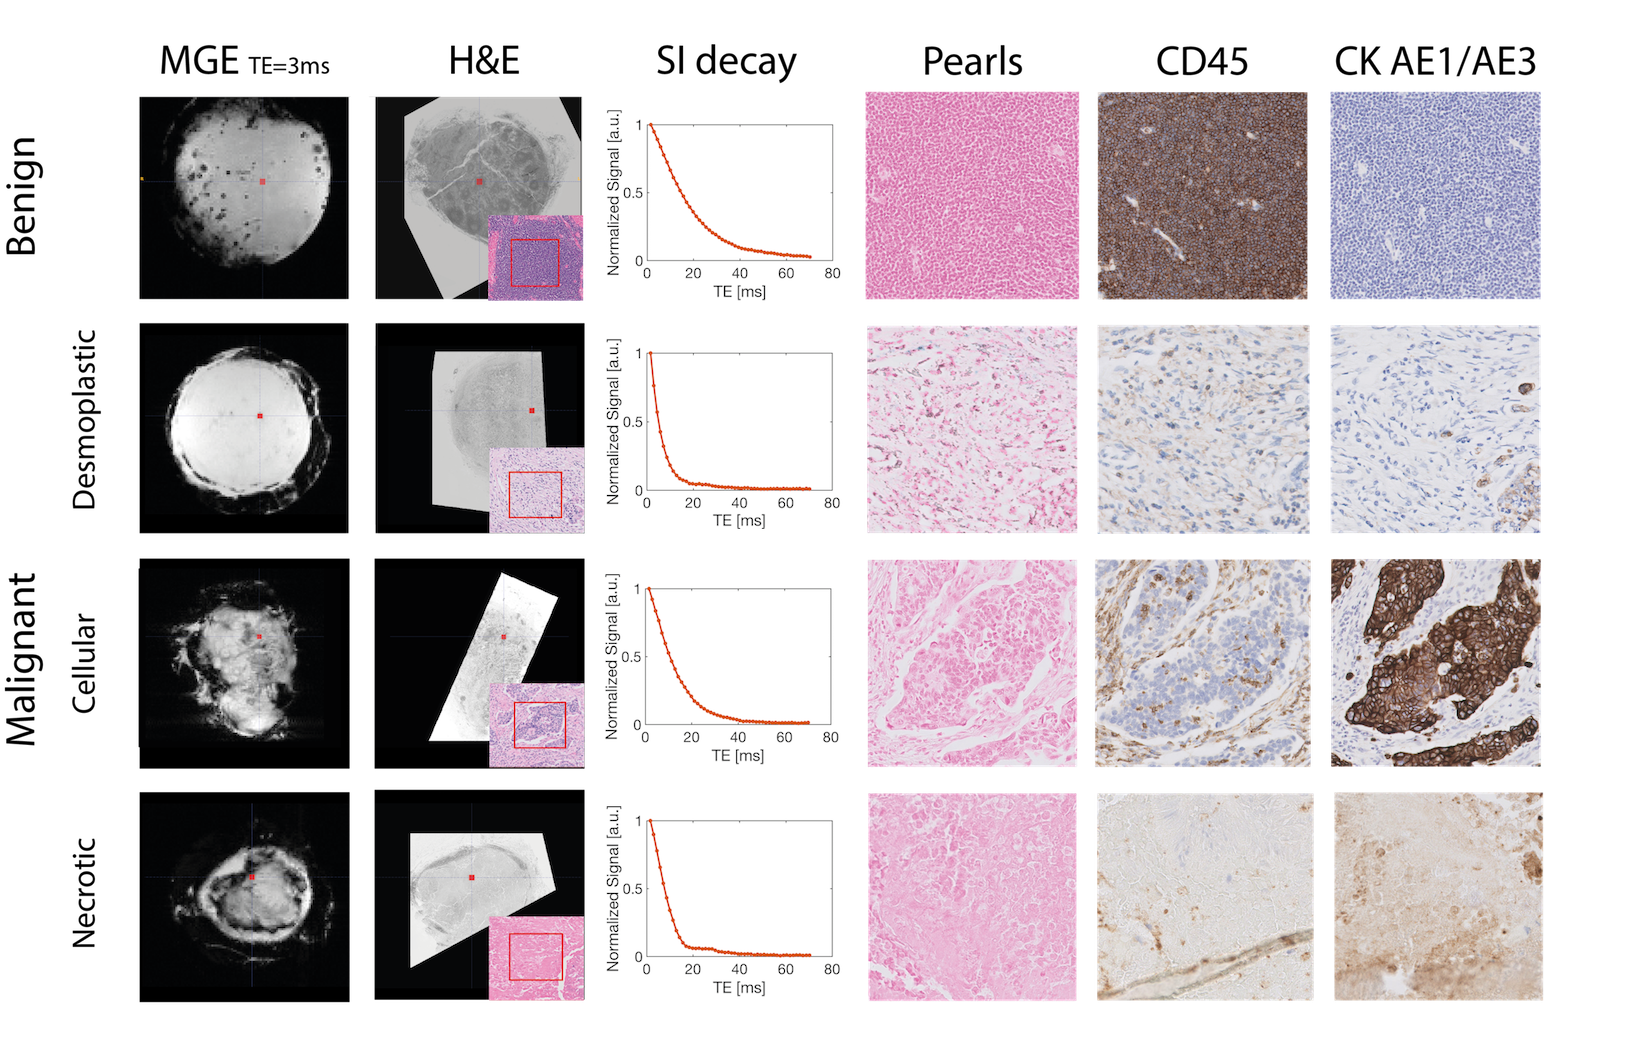
MGE signal decay differences between different patterns of malignant nodal infiltration were found in histology and their underlying mechanisms were investigated with staining for different markers (Figure 5).
DISCUSSION
MGE signal decays accurately characterize lymph node status and improve specificity towards tissue microstructure. The method’s contrast likely derives from different susceptibility distributions imparted by the diverging benign and malignant tissue characteristics, given quantitative differences in the best performing 2-compartment model parameter were at least partially explained by differences in cellularity and cell size. MGE is a simple, yet powerful sequence. It´s clinical translation is relatively straightforward and has the potential to improve rectal cancer patients´ selection for neoadjuvant therapy.CONCLUSION
This new non-invasive MRI contrast has potential to improve lymph node staging accuracy in rectal cancer patients, as corroborated by the results of our pilot in-vivo study at 1.5T (6).Acknowledgements
The authors would like to thank the outstanding contributions of:
Joana Maia and Bruno Costa-Silva from the Systems Oncology Lab of the Champalimaud Centre for the Unknown;
Lara Castanheira, Alexandra Ferreira and Ana Santos from the Pathology Department of the Champalimaud Centre for the Unknown;
Nuno Loução, Paula Montesiños and Javier Gonzalez-Sanchez from Philips Healthcare Iberia;
Nuno Figueiredo and José Filipe Cunha from the Digestive Unit of the Champalimaud Centre for the Unknown;
Rita Theias from the Department of Pathologyof the Hospital Fernando Fonseca, EPE;
Carlos Leichsenring, Vasco Geraldes and Cisaltina Sobrinho, from the Department of Surgery of the Hospital Fernando Fonseca, EPE;
Maria Lisitskaya, a fellow radiologist at the Computational Clinical Imaging Group, Champalimaud Centre for the Unknown;
All the staff from the Radiology Department of the Champalimaud Centre for the Unknown;
The researchers from the Neuroplasticity and Neuronal Activity MRI Lab,Champalimaud Centre for the Unknown;
This study was funded by the Champalimaud Centre for the Unknown.
Andrada Ianus´ work is supported by EPSRC grants EP/M020533/1 and EP/N018702/1.
References
1) Yao Y-F, Wang L, Liu Y-Q, Li J-Y and Gu J. Lymph node distribution and pattern of metastases in the mesorectum following total mesorectal excision using the modified fat clearing technique. 2011. J Clin Pathol. 64(12):1073-7.
2) Jhaveri K, Hosseini-Nik H. MRI of Rectal Cancer: An Overview and Update on Recent Advances. Am J Roentgenol 2015. 205(1):42-55.
3) Bipat S, Glas AS, Slors FJM, Zwinderman AH, Bossuyt PMM, Stoker J. Rectal Cancer: Local Staging and Assessment of Lymph Node Involvement with Endoluminal US, CT, and MR Imaging—A Meta-Analysis. 2004. Radiology. 232(3):773-83.
4) Nunes D, Cruz TL, Jespersen SN, Shemesh N. Mapping axonal density and average diameter in white matter using non-monotonic time-dependent gradient-echo MRI. J Magn Reson. 2017. 277:117-130.
5) Kasper Marstal, Floris Berendsen, Marius Staring and Stefan Klein, "SimpleElastix: A user-friendly, multi-lingual library for medical image registration", International Workshop on Biomedical Image Registration (WBIR), Las Vegas, Nevada, USA, 2016 dx.doi.org/10.1109/CVPRW.2016.78
6) Santiago I, Santinha J, Ianus A, Papanikolaou N, Matos C, Shemesh N. Multi-exponential T2* mapping distinguishes benign/malignant lymph nodes in rectal cancer patients: an ex-vivo and in-vivo experiment [abstract]. In: 26th Annual Meeting & Exhibition; 2018 Jun 16-21; Paris, France. ISMRM; 2018. Abstract nr 3837.
Figures