0196
A Noninvasive Comparison Study between Human Gliomas with IDH1 and IDH2 Mutations by MR Spectroscopy1Weldon School of Biomedical Engineering, Purdue University, West Lafayette, IN, United States, 2University of Oxford, Oxford, United Kingdom, 3Oxford University Hospitals NHS Trust, Oxford, United Kingdom, 4School of Health Sciences, Purdue University, West Lafayette, IN, United States
Synopsis
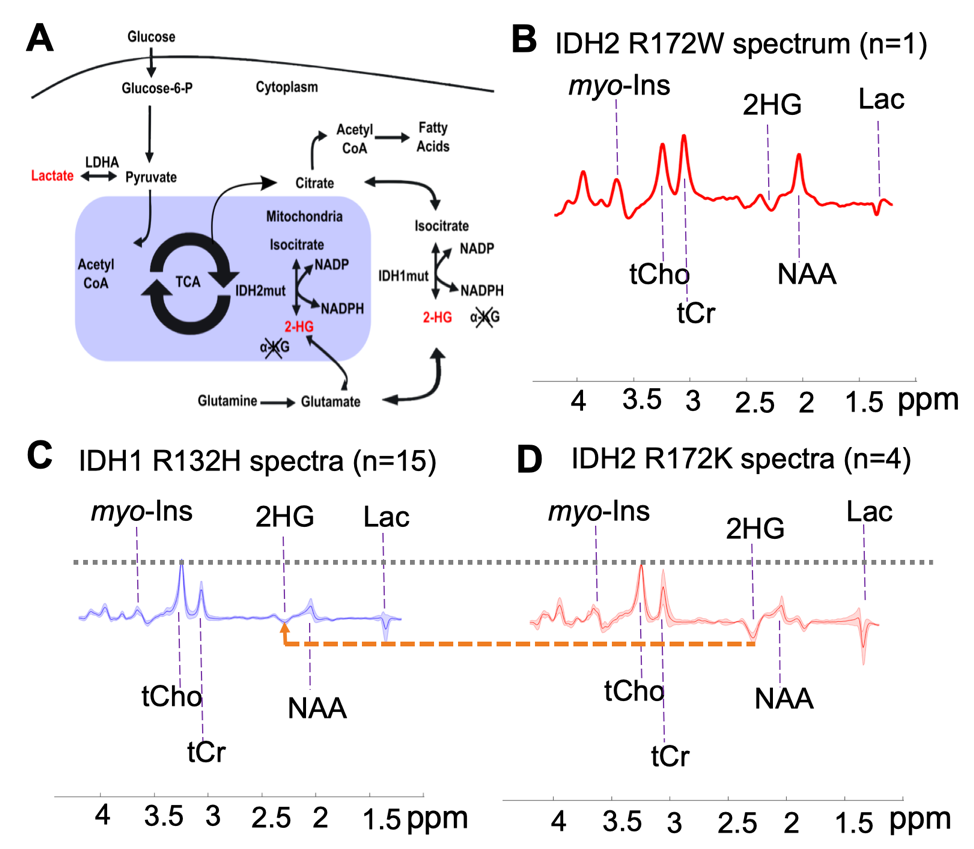
The oncogenes that are expressed in gliomas reprogram particular pathways of glucose, amino acid, and fatty acid metabolism. Mutations in the isocitrate dehydrogenase genes (IDH1/2) in diffuse gliomas are associated with abnormally high 2-hydroxyglutarate (2-HG) levels. Non-invasive measurement of 2-HG via in vivo 1H magnetic resonance spectroscopy (MRS) can be used to differentiate mutant cytosolic IDH1 from mitochondrial IDH2 in gliomas.
Introduction
Personalized medication in the treatment of cancer requires the discovery of reliable biomarkers and the development of tools capable of differential diagnosis according to genetic subtypes. In brain tumors, accumulation of the D-2-hydroxyglutarate (2-HG) in the majority (~80%) of grades 2-3 glioma and secondary glioblastomas (1,2) is potentially such a biomarker. 2-HG levels are enhanced as a metabolic product of somatic mutations in genes encoding for isocitrate dehydrogenase (IDH) (3), particularly IDH1 and IDH2, which encode for enzymes located in the cytosol and mitochondria, respectively. Over 90% of the reported IDH mutations in glioma patients affect the IDH1 gene at codon R132H, whereas mutations in the IDH2 gene are less common, affecting 2.4% of gliomas (2).
The metabolic reprogramming associated with IDH mutation leads to alternations in cellular metabolism beyond 2-HG production (4). Further investigation of how 2-HG production impacts the other metabolic pathways might provide insights into their metabolic reprogramming. Thus, the in vivo detection of other metabolites, and their up/down regulation relative to 2-HG production, might be applied with diagnostic or prognostic value for tumor subtyping/grading and monitoring response to treatments as several efforts have identified selective pharmacological agents that target IDH1 and IDH2 mutations (5). Thus, the aim of this study was to determine whether metabolic reprogramming associated with IDH mutant gliomas leads to additional 1H MRS-detectable differences between IDH1 and IDH2 mutations, as well as to identify metabolites correlated with 2-HG.
Methods
A total of 20 glioma patients were recruited (age= 37±11, 13 males) for a 7T MRI scan. Written and informed consent was obtained from every participant in the study, which was approved by the ethics committee. Assessed by immunohistochemical and DNA sequencing from a surgical tissue biopsy, 15 patients (age = 41±10, 12 males) were identified carrying IDH1 R132H mutation and 5 (age = 27±5, 4 females) with a rare IDH2 variant. The region of interest for MRS measurements was identified in each patient by a T1-weighted anatomical MPRAGE scan. A semi-localization by adiabatic selective refocusing (semi-LASER) pulse sequence was performed to each voxel of interest (VOI) for spectra measurements (6). The spectroscopy acquisition parameters were as below: volume size = 20 x 20 x 20 mm3 = 8 mL, TE = 110 ms, TR = 5-6 s, number of transients NT = 128, spectral bandwidth = 6 kHz, and data points = 2048. LCModel analysis was applied for metabolite quantification. Metabolite concentrations are reported relative to the internal reference of total choline (tCho). A non-parametric Mann-Whitney U-test was used for metabolite comparisons between IDH1 and IDH2 mutant gliomas. The Pearson correlation coefficients between 2-HG and associated metabolites were calculated.Results
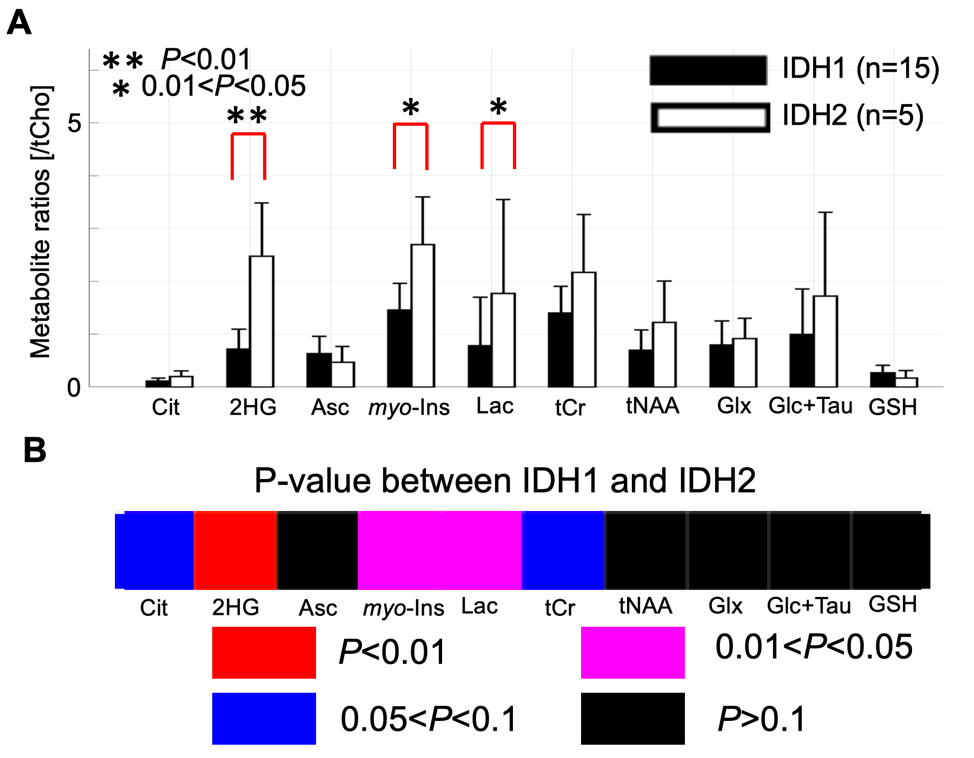
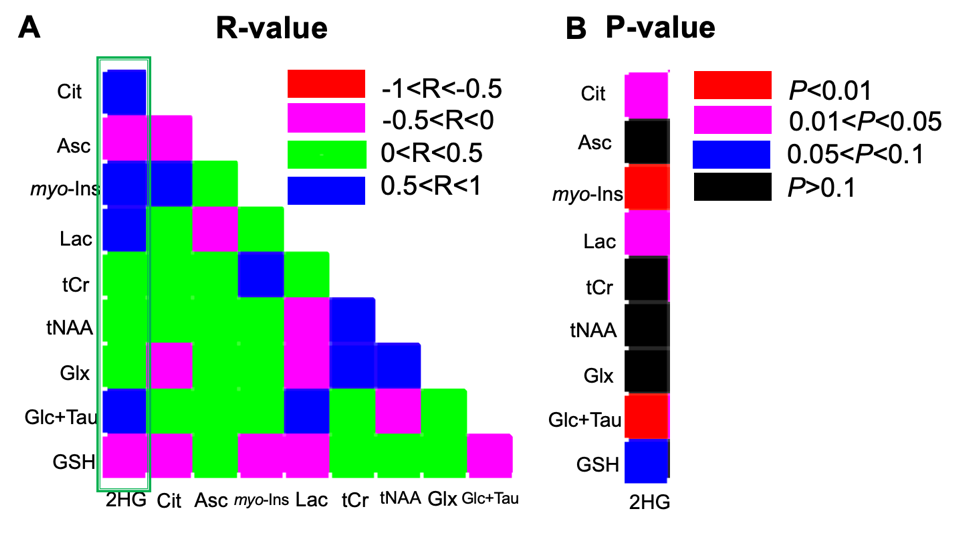
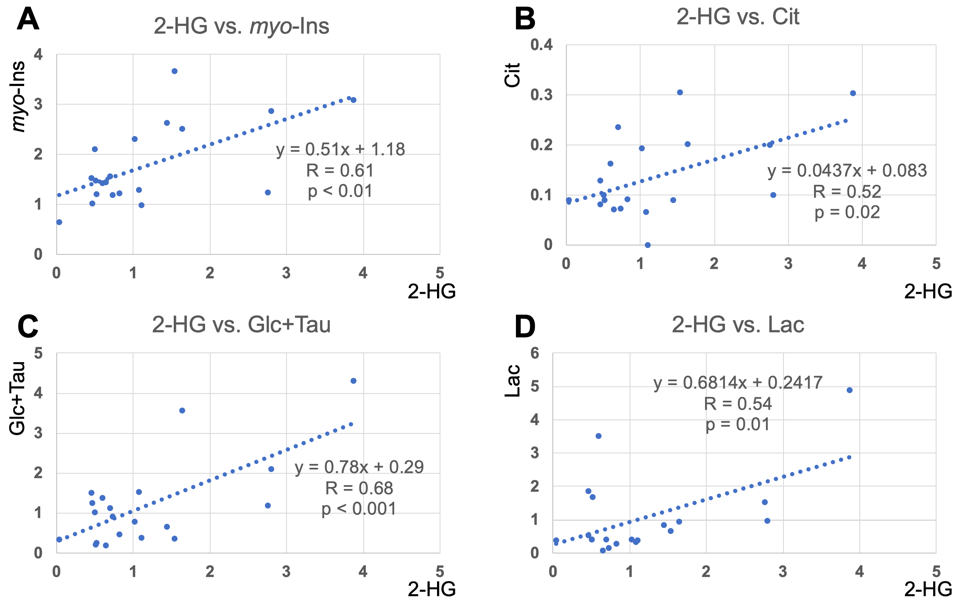
Quantification of 2-HG and associated metabolite concentrations using LCModel are illustrated in Figure 2. IDH2 mutant gliomas have a significantly higher level of 2-HG/tCho (2.48±1.01 vs. 0.72±0.38, P<0.001), myo-Inositol/tCho (2.70±0.90 vs. 1.46±0.51, P=0.01), and Lactate/tCho (1.77±1.78 vs. 0.79±0.92, P=0.04) compared to IDH1 mutation gliomas. The results of correlation analyses for all IDH patients between 2-HG and other metabolites are illustrated in Figure 3. This analysis indicated positive correlation between 2-HG and Citrate (R=0.52, P = 0.02), myo-Inositol (R = 0.61, P < 0.01), Lactate (R = 0.54, P = 0.01) and Glucose + Taurine (R = 0.68, P < 0.001) signals.Discussion
Given that the cohort was solely IDH-mutant, the study provided a unique opportunity to investigate the differences between IDH1-mutant and IDH2-mutant via metabolomics approaches. To our knowledge, this is the first in vivo report investigating the metabolic differences between glioma patients harboring IDH1 or IDH2 mutations. In addition to the further increase in the ratio of 2-HG/tCho, we found significantly higher metabolite ratios of Citrate/tCho, myo-Inositol/tCho, and Lactate/tCho in IDH2 gliomas (five patients) compared to IDH1 gliomas (fifteen patients). These observations suggest that IDH2 mutated gliomas might favor oxidative phosphorylation over aerobic glycolysis compared to IDH1 due to metabolic reprogramming associated with IDH mutation (7). Increase in myo-Inositol concentration in IDH2 might be due to hypermethylation in ISYNA1 (8).
The correlation analysis revealed that the 2-HG/tCho ratio correlates with several metabolite ratios, i.e. for Citrate/tCho, Lactate/tCho, myo-Inositol/tCho, and Glucose+Taurine/tCho which might shed light on to the underlying metabolic pathways of tumorigenesis in IDH mutations
Conclusion
These results demonstrate that, analyzing in vivo UHF 1H MRS data via metabolomics approaches can effectively complement conventional methods, not only by revealing insights into the underlying metabolic pathways of tumorigenesis, but also for monitoring the pharmacodynamics as well as the identification.Keywords
glioma, isocitrate dehydrogenase, MR spectroscopy, metabolism, neurochemical profileAcknowledgements
The work was supported by the NIHR Oxford Biomedical Research Centre. The Wellcome Centre for Integrative Neuroimaging is supported by core funding from the Wellcome Trust (203139/Z/16/Z).References
1. De Carli E, Wang X, Puget S. IDH1 and IDH2 mutations in gliomas. N Engl J Med 2009;360(21):2248; author reply 2249.
2. Yang H, Ye D, Guan KL, Xiong Y. IDH1 and IDH2 mutations in tumorigenesis: mechanistic insights and clinical perspectives. Clin Cancer Res 2012;18(20):5562-5571.
3. Parsons DW, Jones S, Zhang X, et al. An integrated genomic analysis of human glioblastoma multiforme. Science 2008;321(5897):1807-1812.
4. Parker SJ, Metallo CM. Metabolic consequences of oncogenic IDH mutations. Pharmacol Ther 2015;152:54-62.
5. Olivares O, Dabritz JHM, King A, Gottlieb E, Halsey C. Research into cancer metabolomics: Towards a clinical metamorphosis. Semin Cell Dev Biol 2015;43:52-64.
6. Emir UE, Larkin SJ, de Pennington N, et al. Noninvasive Quantification of 2-Hydroxyglutarate in Human Gliomas with IDH1 and IDH2 Mutations. Cancer Res 2016;76(1):43-49.
7. Wang HY, Tang K, Liang TY, et al. The comparison of clinical and biological characteristics between IDH1 and IDH2 mutations in gliomas. J Exp Clin Cancer Res 2016;35:86.
8. Wang C, McKeithan TW, Gong Q, et al. IDH2R172 mutations define a unique subgroup of patients with angioimmunoblastic T-cell lymphoma. Blood 2015;126(15):1741-1752.
Figures