0193
DCE MRI-Based Computational Modeling of Interstitial Fluid Pressure and Velocity in Head and Neck Cancer: Initial Analysis1Medical Physics, Memorial Sloan Kettering Cancer Center, New York, NY, United States, 2Radiology, Medical College of Wisconsin, Milwaukee, WI, United States, 3Radiology, Memorial Sloan Kettering Cancer Center, New York, NY, United States, 4Medicine, Memorial Sloan Kettering Cancer Center, New York, NY, United States, 5Radiation Oncology, Memorial Sloan Kettering Cancer Center, New York, NY, United States
Synopsis
We applied computational fluid modeling to head-and-neck cancer patients' DCE-MRI data using permeability maps from extended Tofts' model and tumor geometry from imaging. Interstitial fluid pressure (IFP) maps generated from computational fluid modeling depict heterogeneous distribution of elevated IFP and velocity in tumor tissue. We found significant correlation between tumor volume and IFP.
Introduction
Elevated interstitial fluid pressure (IFP) in tumors impairs distribution of fluid and macromolecules arriving in tissue via the bloodstream1. This is known to have serious implications for effective delivery of drugs; high IFP is a significant therapeutic problem in cancer patient management2-4. In head-and-neck (HN) patients, concurrent chemoradiation is the treatment of choice in many instances when the disease is already locoregionally advanced5-7. Direct measurement of IFP relies on invasive techniques and is not routinely used in clinics8. Dynamic contrast enhanced (DCE) MRI-based computational fluid modeling (CFM) methods have been developed to assess IFP non-invasively9. The purpose of this clinical study is to use DCE MRI-based CFM for the first time to measure IFP and interstitial fluid velocity (IFV) in neck nodal metastases of HN cancer patients.Methods
Patients: The institutional review board approved and granted a waiver of informed consent for this retrospective clinical study, compliant with Health Insurance Portability and Accountability Act. Human papillomavirus-positive (HPV+) histologically-proven head and neck squamous cell carcinoma (HNSCC) patients (N=12, median age: 58 years, range: 48-69 years; 11 M/1 F) with neck nodal metastases enrolled between June 2014 and October 2015 and underwent chemo-radiation therapy. Patients were grouped as complete responders (CR) and non-CR based on standard-of-care imaging and clinical follow up.
DCE Data Acquisition: Pre-contrast T1-weighted (T1w) images were acquired using a spoiled gradient echo sequence and the acquisition parameters were as follows: TR/TE = 7/2.7 ms, flip angles (θ)= 5,15,30°, NEX = 2, field of view = 20-24 cm2, slice thickness = 5mm, matrix = 256 x 128. Dynamic acquisition was performed with identical parameters to pre-contrast T1w imaging using NEX=1 and θ=15°. Antecubital vein catheters delivered a bolus of 0.1 mmol/kg Gd-based contrast agent (CA) at 2 mL/s, followed by saline flush using an MR-compatible programmable power injector (Spectris; Medrad, Indianola, PA). Entire nodes were covered contiguously with 8-10 slices, 5-mm thickness, zero gap, and 40 phases, yielding 7.46-8.1 sec temporal resolution.
DCE Data Analysis: DCE datasets were analyzed using extended Tofts model (ETM). The volume transfer constant, $$$K^{trans}$$$ [min-1] derived from ETM, was incorporated into the CFM IFP calculation9-12. Regions of interest (ROI’s) on nodal tumors were contoured manually by neuroradiologists on late-phase dynamic images. Tumor volumes were calculated from T2w images. Arterial input function was obtained from the carotid artery.
Computational Theory for IFP: The CFM method is based on transport of CA in porous media (tumor tissue), providing estimates of IFP and IFV9. Darcy velocity, $$$\mathbf{u}$$$, equals the product of tissue hydraulic conductivity, $$$K_{H}$$$, and the IFP ($$$p_i$$$) gradient, as follows:
$$\mathbf{u} = -K_{H}\triangledown p_{i} (1)$$
Incorporating $$$K^{trans}$$$ and the Starling equation into the Navier-Stokes continuity equation with Darcy velocity gives the CFM expression in terms of IFP, $$$p_i$$$:
$$ -K_{H}\triangledown^{2}p_{i} = \frac{K^{trans}}{\overline{K^{trans}}}[L_p\frac{S}{V}(p_{v} - p_{i} - \sigma_{T}(\pi_{V}-\pi_{i}))]-\frac{L_{pL}S_{S}}{V}(p_{i} - p_{L}) (2)$$
where Lp is capillary permeability, S/V microvascular surface area per unit volume, pV microvascular pressure, πv microvascular osmotic pressure, πi interstitial osmotic pressure, σT osmotic reflection coefficient, LpLSL/V lymphatic clearance rate.
CFM Simulation: Tumor ROI’s were dilated by 20 pixels, forming an extended domain incorporating normal tissue around tumor. ROI’s for tumor and extended domain were resliced 1mm3-isotropic, converted to STL format and imported as boundary meshes for the model. Computation was performed in COMSOL Multiphysics (COMSOL Inc., Stockholm, Sweden).
Statistical Analysis: Pearson coefficient was calculated to evaluate correlation between total tumor volumes and IFP measurements. A p value <0.05 was considered statistically significant.
Results
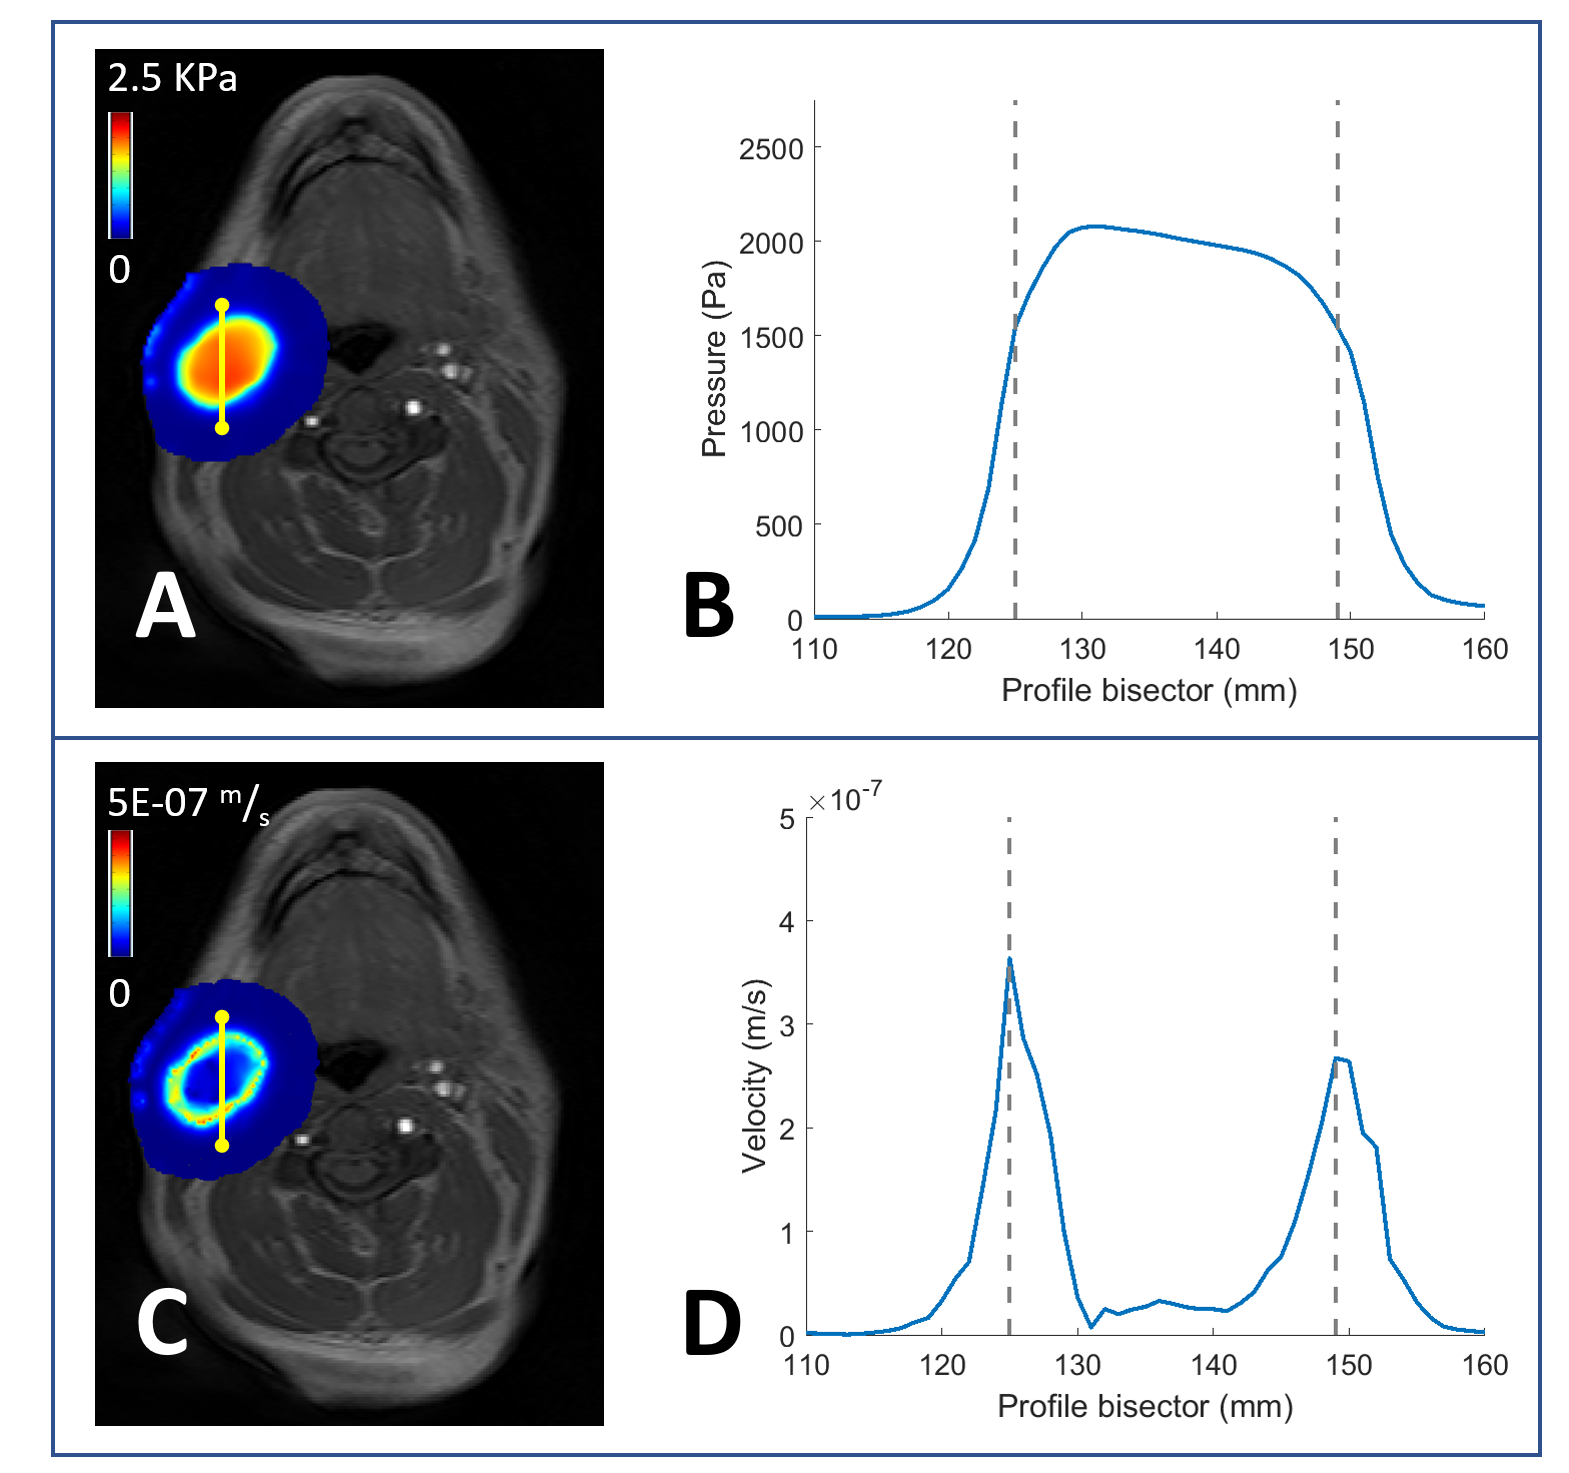
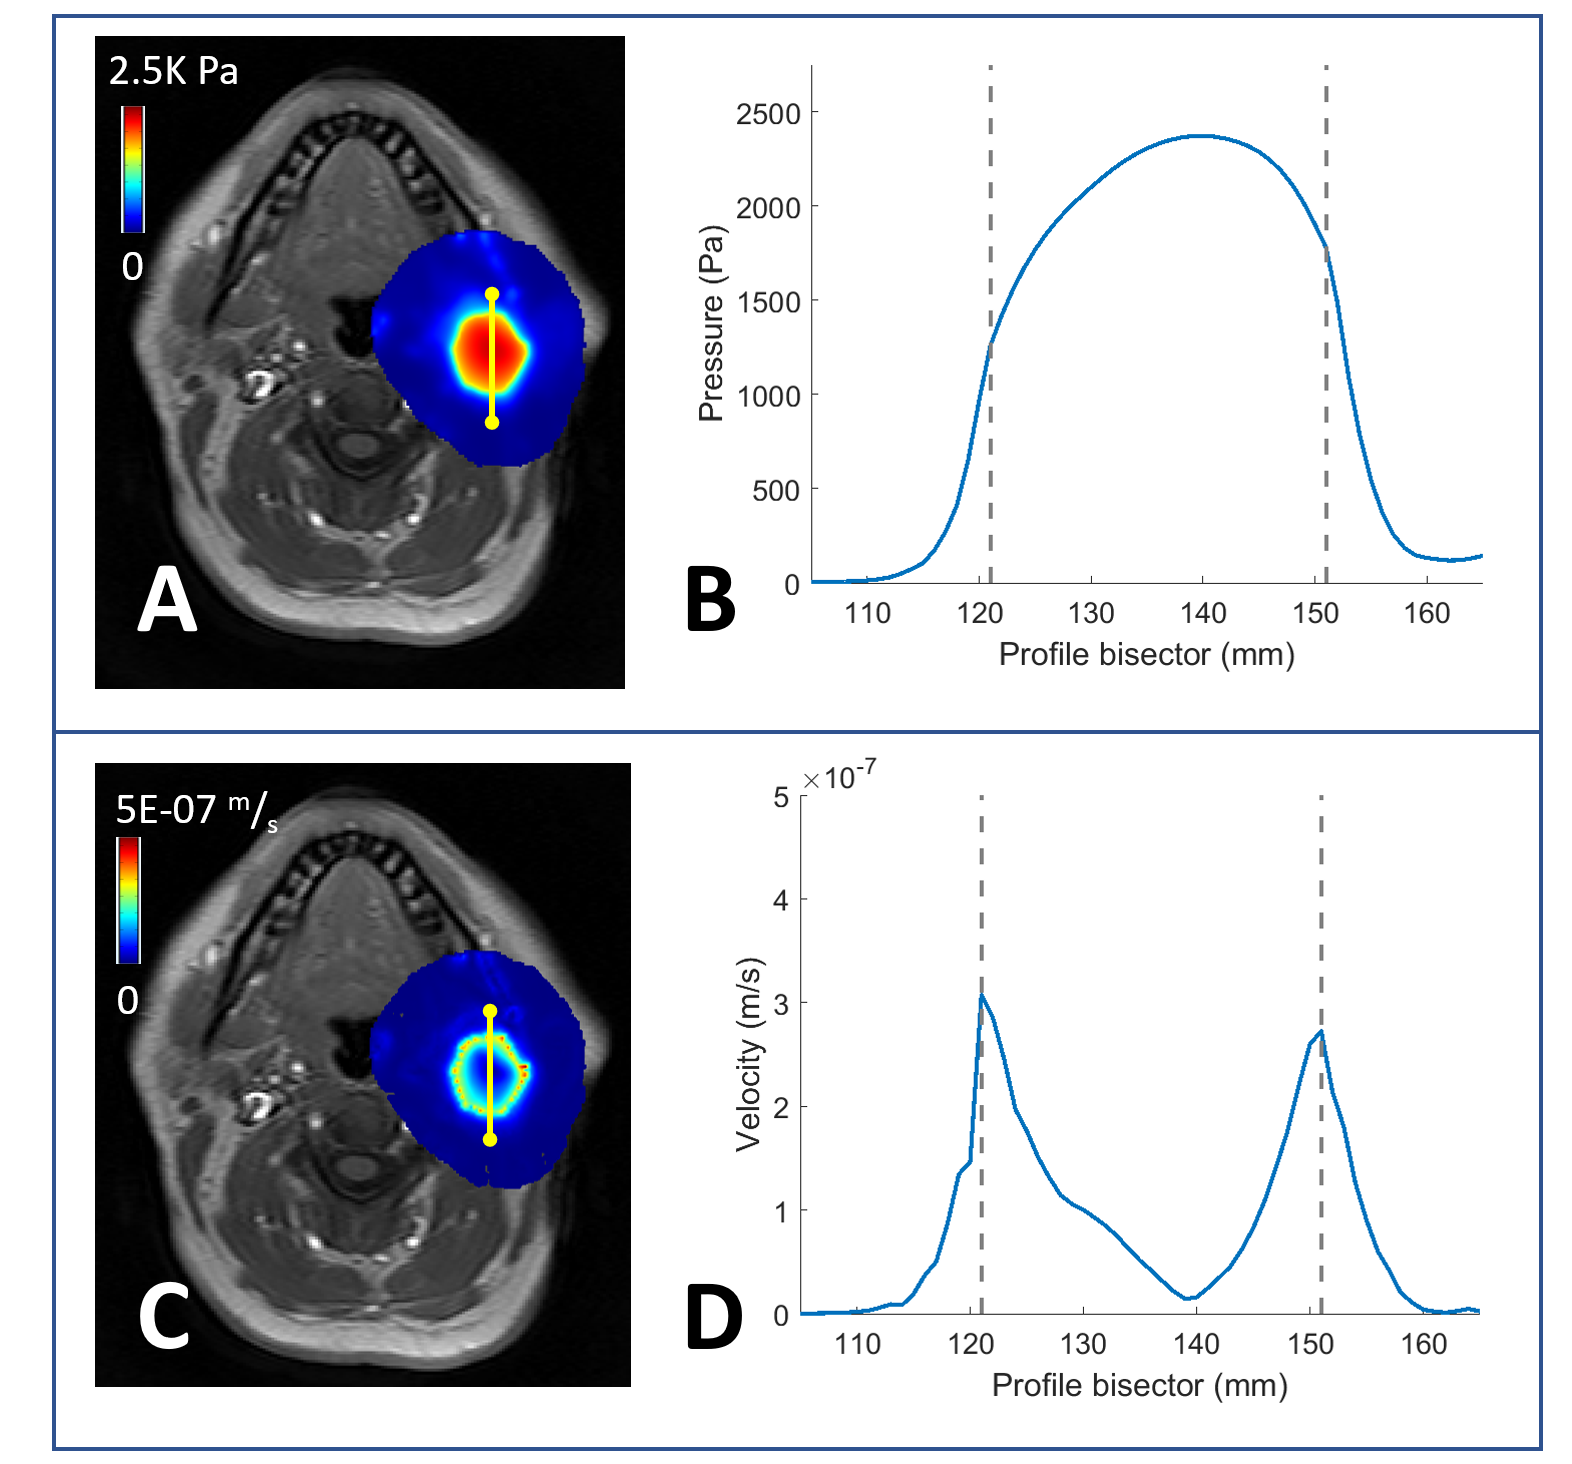
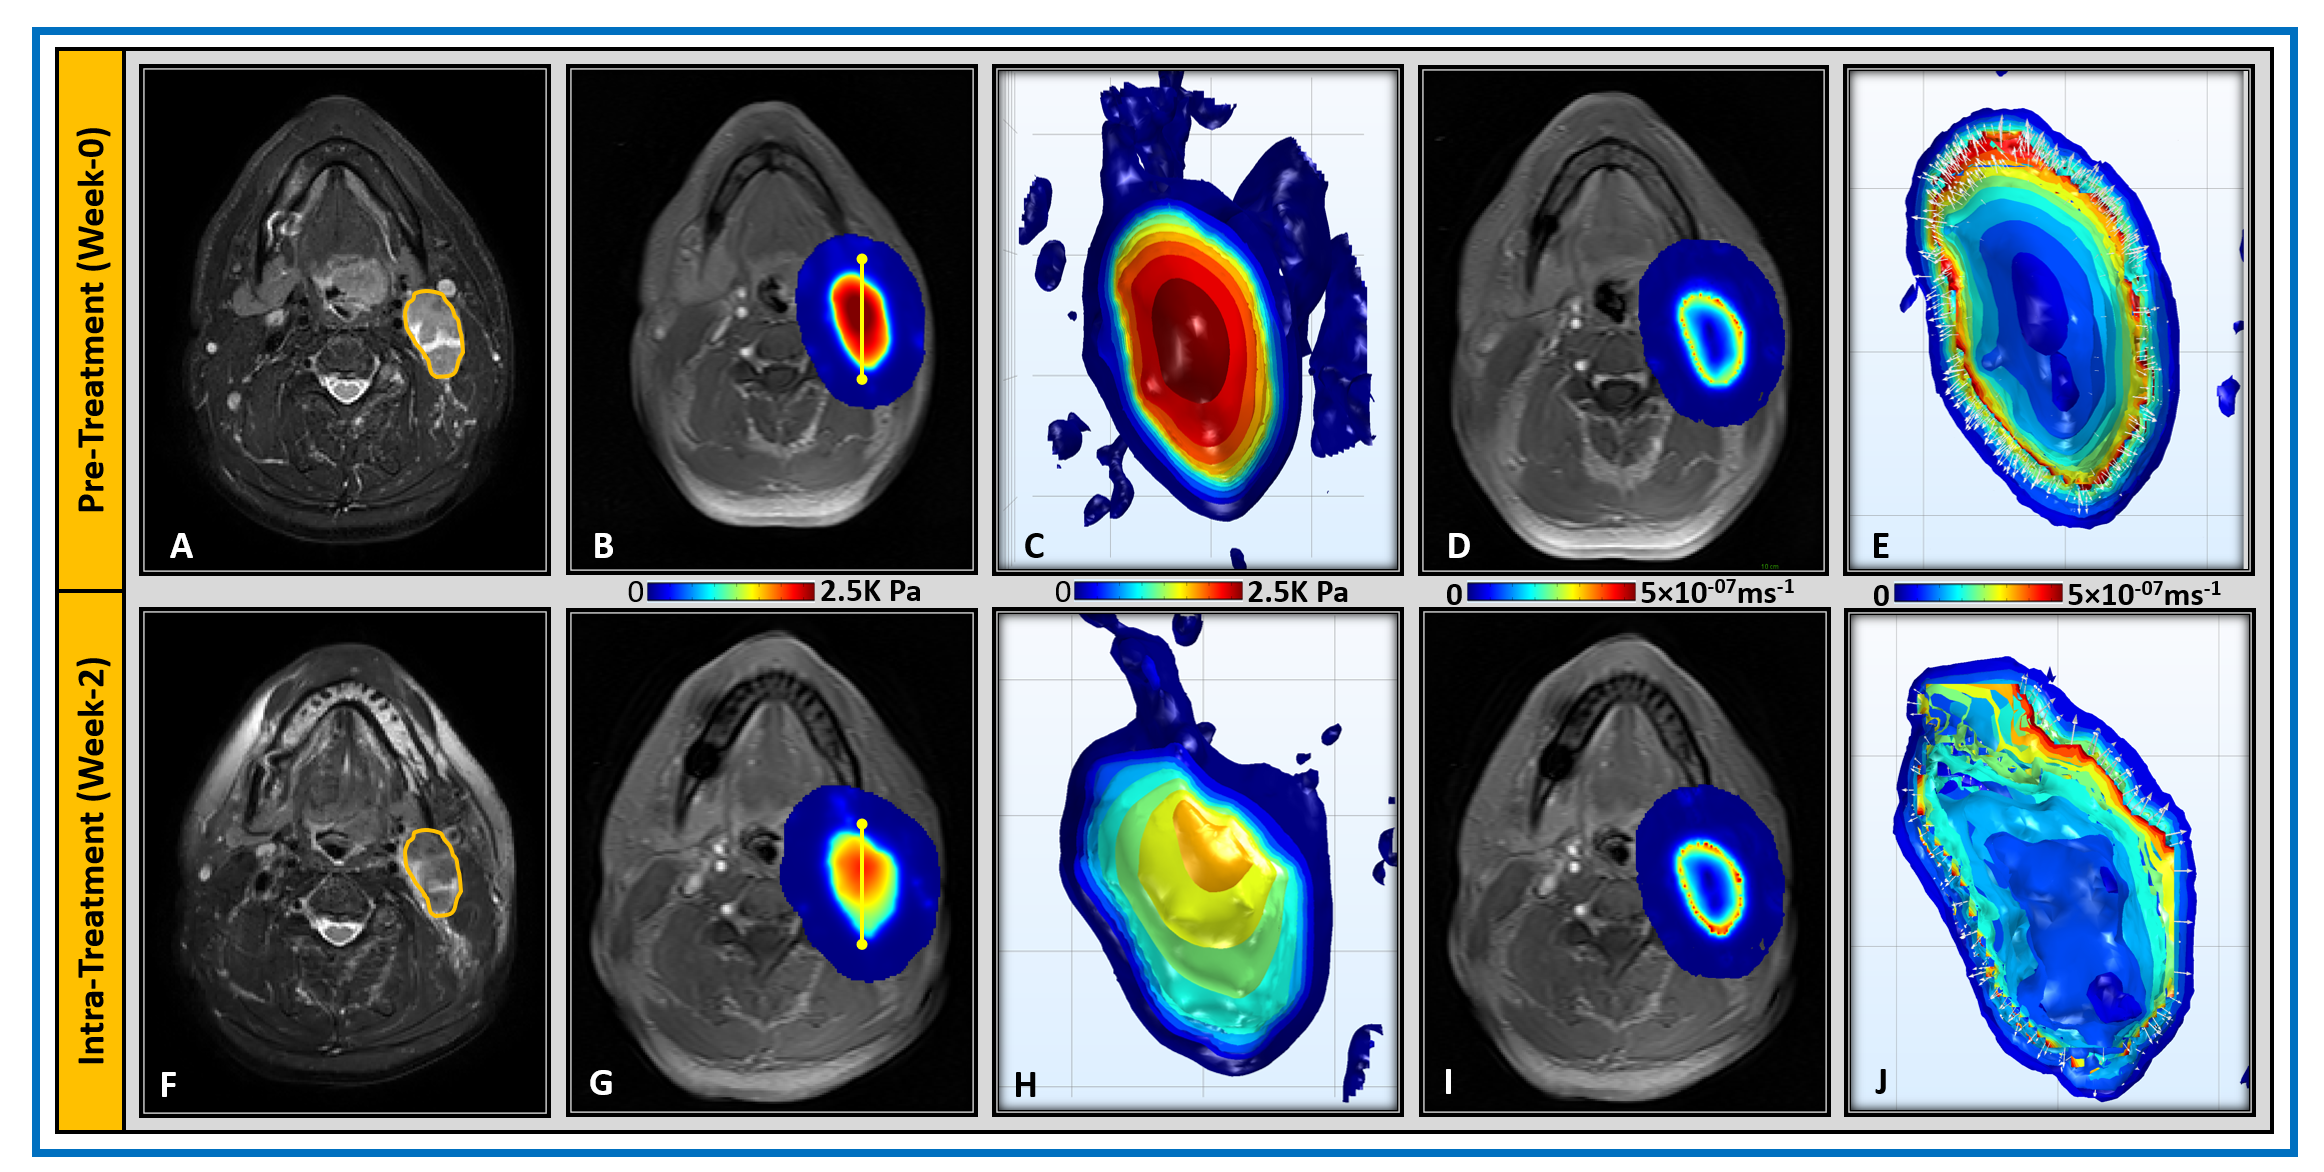
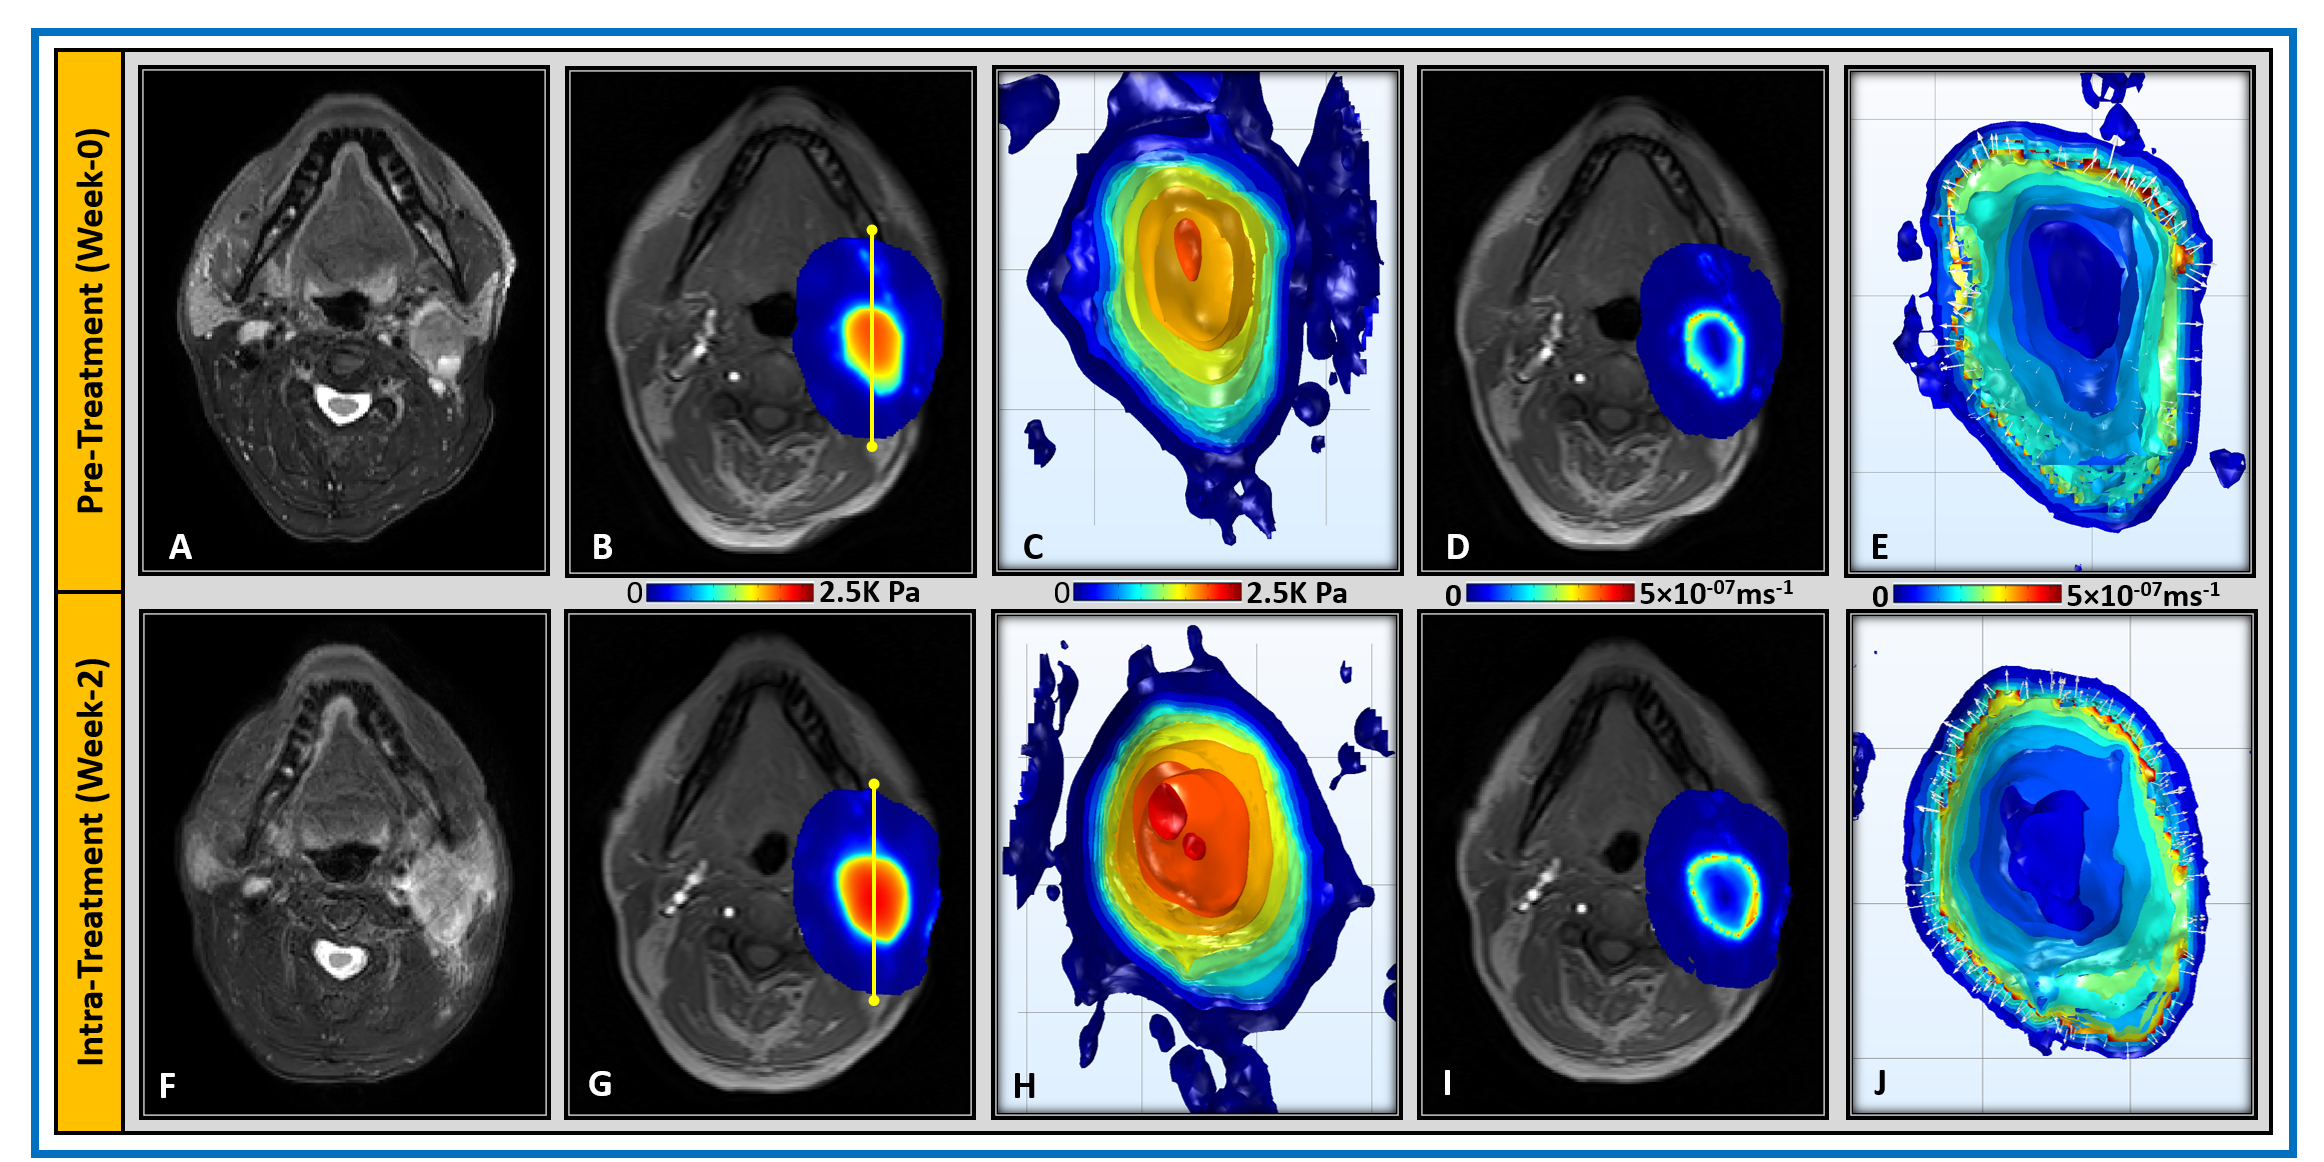
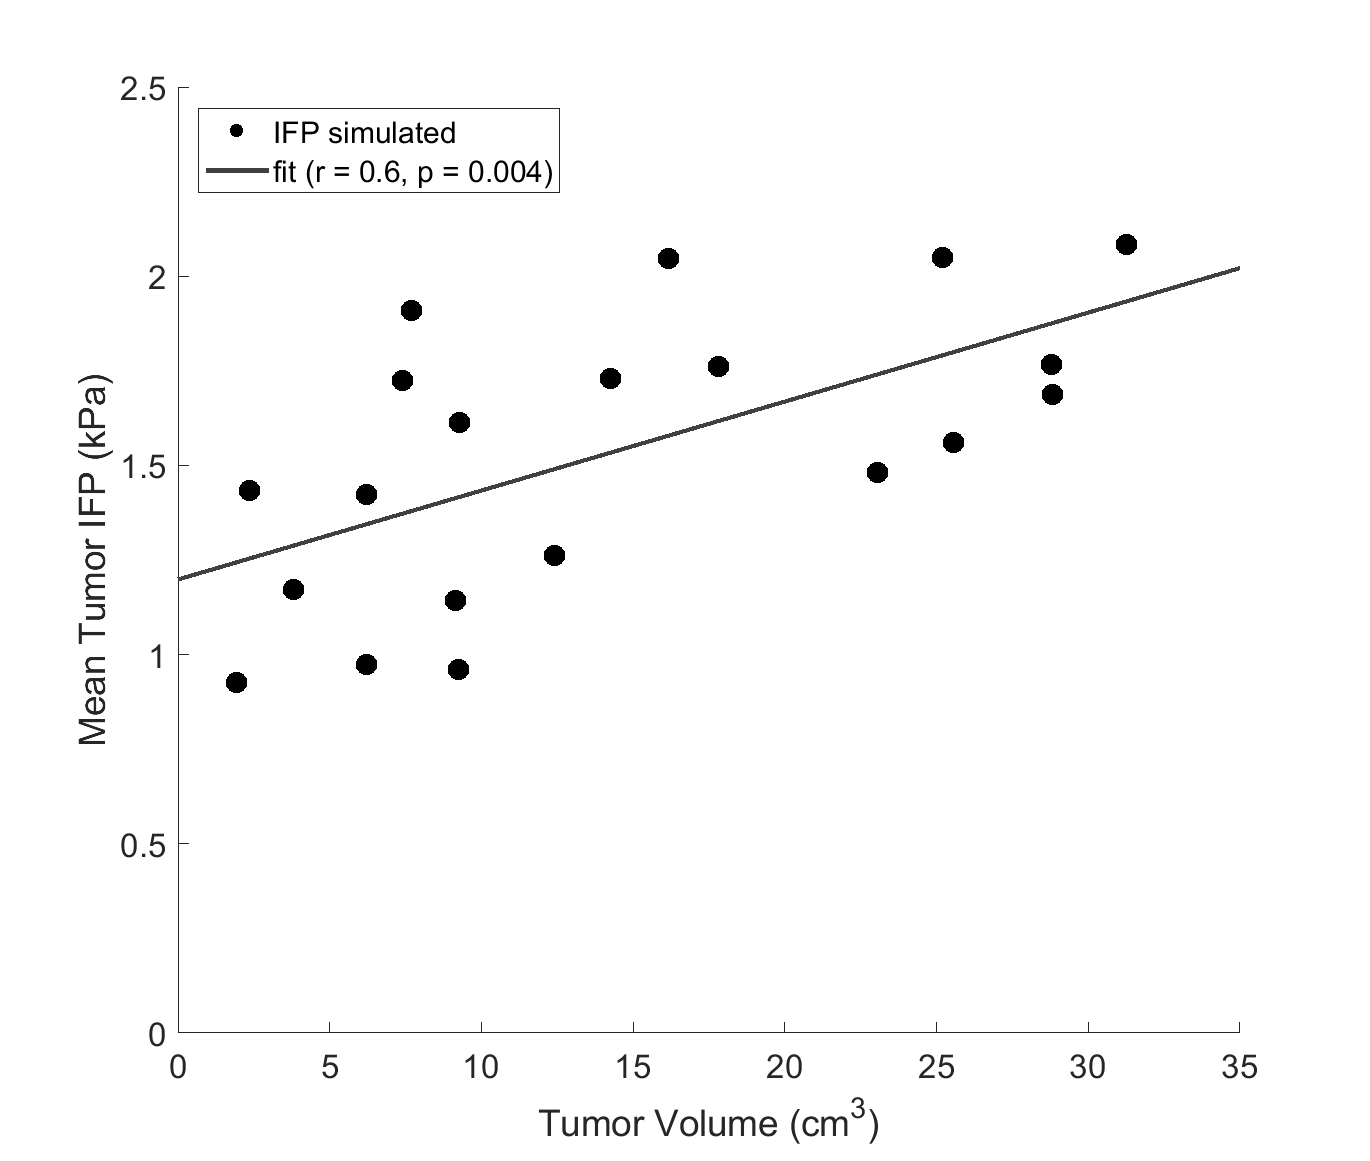
CFM-generated IFP and IFV maps based on Equation 2 are shown in Figures 1 and 2 for two representative HNSCC patients. Tumor heterogeneity led to subtle differences in IFP and IFV profiles within the tumor, evident in the patients' neck nodal metastases. In all cases mean tumor IFP was over 0.9 kPa, in contrast to normal tissue IFP was around 0 kPa. Out of the 12 HNSCC patients, 11 were CR and 1 was non-CR. Differences in IFP and IFV profiles were observed pre-treatment (TX) and mid-TX (week 2) between the CR (Figure 3) and non-CR (Figure 4) patients. Figure 5 shows scatter plot of total tumor volume vs IFP. A significant Pearson’s correlation with moderate agreement was found between pre-Tx total tumor volume and mean IFP (r = 0.6, p = 0.004).
Discussion and Conclusion
$$$K^{trans}$$$-based IFP and IFV maps depicted heterogeneity within the tumor. IFP is maximum at node center, monotonically decreasing outwards to tumor periphery and extending towards normal tissue. A positive correlation between total tumor volume and IFP was obtained, with largest tumors tending towards higher IFP. Non-invasive IFP and IFV from DCE MRI-based CFM makes this application promising in clinics. After appropriate validation, tumors showing higher IFP may be considered for alternate therapeutic management.Acknowledgements
This work was supported by the MSKCC internal IMRAS grant, and in part through the NIH/NCI Cancer Center Support Grant: P30 CA008748.References
1. Baxter LT, Jain RK. Vascular permeability and interstitial diffusion in superfused tissues: a two-dimensional model. Microvasc Res. 1988;36(1):108-115.
2. Heldin CH, Rubin K, Pietras K, Ostman A. High interstitial fluid pressure - an obstacle in cancer therapy. Nat Rev Cancer. 2004;4(10):806-813.
3. Lunt SJ, Fyles A, Hill RP, Milosevic M. Interstitial fluid pressure in tumors: therapeutic barrier and biomarker of angiogenesis. Future Oncol. 2008;4(6):793-802.
4. Hompland T, Ellingsen C, Ovrebo KM, Rofstad EK. Interstitial fluid pressure and associated lymph node metastasis revealed in tumors by dynamic contrast-enhanced MRI. Cancer research. 2012;72(19):4899-4908.
5. Fakhry C, Westra WH, Li S, et al. Improved survival of patients with human papillomavirus-positive head and neck squamous cell carcinoma in a prospective clinical trial. J Natl Cancer Inst. 2008;100(4):261-269.
6. Huang SH, Perez-Ordonez B, Weinreb I, et al. Natural course of distant metastases following radiotherapy or chemoradiotherapy in HPV-related oropharyngeal cancer. Oral Oncol. 2013;49(1):79-85.
7. Kimple RJ, Smith MA, Blitzer GC, et al. Enhanced radiation sensitivity in HPV-positive head and neck cancer. Cancer research. 2013;73(15):4791-4800.
8. Boucher Y, Kirkwood JM, Opacic D, Desantis M, Jain RK. Interstitial hypertension in superficial metastatic melanomas in humans. Cancer research. 1991;51(24):6691-6694.
9. Pishko GL, Astary GW, Mareci TH, Sarntinoranont M. Sensitivity analysis of an image-based solid tumor computational model with heterogeneous vasculature and porosity. Ann Biomed Eng. 2011;39(9):2360-2373.
10. Tofts PS, Berkowitz B, Schnall MD. Quantitative analysis of dynamic Gd-DTPA enhancement in breast tumors using a permeability model. Magn Reson Med. 1995;33:564-568.
11. Ewing JR, Nagaraja TN, Aryal MP, et al. Peritumoral tissue compression is predictive of exudate flux in a rat model of cerebral tumor: an MRI study in an embedded tumor. NMR Biomed. 2015;28(11):1557-1569.
12. Bhandari A, Bansal A, Singh A, Sinha N. Perfusion kinetics in human brain tumor with DCE-MRI derived model and CFD analysis. J Biomech. 2017;59:80-89.
Figures