0191
Modulation of dorsolateral prefrontal cortex GABA and Glx (glutamate + glutamine) levels following repetitive magnetic stimulation therapy of major depressive disorder1Imaging Institute, Cleveland Clinic, Cleveland, OH, United States, 2Radiology, Cleveland Clinic Lerner College of Medicine, Cleveland, OH, United States, 3Neurological Institute, Cleveland Clinic, Cleveland, OH, United States
Synopsis
Abnormalities of Gamma Amino Butyric Acid (GABA), the major inhibitory neurotransmitter, and Glx (glutamate, major excitatory neurotransmitter + glutamine) have been implicated in the pathology of depression. Modulation of GABA and Glx at left dorsolateral prefrontal cortex, the site of application of repetitive transcranial magnetic stimulation (rTMS) to treat major depressive disorder for patients not adequately responsive to medication treatment, was investigated using MEGA-PRESS spectroscopy. No change in GABA level was observed, while Glx/creatine level increased with rTMS therapy. Patients with higher Glx/Creatine level tended to respond better to rTMS, and the response was inversely correlated with increase in Glx/Creatine.
Introduction
Repetitive transcranial magnetic stimulation (rTMS), a non-invasive, non-convulsive neuromodulation / neurostimulation method, has gained popularity in treatment of major depressive disorder (MDD) for patients not adequately responsive to medication treatment. The mechanism of rTMS in the treatment of MDD has been investigated using neuroimaging1-3 studies on neurotransmitter.4-6 Neuroimaging and neurotransmitter studies have shown distal changes in neurotransmitter (primarily dopamine) levels5, 7, 8 following rTMS applied over DorsoLateral PreFrontal Cortex (DLPFC) in depression. Since Gamma Amino Butyric Acid (GABA), the major inhibitory neurotransmitter, and Glx (glutamate (Glu), major excitatory neurotransmitter + glutamine (Gln)) have been implicated in the pathology of depression,9-11 the effect of rTMS therapy in GABA and Glx levels in left DLPFC, the site of rTMS application as well as an area involved in depression,12, 13 were investigated using MEGA-PRESS editing.14, 15Methods
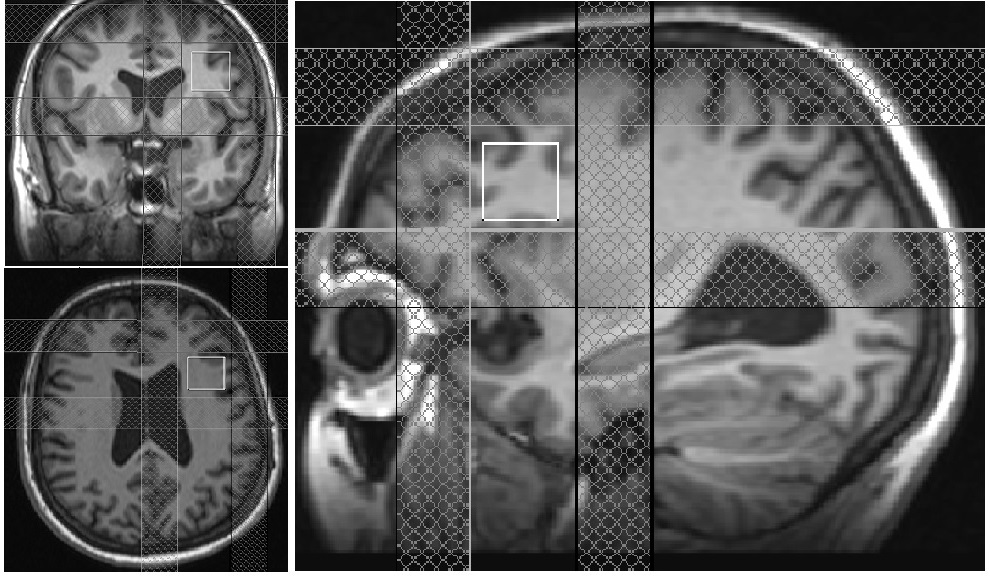
Seven MDD patients (50±16 y, 1 male) satisfying DSM-IV-TR16 crietria for inadequately responsive MDD to a single antidepressant despite treatment with an adequate dosage for at least 8 weeks (indication for rTMS approved by the Food and Drug Administration (FDA)) and Hamilton Depression rating (HAM-D) score of >15, were scanned with an institutional review board (IRB) approved protocol. All MRI scans were performed using a whole body 3 tesla Siemens Prisma scanner (Siemens, Erlangen, Germany) with a 20 channel head-neck coil. Scans were performed at baseline and after 6 weeks of rTMS therapy. A 20×20×20 mm3 voxel at left DLPFC (Fig. 1) was scanned using a MEGA-PRESS sequence with the following parameters: TR=2.7 s, TE=68 ms, editing pulse frequencies = 1.9 (ON resonance) and 7.5 ppm (OFF resonance -- placed symmetrically across 1.7 ppm macromolecule (MM) resonance to minimize MM contamination17) and editing pulsewidth = 44 Hz. rTMS therapy using a MagPro R-30 magnetic stimulator (MagVenture, Farum, Denmark) consisted of 5 sessions each week (total of 48 sessions) with the following parameters: frequency: 10 Hz, power: 120% of the motor threshold (i.e., minimum amount of energy needed to trigger thumb movement), duration of stimulus: 4 s, Inter-train interval: 26 s, number of pulses per train: 75, total number of pulses: 3000. MEGA-PRESS data analysis using jMRUI software18 (version 4.0) consisted of (i) zero order phase correction with respect to residual water peak, (ii) frequency alignment, (iii) adding the ON and OFF resonance subspectra separately, (iv) applying a 5 Hz Gaussian apodization filter, (v) subtracting the OFF spectrum from the ON spectrum to obtain the edited spectrum. The voxel locations during the 2 sessions were carefully matched. Motion during scan was assessed by tracking residual water signal as in Ref.19, 20 Areas under the 3 ppm GABA and 3.75 ppm Glx resonance peaks in the edited spectrum and the 3 ppm creatine peak in the OFF resonance spectrum were calculated. GABA and Cr levels were measured after correcting for the gray matter (GM), white matter (WM) and CSF contribution (determined using FAST algorithm of FSL), as well as for T1 and T2 relaxation as in Ref.20 GABA/Cr and Glx/Cr ratios were calculated.Results and Discussion
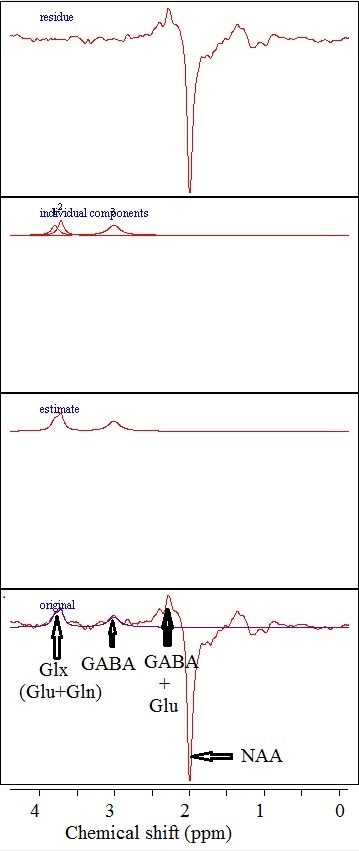
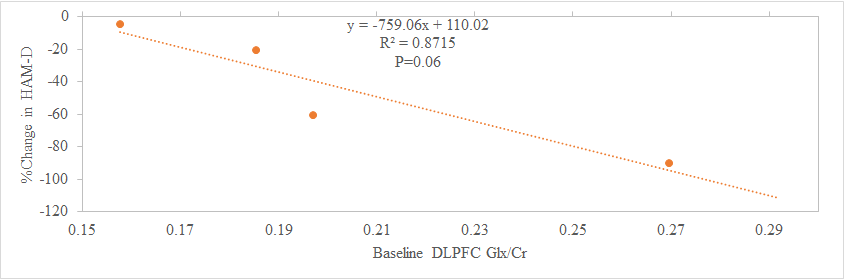
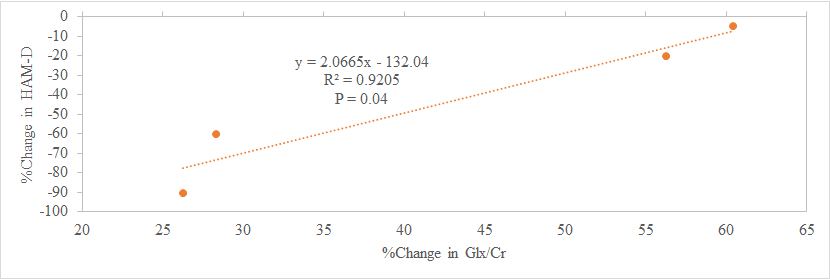
Mean Ham-D score of subjects included was 19±3. A representative single subject edited spectrum is shown in Fig. 2. For the 7 subjects studied at baseline, the change in HAM-D score negatively correlated at trend level significance (P=0.06) with the baseline Glx/Cr ratio (Fig. 3), which suggests that patients with higher baseline Glx/Cr ratio are more responsive to rTMS therapy. Two out of 7 subjects did not come back for the return visit and data for 1 subject had to be discarded due to excessive motion. For the remaining 4 subjects while GABA/Cr ratio did not show any overall change after rTMS, a significant increase in Glx/Cr ratio was observed (P<0.05). These observations in DLPFC with MM minimized GABA measurement albeit with a small sample size, are in contrast to the increase in GABA+MM and no change in Glx in medial prefrontal cortex following rTMS.21 In addition, rTMS therapy resulted in a significant decrease in HAM-D score (P<0.05) – the decrease in HAM-D score inversely correlated with the increase in Glx/Cr ratio (Fig. 4). Patients showing more improvement (i.e. larger decrease in HAM-D) following rTMS, had a smaller increase in Glx/Cr ratio. Patients with higher baseline Glx/Cr recovered better and needed a smaller increase in Glx/Cr for recovery.Conclusion
Patients with higher baseline Glx/Cr responded better to rTMS therapy. No significant change in GABA/Cr ratio following rTMS therapy was observed. Improvement in depression rating following rTMS was associated with an increase in Glx/Cr ratio at DLPFC, the site of application of rTMS.Acknowledgements
We are grateful to Sineyob Ahn and Mark A Brown from Siemens Healthineers for their support with the MEGA-PRESS sequence used in this study.
FASTESTMAP sequence, used for shimming, was developed by Edward J. Auerbach and Malgorzata Marjanska and were provided by the University of Minnesota under a C2P agreement.
Cleveland Clinic Research Program Committee partially funded this project.
References
1. Aoyama Y, Hanaoka N, Kameyama M, Suda M, Sato T, Song M, Fukuda M, Mikuni M. Stimulus intensity dependence of cerebral blood volume changes in left frontal lobe by low-frequency rTMS to right frontal lobe: A near-infrared spectroscopy study. Neurosci Res. 2009;63(1):47-51.
2. Catafau AM, Perez V, Gironell A, Martin JC, Kulisevsky J, Estorch M, Carrio I, Alvarez E. SPECT mapping of cerebral activity changes induced by repetitive transcranial magnetic stimulation in depressed patients. A pilot study. Psychiatry Res. 2001;106(3):151-160.
3. Paus T, Jech R, Thompson CJ, Comeau R, Peters T, Evans AC. Transcranial magnetic stimulation during positron emission tomography: a new method for studying connectivity of the human cerebral cortex. J Neurosci. 1997;17(9):3178-3184.
4. Ben-Shachar D, Belmaker RH, Grisaru N, Klein E. Transcranial magnetic stimulation induces alterations in brain monoamines. J Neural Transm. 1997;104(2-3):191-197.
5. Strafella AP, Paus T, Barrett J, Dagher A. Repetitive transcranial magnetic stimulation of the human prefrontal cortex induces dopamine release in the caudate nucleus. J Neurosci. 2001;21(15):RC157.
6. Keck ME, Welt T, Muller MB, Erhardt A, Ohl F, Toschi N, Holsboer F, Sillaber I. Repetitive transcranial magnetic stimulation increases the release of dopamine in the mesolimbic and mesostriatal system. Neuropharmacology. 2002;43(1):101-109.
7. Pogarell O, Koch W, Popperl G, Tatsch K, Jakob F, Mulert C, Grossheinrich N, Rupprecht R, Moller HJ, Hegerl U, Padberg F. Acute prefrontal rTMS increases striatal dopamine to a similar degree as D-amphetamine. Psychiatry Res. 2007;156(3):251-255.
8. Pogarell O, Koch W, Popperl G, Tatsch K, Jakob F, Zwanzger P, Mulert C, Rupprecht R, Moller HJ, Hegerl U, Padberg F. Striatal dopamine release after prefrontal repetitive transcranial magnetic stimulation in major depression: preliminary results of a dynamic [123I] IBZM SPECT study. J Psychiatr Res. 2006;40(4):307-314.
9. Petty F, Kramer GL, Gullion CM, Rush AJ. Low plasma gamma-aminobutyric acid levels in male patients with depression. Biol Psychiatry. 1992;32(4):354-363.
10. Sanacora G, Mason GF, Rothman DL, Hyder F, Ciarcia JJ, Ostroff RB, Berman RM, Krystal JH. Increased cortical GABA concentrations in depressed patients receiving ECT. Am J Psychiatry. 2003;160(3):577-579.
11. Godlewska BR, Near J, Cowen PJ. Neurochemistry of major depression: a study using magnetic resonance spectroscopy. Psychopharmacology (Berl). 2015;232(3):501-507.
12. Cummings JL. Frontal-subcortical circuits and human behavior. Arch Neurol. 1993;50(8):873-880.
13. Brunoni AR, Vanderhasselt MA. Working memory improvement with non-invasive brain stimulation of the dorsolateral prefrontal cortex: a systematic review and meta-analysis. Brain Cogn. 2014;86:1-9.
14. Mescher M, Merkle H, Kirsch J, Garwood M, Gruetter R. Simultaneous in vivo spectral editing and water suppression. NMR Biomed. 1998;11(6):266-272.
15. Terpstra M, Ugurbil K, Gruetter R. Direct in vivo measurement of human cerebral GABA concentration using MEGA-editing at 7 Tesla. Magn Reson Med. 2002;47(5):1009-1012.
16. Association AP. Diagnostic and statistical manual of mental disorders. (4th Text Revision ed.). Washington, DC: American Psychatric Association; 2000.
17. Henry PG, Dautry C, Hantraye P, Bloch G. Brain GABA editing without macromolecule contamination. Magn Reson Med. 2001;45(3):517-520.
18. http://www.mrui.uab.es/mrui/.
19. Bhattacharyya PK, Phillips MD, Stone LA, Bermel RA, Lowe MJ. Sensorimotor cortex gamma-aminobutyric acid concentration correlates with impaired performance in patients with MS. AJNR Am J Neuroradiol. 2013;34(9):1733-1739.
20. Bhattacharyya PK, Phillips MD, Stone LA, Lowe MJ. In vivo magnetic resonance spectroscopy measurement of gray-matter and white-matter gamma-aminobutyric acid concentration in sensorimotor cortex using a motion-controlled MEGA point-resolved spectroscopy sequence. Magn Reson Imaging. 2011;29(3):374-379.
21. Dubin MJ, Mao X, Banerjee S, Goodman Z, Lapidus KA, Kang G, Liston C, Shungu DC. Elevated prefrontal cortex GABA in patients with major depressive disorder after TMS treatment measured with proton magnetic resonance spectroscopy. J Psychiatry Neurosci. 2016;41(3):E37-45.
Figures