0190
Mapping atypical functional connectome organization and hierarchy in autism spectrum disorders1Multimodal Imaging and Connectome Analysis Lab, Montreal Neurological Institute, Montreal, Quebec, QC, Canada, 2Center for the Developing Brain, Child Mind Institute, New York, NY, United States, 3Autism Research Centre, Department of Psychiatry, University of Cambridge, Cambridge, United Kingdom, 4Institute of Systems Neuroscience, Medical Faculty, Heinrich Heine University, Düsseldorf, Germany, 5Autism Center, Child Mind Institute, New York, NY, United States, 6Institut de Cerveau et de la Moelle épinière, Hôpital Pitié Salpêtrière, Paris, France, 7Center for Biomedical Imaging and Neuromodulation, Nathan S. Kline Institute for Psychiatric Research, New York, NY, United States, 8Department of Psychology, University of York, York, United Kingdom
Synopsis
One paradox of autism is the co-occurrence of deficits in sensory and higher-order socio-cognitive processing. The current work examined whether these phenotypical patterns may relate to abnormal macroscale hierarchy affecting both unimodal and
Background
Autism spectrum disorder (ASD) is a life-long neurodevelopmental condition. One paradox of this syndrome is the co-occurrence of deficits both in low-level sensory processing and higher-order functions such as social interactions and communication 1. A brain-based framework to consolidate the heterogeneous phenotypes remains to be established. Resting-state functional connectivity analyses provide a means to probe multiple intrinsic networks, thus promising to capture ASD related anomalies at a system level. In particular, connectome gradient mapping techniques 2,3 offer a novel approach to describe macroscale functional organization in terms of a system-level transition between sensory regions on the one end and transmodal cortices on the other end, recapitulating established cortical hierarchy. Notably, hierarchical organization can also be captured using stepwise functional connectivity analysis (SFCA) 4, which visualizes serial transitions from one system to the next in the connectome space. Indeed, SFCA in healthy brains shows consistent connectivity transitions from primary sensory towards transmodal systems 5. Applying both techniques to a multi-site dataset composed of ASD and controls, we tested whether ASD is associated with atypical connectome hierarchy. The clinical yield of hierarchical measures was tested using a supervised machine learning framework with 5-fold cross-validation.Methods
The discovery sample consisted of 103 males with ASD and 108 neurotypical males from three sites of the autism brain imaging exchange dataset (ABIDE I 6), who had adequate resting-state fMRI and structural MRI data available. fMRI time series were mapped to cortical surfaces in subject-specific space, followed by time-series cross-correlation of all surface-points. Connectome-wide diffusion embedding 2 identified principal gradients of spatial variations in connectivity across the cortical mantle in individual subjects. Following Procrustes alignment of gradients, we used surface-based linear models to compare ASD to controls, controlling for site, age, and multiple comparisons. SFC analyses 4 systematically tracked connectivity propagation from primary sensory seeds (V1, A1, S1) by iteratively counting the number of all possible paths between seed and target regions in a given length of connectivity. Supervised pattern learning leveraged network hierarchy features to predict symptom severity as indexed by the Autism Diagnostic Observation Schedule 7 based on 5-fold cross-validation. Reproducibility of findings was verified in an independent replication sample with similar demographic characteristics (ABIDE II; 60 ASD, 59 controls).Results
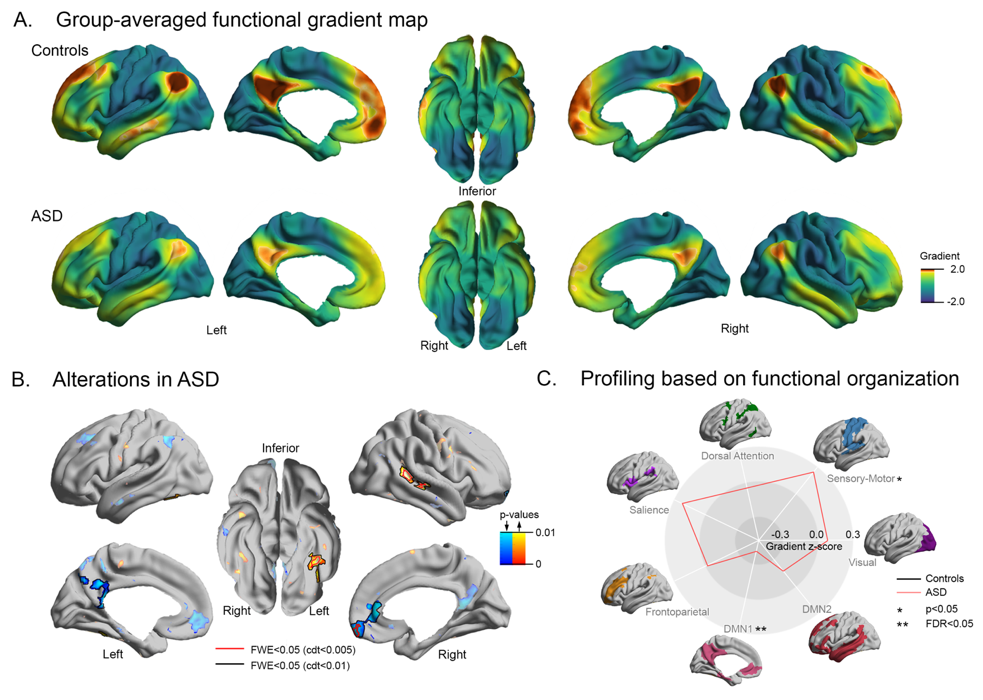
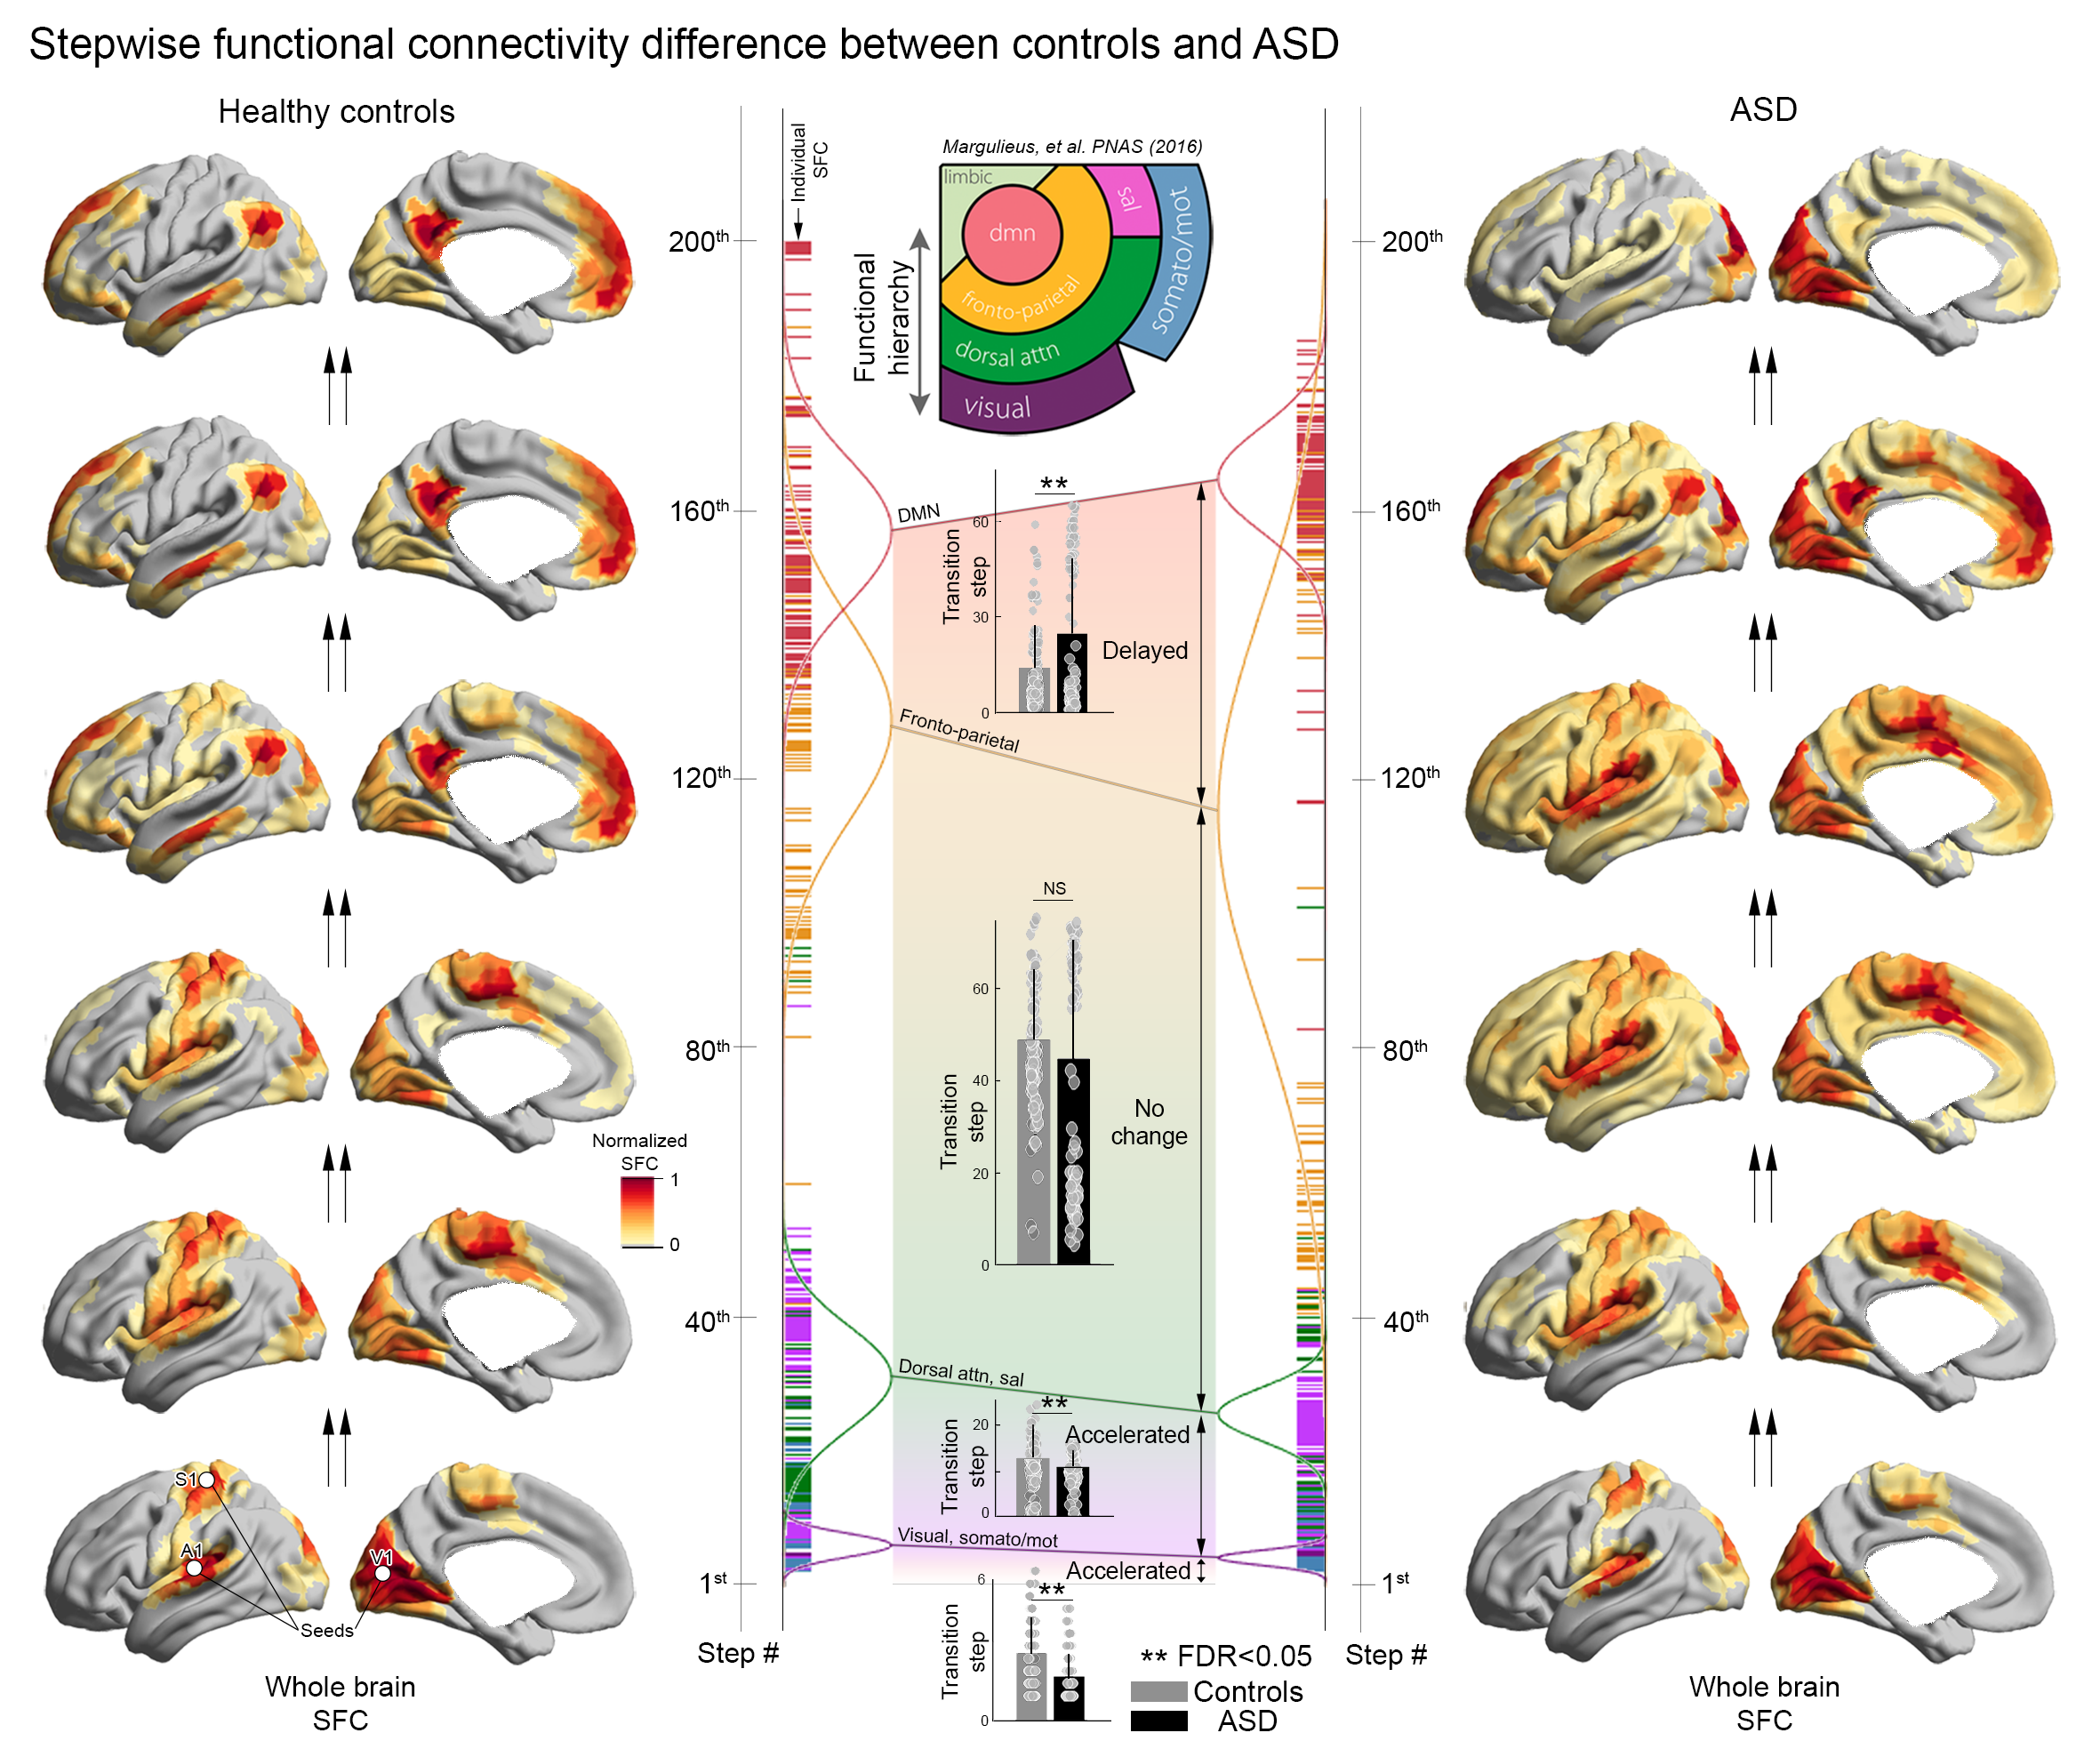
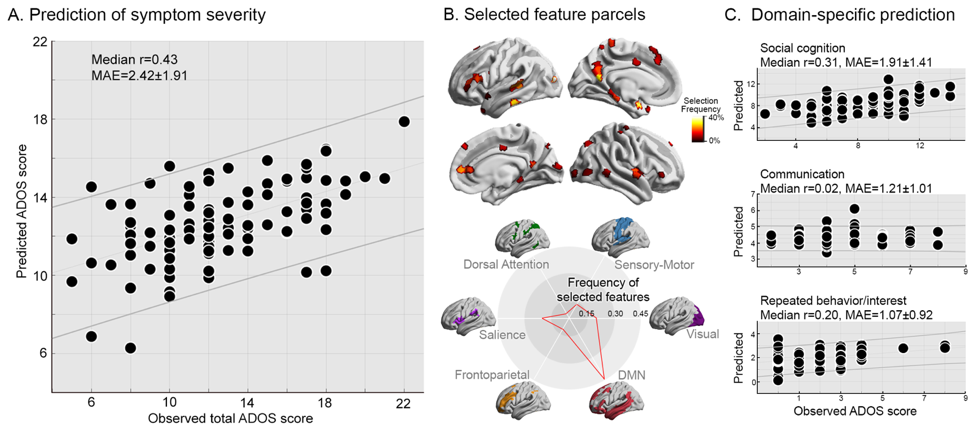
Compared to controls, ASD showed atypical connectome gradients (Fig 1A) i.e., decreased gradient scores in left precuneus (PCU) and right medial prefrontal cortices (mPFC) – and increases mainly in occipitotemporal (OT; fusiform) and middle posterior temporal (pMTG) areas (Fig 1B). Profiling using Yeo-Krienen’s functional communities 8 summarized these patterns, showing decreases in the default mode and increases in sensory-motor networks (Fig 1C). While the SFCA in controls recapitulated the principal gradient findings showing a selective convergence in the default mode core, ASD presented with distorted step-wise connectivity and a failure to converge in the default mode network (Fig 2). Our main findings were replicated across an independent dataset, parameter choices, and when controlling for motion and various methodological confounds. Finally, supervised pattern learning with 5-fold cross-validation could predict symptom severity based on gradient and SFC information, particularly in high-level social-cognitive and low-level repetitive domains (Fig 3).Conclusion
Leveraging novel connectome gradient and SFC mapping techniques, our findings suggest imbalanced network hierarchy as a parsimonious reference frame to consolidate low- and high-level ASD symptomatology.Acknowledgements
No acknowledgement found.References
1. Robertson CE, Baron-Cohen S. Sensory perception in autism. Nat Rev Neurosci 2017; 18(11): 671-684.
2. Coifman RR, Lafon S, Lee AB, Maggioni M, Nadler B, Warner F et al. Geometric diffusions as a tool for harmonic analysis and structure definition of data: Diffusion maps. P Natl Acad Sci USA 2005; 102(21): 7426-7431.
3. Margulies DS, Ghosh SS, Goulas A, Falkiewicz M, Huntenburg JM, Langs G et al. Situating the default-mode network along a principal gradient of macroscale cortical organization. Proc Natl Acad Sci U S A 2016; 113(44): 12574-12579.
4. Sepulcre J, Sabuncu MR, Yeo TB, Liu H, Johnson KA. Stepwise connectivity of the modal cortex reveals the multimodal organization of the human brain. J Neurosci 2012; 32(31): 10649-10661.
5. Huntenburg JM, Bazin PL, Margulies DS. Large-Scale Gradients in Human Cortical Organization. Trends Cogn Sci 2018; 22(1): 21-31.
6. Di Martino A, Yan CG, Li Q, Denio E, Castellanos FX, Alaerts K et al. The autism brain imaging data exchange: towards a large-scale evaluation of the intrinsic brain architecture in autism. Mol Psychiatry 2014; 19(6): 659-667.
7. Lord C, Risi S, Lambrecht L, Cook EH, Jr., Leventhal BL, DiLavore PC et al. The autism diagnostic observation schedule-generic: a standard measure of social and communication deficits associated with the spectrum of autism. J Autism Dev Disord 2000; 30(3): 205-223.
8. Yeo BT, Krienen FM, Sepulcre J, Sabuncu MR, Lashkari D, Hollinshead M et al. The organization of the human cerebral cortex estimated by intrinsic functional connectivity. J Neurophysiol 2011; 106(3): 1125-1165.
9. Mesulam M. The evolving landscape of human cortical connectivity: facts and inferences. Neuroimage 2012; 62(4): 2182-2189.
Figures