0187
Neural Correlates of Rumination in Normal and Major Depressive Disorder: A Brain Network Analysis1Icahn School of Medicine at Mount Sinai, New York, NY, United States
Synopsis
Major depressive disorder (MDD) patients exhibit higher rumination levels; repetitive thinking and focus on negative states. Rumination is known to be associated with brain cortical midline and limbic structures, yet, the underlying brain network topological organization remains unclear. Implementing a graph-theory analysis we tested whether whole brain network connectivity hierarchies during fMRI resting state are associated with rumination. We found a significant correlation between right caudal anterior cingulate (cACC) connectivity strength and subjective rumination tendency. This result emphasize the cACC impact during self-reflective processing, which might serve as biomarker for clinical diagnosis.
Introduction
Ruminative brooding is conceptualized as repetitive thinking and focus on one’s distress and negative mood states with high self-critical nature.1 Patients with major depressive disorder (MDD) exhibit increased levels of rumination2 which have been found to increase the risk of depressive relapse in remitted patients.3 In neuroimaging, rumination has been associated with aberrant activity of the medial prefrontal cortex, anterior cingulate cortex (ACC), insula, temporal pole, hippocampus, and amygdala.4-8 Yet, little is known about alterations of the topological organization of whole-brain networks during self-referential processing in relation to rumination. Resting state functional MRI (fMRI) offers a good modality to examine brain network connectivity when resting and not engaging in specific cognitive tasks, when self-referential processing such as rumination can predominate.5 In order to examine the whole brain functional topological organization we applied a graph theoretical approach. We hypothesized that the functional brain network topological organization will distinguish between MDD patients and healthy controls (HC) and will also associate with individual differences in self-reported rumination scores.Methods
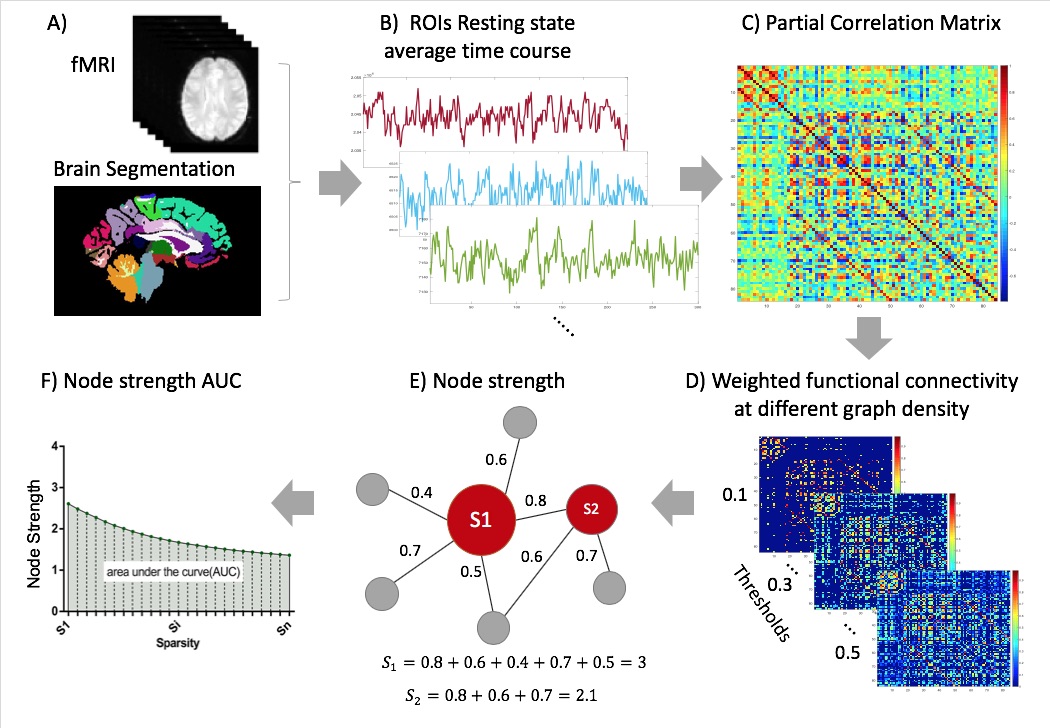
Thirteen MDD patients and 21 HC underwent resting state fMRI. Data were acquired on a Siemens Magnetom 7T MRI scanner (Erlangen, Germany). Functional images were processed using the multi-echo independent component analysis implemented in the AFNI meica.py toolbox.9 Each subjects anatomical T1 brain image was segmented into the Desikan-Killiany Atlas10 applied in FreeSurfer 6.0. The segmentation resulted in 84 regions of interest each representing a node of the network (Figure 1A). To define the network edges, we calculated the partial correlation coefficients between the regional mean time-series of all pairwise regions (excluding the effects of all other regions) (Figure 1C). To enable comparison across participants, we used a sparsity threshold S, which retains S% of the top connections for each participant (Figure 1D). Using the Brain Connectivity Toolbox,11 we examined the most common weighted network property of node strength which is the sum of weights of links connected to the node (Figure 1E). We examined the node strength across a range of thresholds (10% < S < 30% in steps of 1%).12 We then calculated the area under the curve for each network, which provides a summarized measure independent of single threshold selection12 (Figure 1F). We conducted a between-group t-test for each region's strength degree. All results were corrected for multiple comparisons (corrected for number of nodes), using false discovery rate (FDR) correction (q<0.05).13 Next, we conducted Pearson correlations to assess the association between the regions strength degree and the subjective ruminative brooding scores as assessed by the Ruminative Responses Scale (RRS).14 Partial correlation was used to control for age and gender as covariates. We then corrected for multiple comparisons using FDR (q<0.05) (corrected for number of nodes).Results
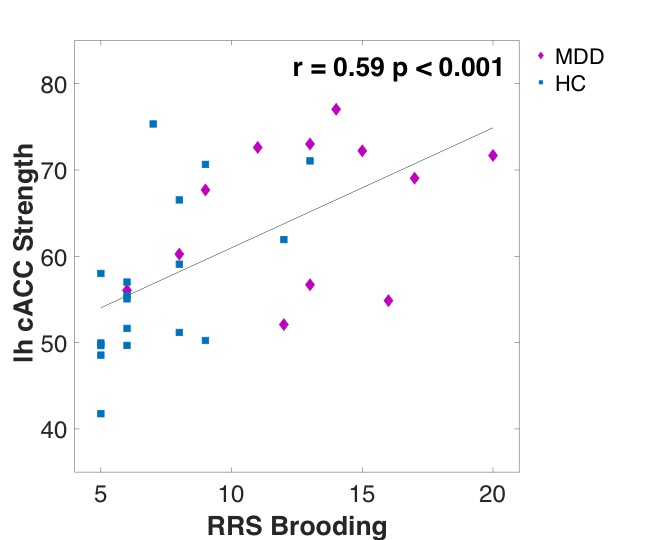
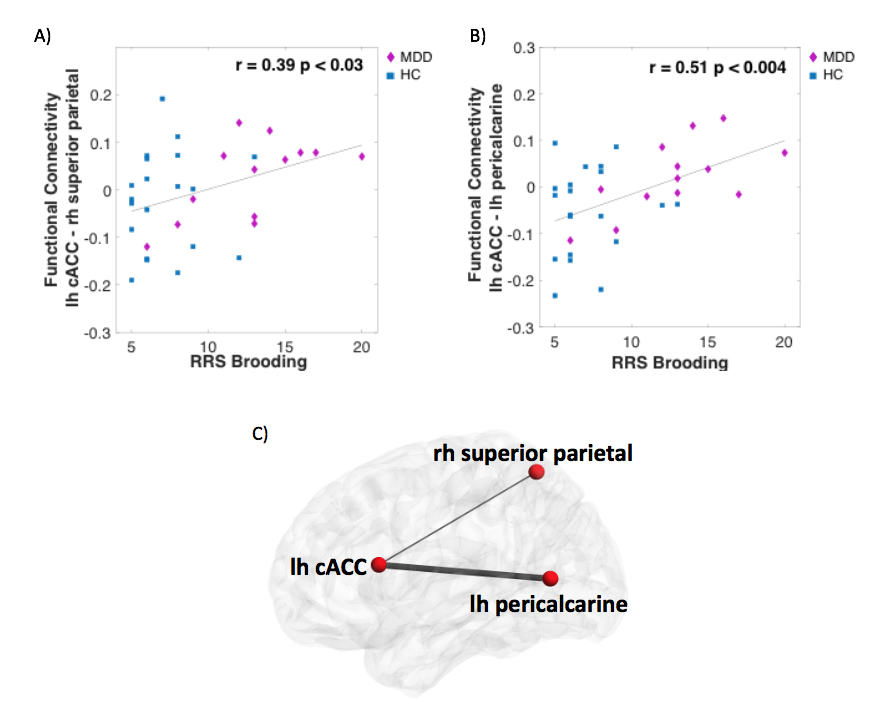
The results revealed that MDD patients exhibited the same hierarchy of regions strength in the network as HC during rest (Figure 2A). However, across all participates, higher strength of the right caudal ACC (cACC) during rest was associated with greater ruminative brooding score (r=0.85, p<0.0003, q FDR<0.05) (Figure 2B). The cACC was also positively correlated with the rumination brooding score only among the HC group (r=0.65, p<0.007, uncorrected), and with a trend among the MDD group (r=0.51, p=0.12). Further exploration of the cACC functional connectivity exhibited that greater ruminative brooding tendency was associated with increased connectivity with the left pericalcarine (r=0.51, p<0.004, uncorrected) and right superior parietal (r=0.39, p<0.03, uncorrected)(Figure 3). However, none of these results survived the FDR correction.Discussion
Our results showed that the MDD patients exhibit the same manner of network topology as HC during resting state. Nevertheless, we showed that the higher the subjects’ cACC strength within the whole brain network the higher their tendency to ruminate. These results are in line with previous studies showing ACC hyperactivity during self-referential processing in MDD patients.8,15,16 The overall increased cACC strength in the brain network indicates higher correlations to the rest of the regions, which might imply of its maladaptive functionality. Specific increased connectivity with the pericalcarine and right superiorparietal may govern this hyper-connectivity, however further research is needed to improve statistics. Our findings add to existing research by inspecting a large-scale brain network hierarchy and revealing the cACC as a critical node in context of rumination.Conclusion
In conclusion, our results highlight the cACC impact on the whole brain network during resting state among normal and MDD patients in relation to ruminative brooding. The network hierarchy and specifically the role of the cACC within the functional brain network in context of self-referential processing might serve as biomarkers for clinical diagnosis and neuromodulation-based interventions for MDD patients.Acknowledgements
NIH R01 MH109544Icahn
School of Medicine Capital Campaign
Translational and Molecular Imaging Institute
References
1 Nolen-Hoeksema, S., Morrow, J. & Fredrickson, B. L. Response styles and the duration of episodes of depressed mood. Journal of abnormal psychology 102, 20-28 (1993).
2 Nolen-Hoeksema, S., Wisco, B. E. & Lyubomirsky, S. Rethinking Rumination. Perspectives on Psychological Science 3, 400-424, doi:10.1111/j.1745-6924.2008.00088.x (2008).
3 Roberts, J. E., Gilboa, E. & Gotlib, I. H. Ruminative Response Style and Vulnerability to Episodes of Dysphoria: Gender, Neuroticism, and Episode Duration. Cognitive Therapy and Research 22, 401-423, doi:10.1023/a:1018713313894 (1998).
4 Fossati, P. et al. In search of the emotional self: an fMRI study using positive and negative emotional words. The American journal of psychiatry 160, 1938-1945, doi:10.1176/appi.ajp.160.11.1938 (2003).
5 Gusnard, D. A., Akbudak, E., Shulman, G. L. & Raichle, M. E. Medial prefrontal cortex and self-referential mental activity: relation to a default mode of brain function. Proceedings of the National Academy of Sciences of the United States of America 98, 4259-4264, doi:10.1073/pnas.071043098 (2001).
6 Ochsner, K. N. & Gross, J. J. The cognitive control of emotion. Trends in cognitive sciences 9, 242-249, doi:10.1016/j.tics.2005.03.010 (2005).
7 van der Meer, L., Costafreda, S., Aleman, A. & David, A. S. Self-reflection and the brain: a theoretical review and meta-analysis of neuroimaging studies with implications for schizophrenia. Neuroscience and biobehavioral reviews 34, 935-946, doi:10.1016/j.neubiorev.2009.12.004 (2010).
8 Nejad, A., Fossati, P. & Lemogne, C. Self-Referential Processing, Rumination, and Cortical Midline Structures in Major Depression. Frontiers in Human Neuroscience 7, doi:10.3389/fnhum.2013.00666 (2013).
9 Kundu, P., Inati, S. J., Evans, J. W., Luh, W. M. & Bandettini, P. A. Differentiating BOLD and non-BOLD signals in fMRI time series using multi-echo EPI. NeuroImage 60, 1759-1770, doi:10.1016/j.neuroimage.2011.12.028 (2012).
10 Desikan, R. S. et al. An automated labeling system for subdividing the human cerebral cortex on MRI scans into gyral based regions of interest. NeuroImage 31, 968-980, doi:10.1016/j.neuroimage.2006.01.021 (2006).
11 Rubinov, M. & Sporns, O. Complex network measures of brain connectivity: uses and interpretations. NeuroImage 52, 1059-1069, doi:10.1016/j.neuroimage.2009.10.003 (2010).
12 Korgaonkar, M. S., Fornito, A., Williams, L. M. & Grieve, S. M. Abnormal Structural Networks Characterize Major Depressive Disorder: A Connectome Analysis. Biological Psychiatry 76, 567-574, doi:https://doi.org/10.1016/j.biopsych.2014.02.018 (2014).
13 Benjamini, Y. & Hochberg, Y. Controlling the False Discovery Rate: A Practical and Powerful Approach to Multiple Testing. Journal of the Royal Statistical Society. Series B (Methodological) 57, 289-300, doi:10.2307/2346101 (1995).
14 Treynor, W., Gonzalez, R. & Nolen-Hoeksema, S. Rumination Reconsidered: A Psychometric Analysis. Cognitive Therapy and Research 27, 247-259, doi:10.1023/a:1023910315561 (2003).
15 Kessler, H. et al. Individualized and Clinically Derived Stimuli Activate Limbic Structures in Depression: An fMRI Study. PLOS ONE 6, e15712, doi:10.1371/journal.pone.0015712 (2011).
16 Cooney, R. E., Joormann, J., Eugène, F., Dennis, E. L. & Gotlib, I. H. Neural correlates of rumination in depression. Cognitive, Affective, & Behavioral Neuroscience 10, 470-478, doi:10.3758/cabn.10.4.470 (2010).
Figures