0186
Discrete Regions of Gray Matter Loss Underlie Major Depressive Disorder: A Replication and Expanded Investigation1Sydney Translational Imaging Laboratory, Heart Research Institute, Charles Perkins Centre, University of Sydney, Sydney, Australia, 2General Electric Healthcare, Melbourne, Australia, 3The Brain Dynamics Centre, Westmead Millennium Institute and Sydney Medical School, Sydney, Australia, 4Department of Psychiatry and Behavioral Sciences, University of Miami Miller School of Medicine, Miami, FL, United States, 5Sierra-Pacific Mental Illness Research, Education, and Clinical Center (MIRECC), Veterans Affairs Palo Alto Health Care System, Palo Alto, CA, United States, 6Brain Resource Ltd, Sydney, Australia, 7Duke-National University of Singapore, Singapore, Singapore, 8Department of Psychiatry, Duke Medical School, Durham, NC, United States, 9Department of Radiology, Royal Prince Alfred Hospital, Sydney, Australia
Synopsis
The aims of this study were to construct a biomarker based on anatomical regions of profoundly reduced gray matter volume in subjects with major depressive disorder. Our biomarker successfully discriminated MDD subjects from controls at an accuracy of 73%, suggesting a possible role for network measurements of GM susceptibility in MDD.
Introduction
Major depressive disorder (MDD) is a frequent yet particularly heterogeneous psychiatric illness, with diverse clinical trajectory and unpredictable response to treatment 1. Due to this complexity, there have been intensified efforts to understand the underlying biological and anatomical effects 2. Increasing evidence suggests gray matter (GM) alteration is a potential structural hallmark of MDD, however the precise regions of GM susceptibility have not been fully elucidated. Magnetic resonance imaging (MRI) with voxel-based morphometry (VBM) provides an opportunity for analysis of GM structural differences without imposing a priori hypotheses as to anatomical regions. Our previous work demonstrated widespread bilateral reductions in GM volume in MDD 3, leading us to speculate that MDD is characterized biologically by an underlying abnormal structural network across the brain. In this current study, we expanded our analysis by defining particular regions of GM vulnerability in MDD.Methods
Data were drawn from the International Study to Predict Optimized Treatment in Depression (iSPOT-D) study, with baseline MRI in healthy controls (n = 66), and clinician-diagnosed MDD subjects with first-episode MDD ≤ 35 years of age (n = 86). MRI data were acquired using a 3 Tesla GE Signa HDx scanner (GE Healthcare, Milwaukee, Wisconsin) as previously described 4 using an 8-channel head coil. T1-weighted images were obtained using a contiguous AC-PC aligned sagittal IR-SPGR sequence (TR=8.3 ms, TE=3.2 ms, TI=500 ms, flip angle=11 degrees, matrix=256 × 256, voxel dimensions=1 mm isotropic, NEX=1). T1-weighted images were preprocessed using SPM12 (Statistical Parametric Mapping, Institute of Neurology, London, UK), normalized using an affine followed by non-linear registration, corrected for bias field in homogeneities, registered to standard MNI space and then segmented into GM, white matter and cerebrospinal fluid components. Whole-brain VBM was performed to determine GM volume using the Computational Anatomy Toolbox (CAT12; Structural Brain Mapping group, Jena University Hospital, Jena, Germany) for SPM12. To precisely map the spatial pattern of GM volume change, we inspected the whole-brain T-scores corresponding to local maxima for discrete anatomical structures. 43 discrete loci were identified, and volumes were determined using 5 mm ROIs centred at local maximum coordinates. Raw voxel volumes for each ROI in the MDD patients was standardized to a normal volumetric range as defined by the control group.Results
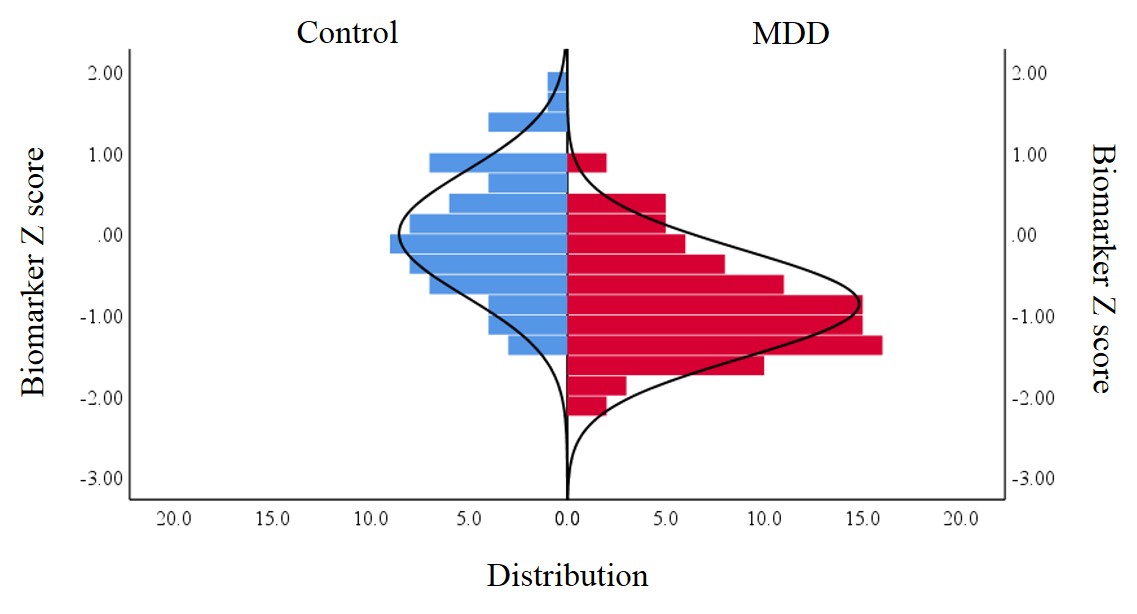
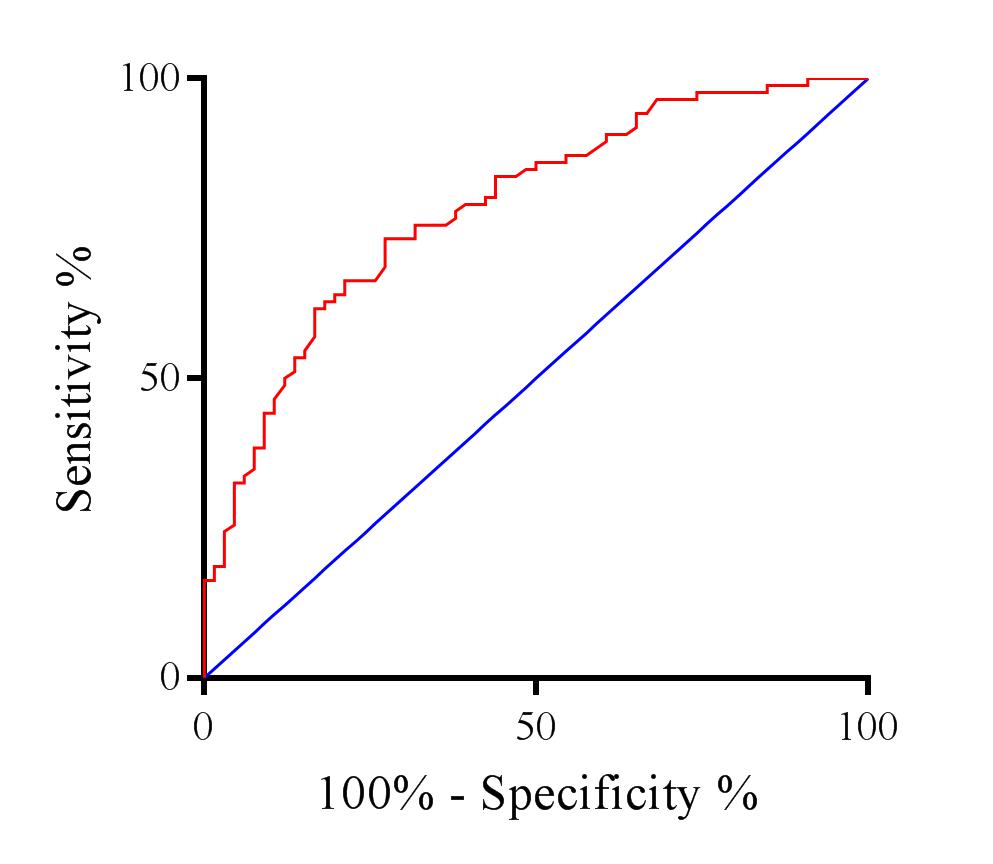
Symmetric and widespread loci of reduced GM volume specific to MDD were demonstrated in a highly conserved replication of our previous findings. Three predominant bilateral clusters were observed in the dorsolateral and dorsomedial prefrontal cortices and the cingulate cortex (Figure 1). One-way ANOVA of ROI volume data revealed significantly lower GM volume in the MDD group at each location examined. The most pronounced differences were found in the DLPFC (26% decrease, p < 0.0001) cerebellar vermis (25% decrease, p < 0.0001), calcarine fissure (20% decrease, p < 0.001) and thalamus (16.3% decrease p < 0.0001). A composite biomarker of these dominant regions of GM change was constructed by summing their Z scores (Figure 2). Performance of the biomarker was assessed by receiver operating characteristic (ROC) analysis, for which the area under the curve (AUC) was 0.78 (Figure 3). At a discrimination threshold of -0.48, sensitivity was 73% and specificity was 72%, with a positive likelihood ratio of 2.40, negative likelihood ratio of 0.33 and overall accuracy of 73%.Discussion
This study extends our prior findings of widespread GM structural abnormality in MDD, and highlights that discrete patterns of GM loss occur in anatomical regions of crucial relevance for MDD. A composite biomarker constructed from maximal regions of reduced GM provided 73% diagnostic accuracy. Our data underlines the notion that pathophysiology of MDD has an important structural component comprising several key regions of abnormal GM volume, which may reflect a primary network of MDD-related structural change.Conclusion
Anatomical change in MDD as measured using GM volumetrics has a specific, highly regional nature, with a characteristic distribution across the brain. Our data are supportive of a possible contributory role for GM measurements as part of a multimodal approach to identification or sub-typing MDD.Acknowledgements
No acknowledgement found.References
1. Otte C, Gold SM, Penninx BW, et al. Major depressive disorder. Nat Rev Dis Primers. 2016;2:16065.
2. Cuthbert BN. Research Domain Criteria: toward future psychiatric nosologies. Dialogues Clin Neurosci. 2015;17(1):89-97.
3. Grieve SM, Korgaonkar MS, Koslow SH, Gordon E, Williams LM. Widespread reductions in gray matter volume in depression. NeuroImage-Clin. 2013;3:332-339.
4. Grieve SM, Korgaonkar MS, Etkin A, et al. Brain imaging predictors and the international study to predict optimized treatment for depression: study protocol for a randomized controlled trial. Trials. 2013;14:224-224.
Figures
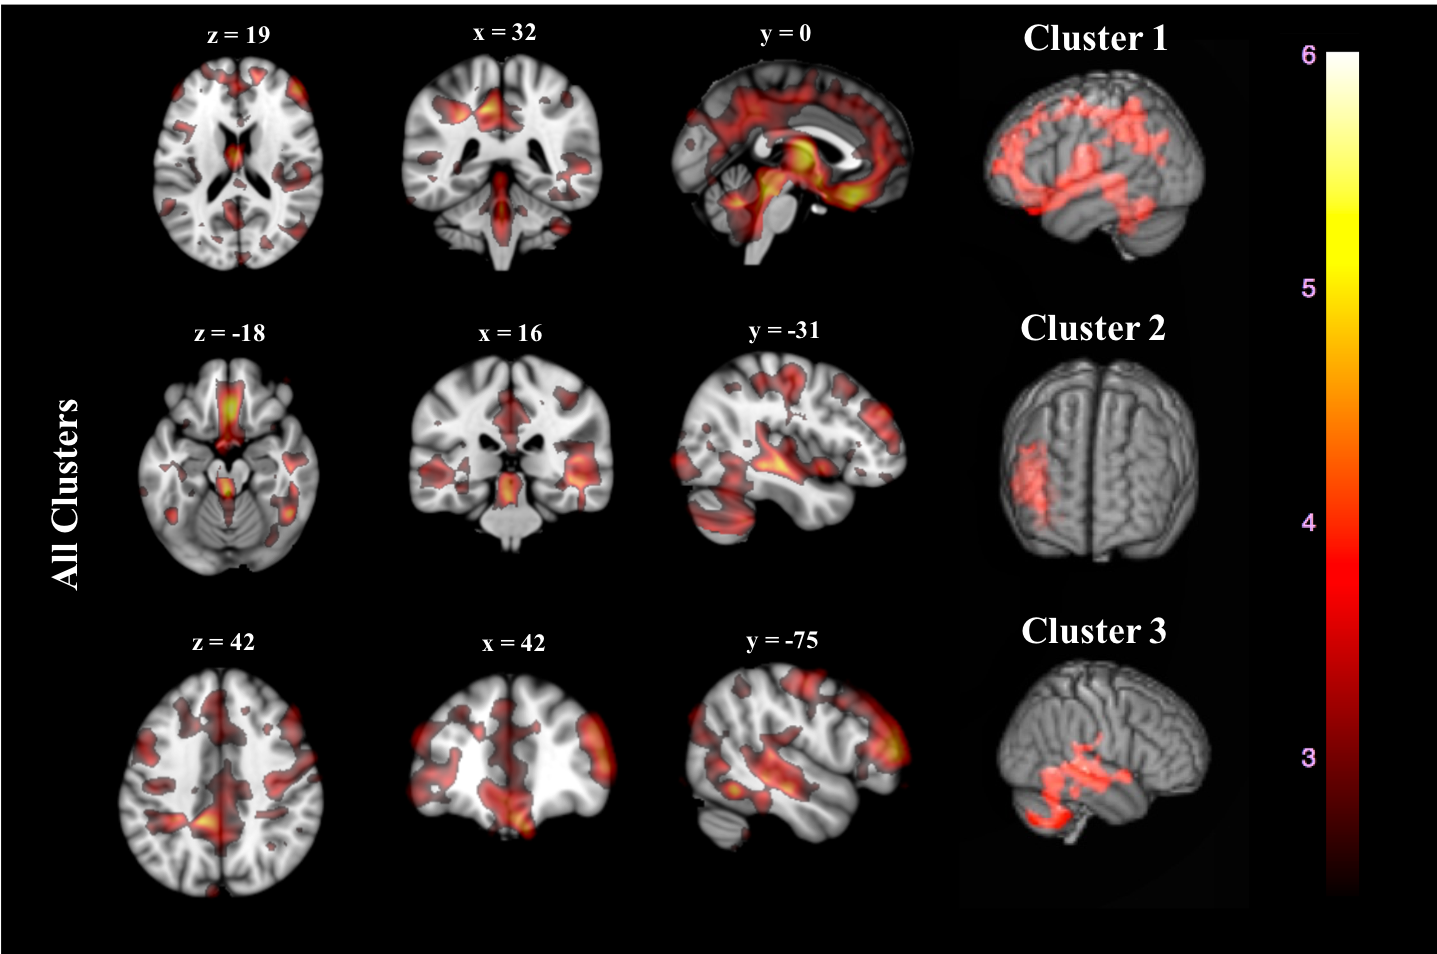
Figure 1. Whole-brain Voxel based morphometry volume differences between MDD and control groups. All clusters are demonstrated in axial, coronal and sagittal view (column 1-3), with anatomical placement of three predominant clusters in 3D render (column 4). Color map indicates scale for t-statistic.