0184
Imaging hippocampal glutamate alterations in a 22q11.2 deletion syndrome mouse model of schizophrenia1Department of Radiology, University of Pennsylvania, Philadelphia, PA, United States, 2Department of Psychiatry, University of Pennsylvania, Philadelphia, PA, United States, 3Department of Pediatrics, University of Pennsylvania, Philadelphia, PA, United States
Synopsis
Schizophrenia (SZ) is a common, severe mental illness caused by neurobiological disturbances in glutamate and dopamine. Glutamate is the major excitatory neurotransmitter in the brain and can be detected using MR spectroscopy and glutamate-weighted chemical exchange saturation transfer (GluCEST) MRI. In this study, we performed high-resolution GluCEST MRI in the 22q11.2 deletion syndrome (22q11.2DS) mouse model of SZ to evaluate glutamatergic alterations in the dorsal and ventral hippocampus. The GluCEST contrast was found to be lower in the hippocampus of 22q11.2DS mice compared to that in the age-matched control mice indicating the lower hippocampal glutamate level in the preclinical model of SZ.
Introduction
22q11.2 Deletion syndrome (22q11.2DS) is the most common chromosomal microdeletion disorder resulting in neurological disorders evinced by variable developmental delays, cognitive deficits and neuropsychiatric illnesses such as anxiety disorders and schizophrenia (SZ)1. 22q11.2DS mouse model mice show some impairments in tasks of cognition indicating its closeness to the human SZ2. Regional cerebral glutamatergic alterations are reported to be associated with schizophrenia in humans3,4,5. Glutamate Chemical Exchange Saturation Transfer (GluCEST) MRI is a recently developed technique that provides glutamate weighted contrast6. GluCEST provides indirect detection of glutamate in vivo by measuring the exchange of glutamate amine protons with bulk water and provides greater sensitivity and spatial resolution than conventional 1H magnetic resonance spectroscopy (MRS) techniques. Despite being not fully specific to glutamate, GluCEST MRI has shown promising results in studies of neurodegeneration due to tau pathology induced synapse loss7, epilepsy8, Huntington’s disease9, schizophrenia10 and MPTP induced parkinsonism11. As various studies have pointed out the role of hippocampus and glutamatergic neuronal activity in the behavioral abnormalities the SZ and related disorders, a tool to image regional glutamatergic homeostasis alterations is required. In this study, we show the application of high-resolution GluCEST MRI to detect spatial changes in hippocampal glutamate levels in the preclinical model closely mimicking schizophrenia in humans.Methods
Four-month-old 22q11.2DS (n=6) and age-matched wild type (WT) mice (n=6) were used for the study. For MR experiments, mice were anesthetized with Isoflurane/Air (1-2%, 1 L/hr) and positioned in a 20mm diameter volume coil (m2m Imaging) at 9.4T Horizontal bore magnet interfaced to Bruker spectrometer (Bruker, USA). GluCEST imaging was performed using a custom-programmed RF spoiled gradient echo readout pulse sequence on two 1-mm thick axial slices covering dorsal and ventral hippocampi with a frequency selective continuous wave saturation preparation pulse. CEST images were collected using a 1-second saturation pulse at B1 of 250 Hz (5.9 μT) for the frequencies ±2.5-3.5 ppm from water resonance with a step size of 0.25 ppm. The imaging parameters were: FOV 20×20 mm2, matrix size 192×192, TR 8s, averages per frequency 8. For the B0 inhomogeneity correction, Water Saturation Shift Referencing (WASSR) B0 correction12 was performed with same parameters as GluCEST except for B1 0.2 μT, CEST pulse saturation length 0.4 sec acquired between 0.0 and ±1 ppm at a step-size 0.1 ppm. B1 maps were calculated from two images acquired using square preparation pulses with flip angles 30° and 60° (pulse duration = 65 μs, averages = 2) followed by a spoiled gradient echo. A flip angle map was generated, and a linear correction for B1 was calculated as a ratio of the actual B1 to the expected value. The B0 corrected images at +3 ppm (M+3ppm) and -3 ppm (M−3ppm) were used for computing the percentage GluCEST contrast, which is equal to 100×[(M−3ppm − M+3ppm)/M−3ppm]. Regions of interest (ROIs) were manually segmented from T2-weighted images.Results and Discussion
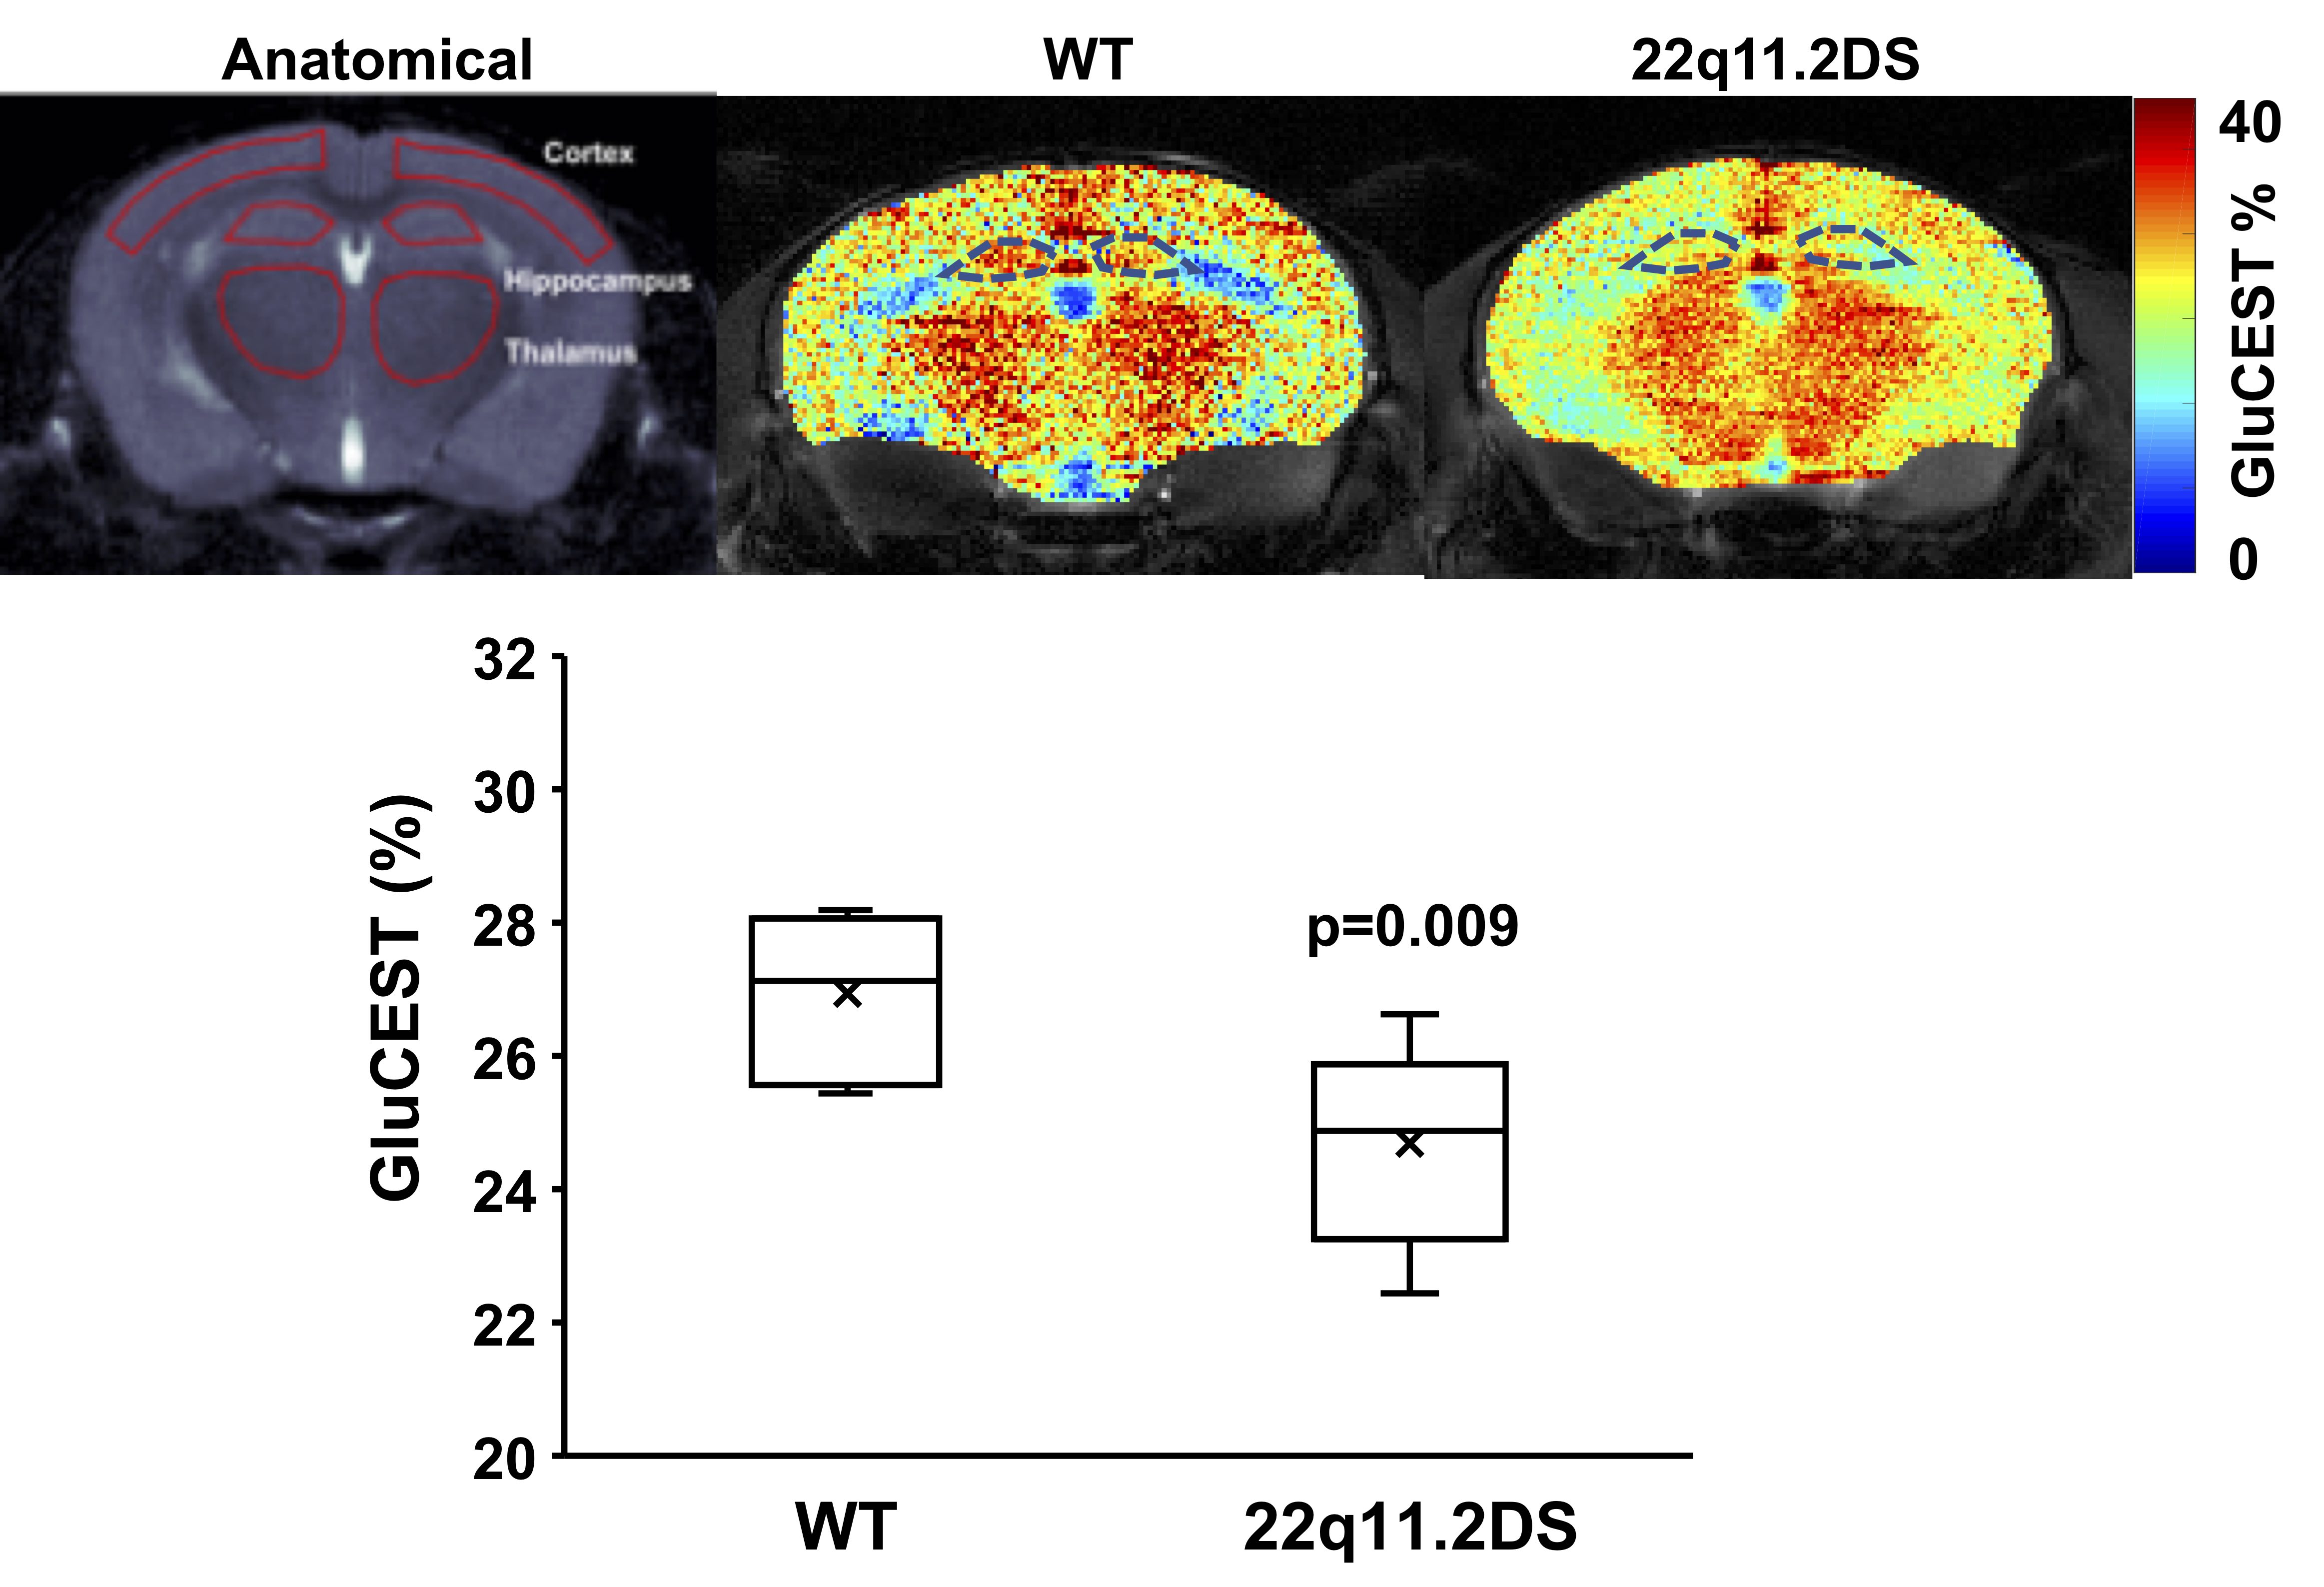
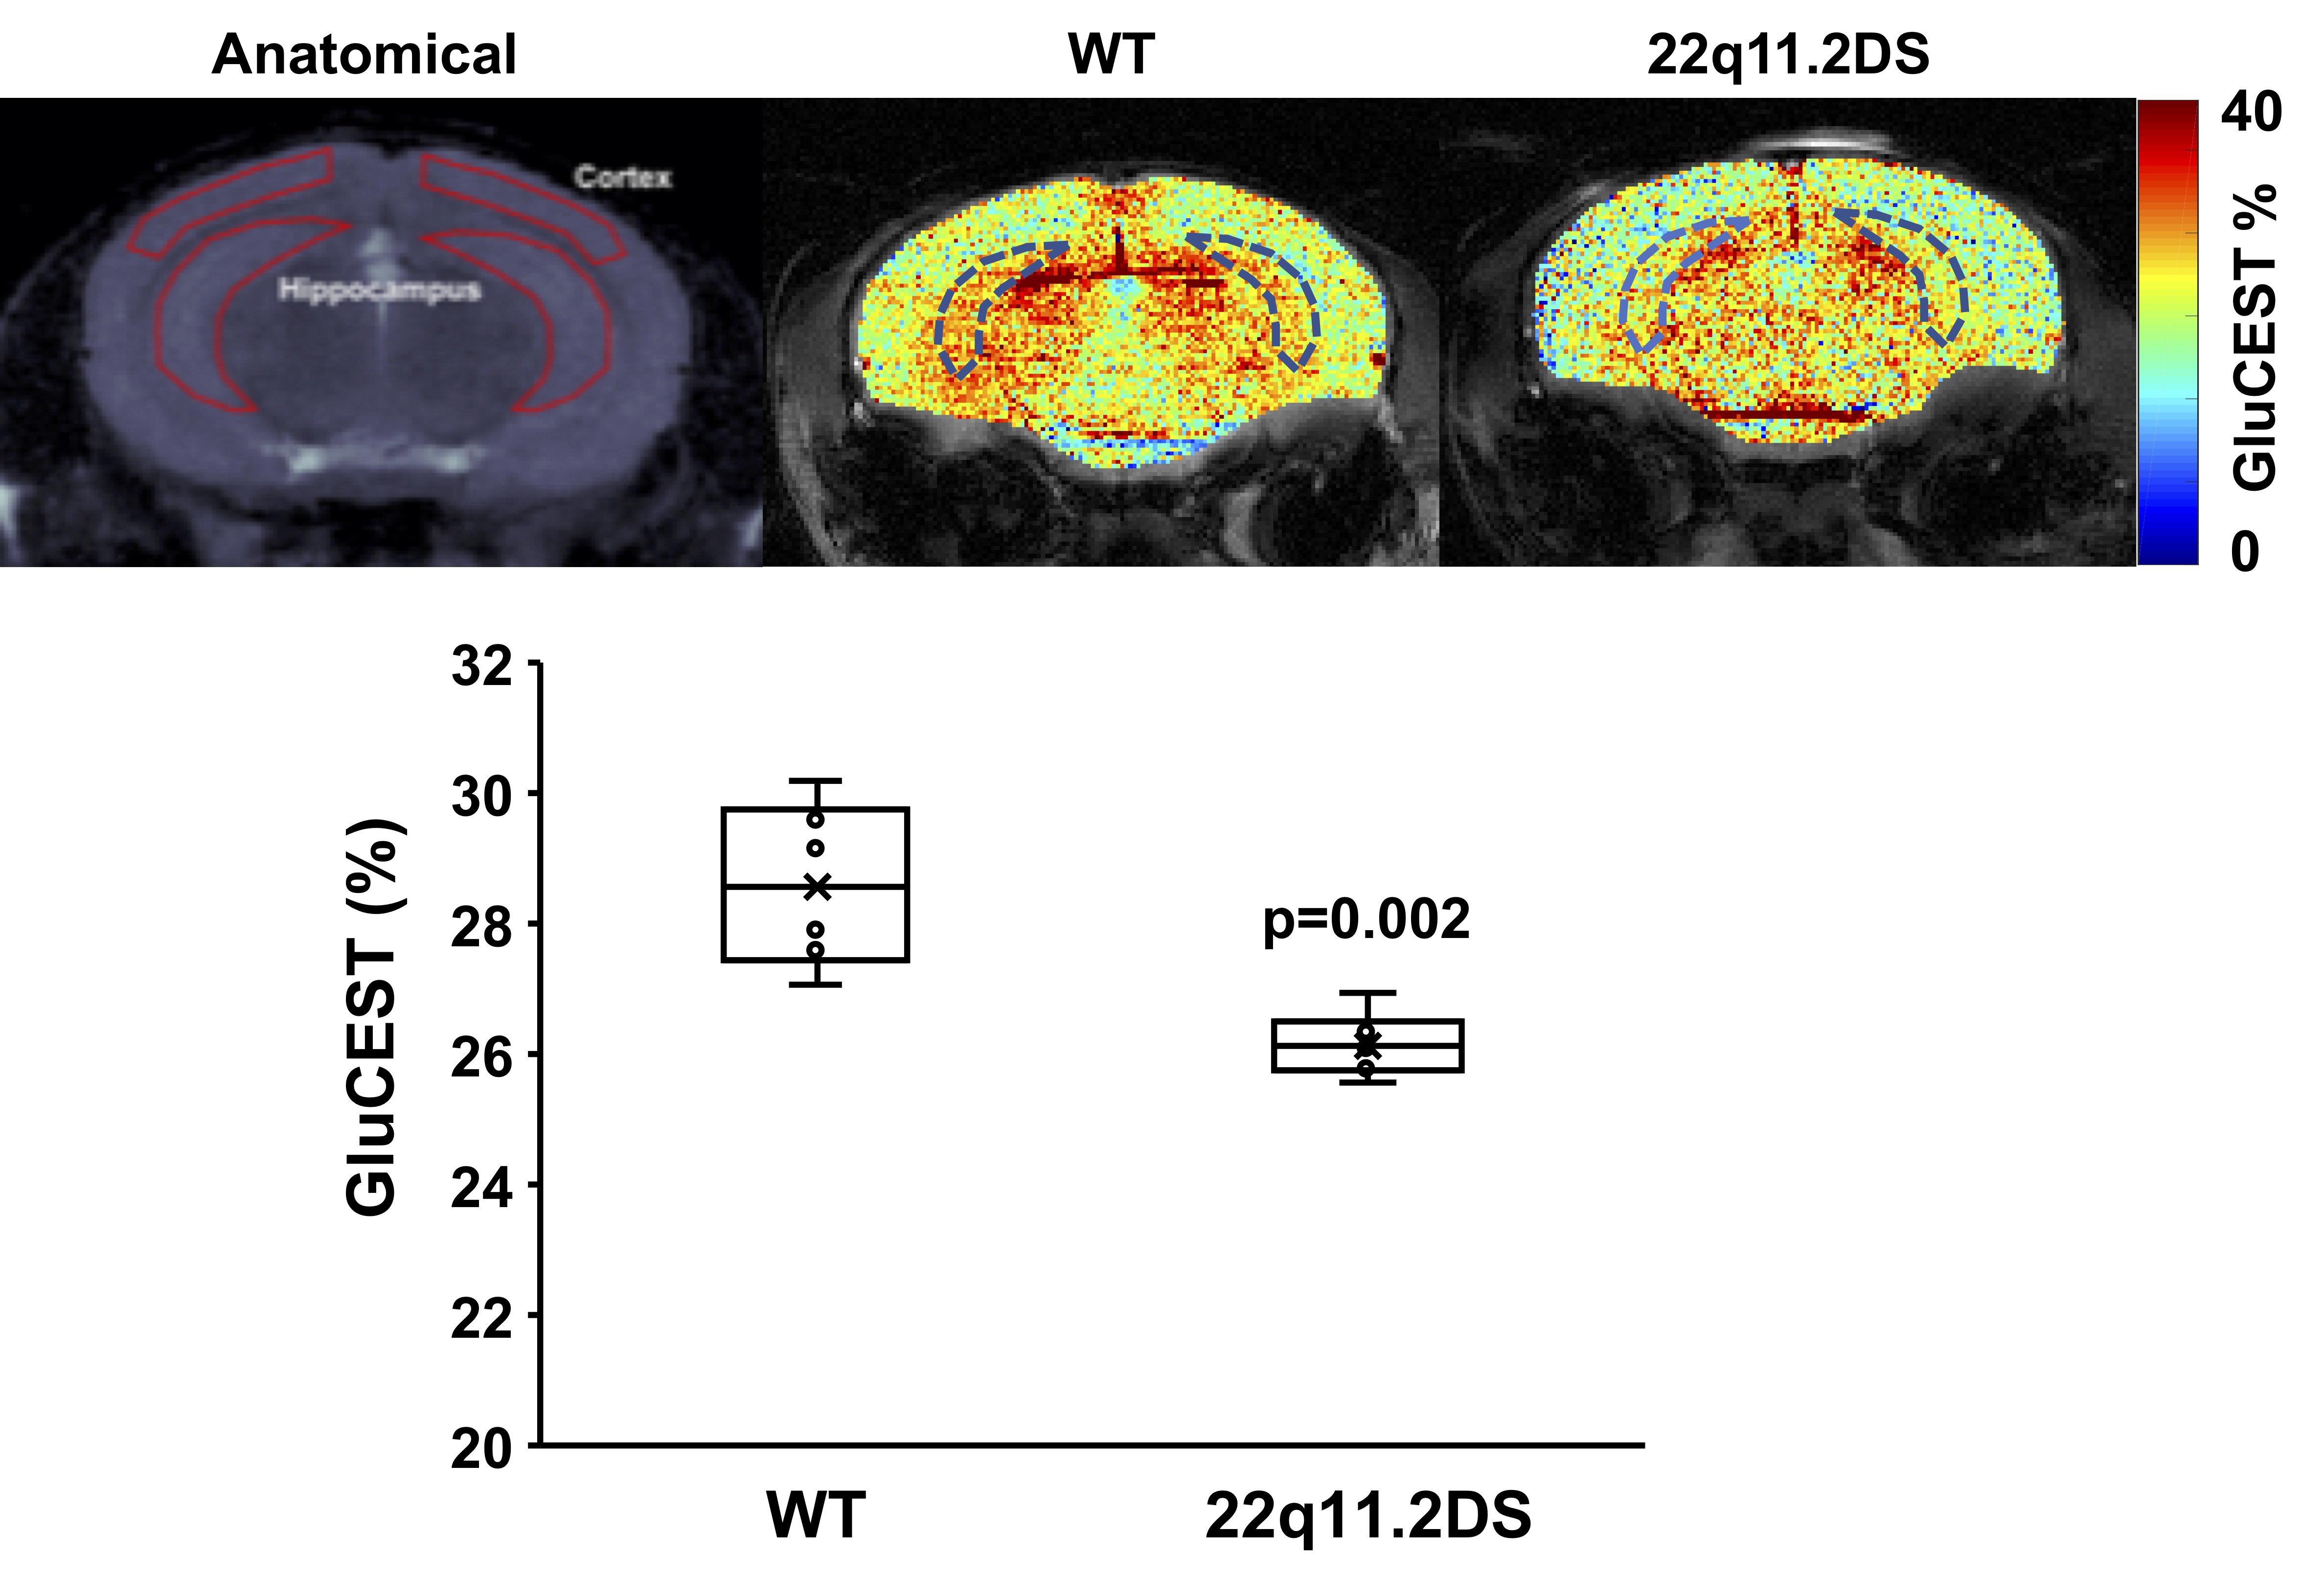
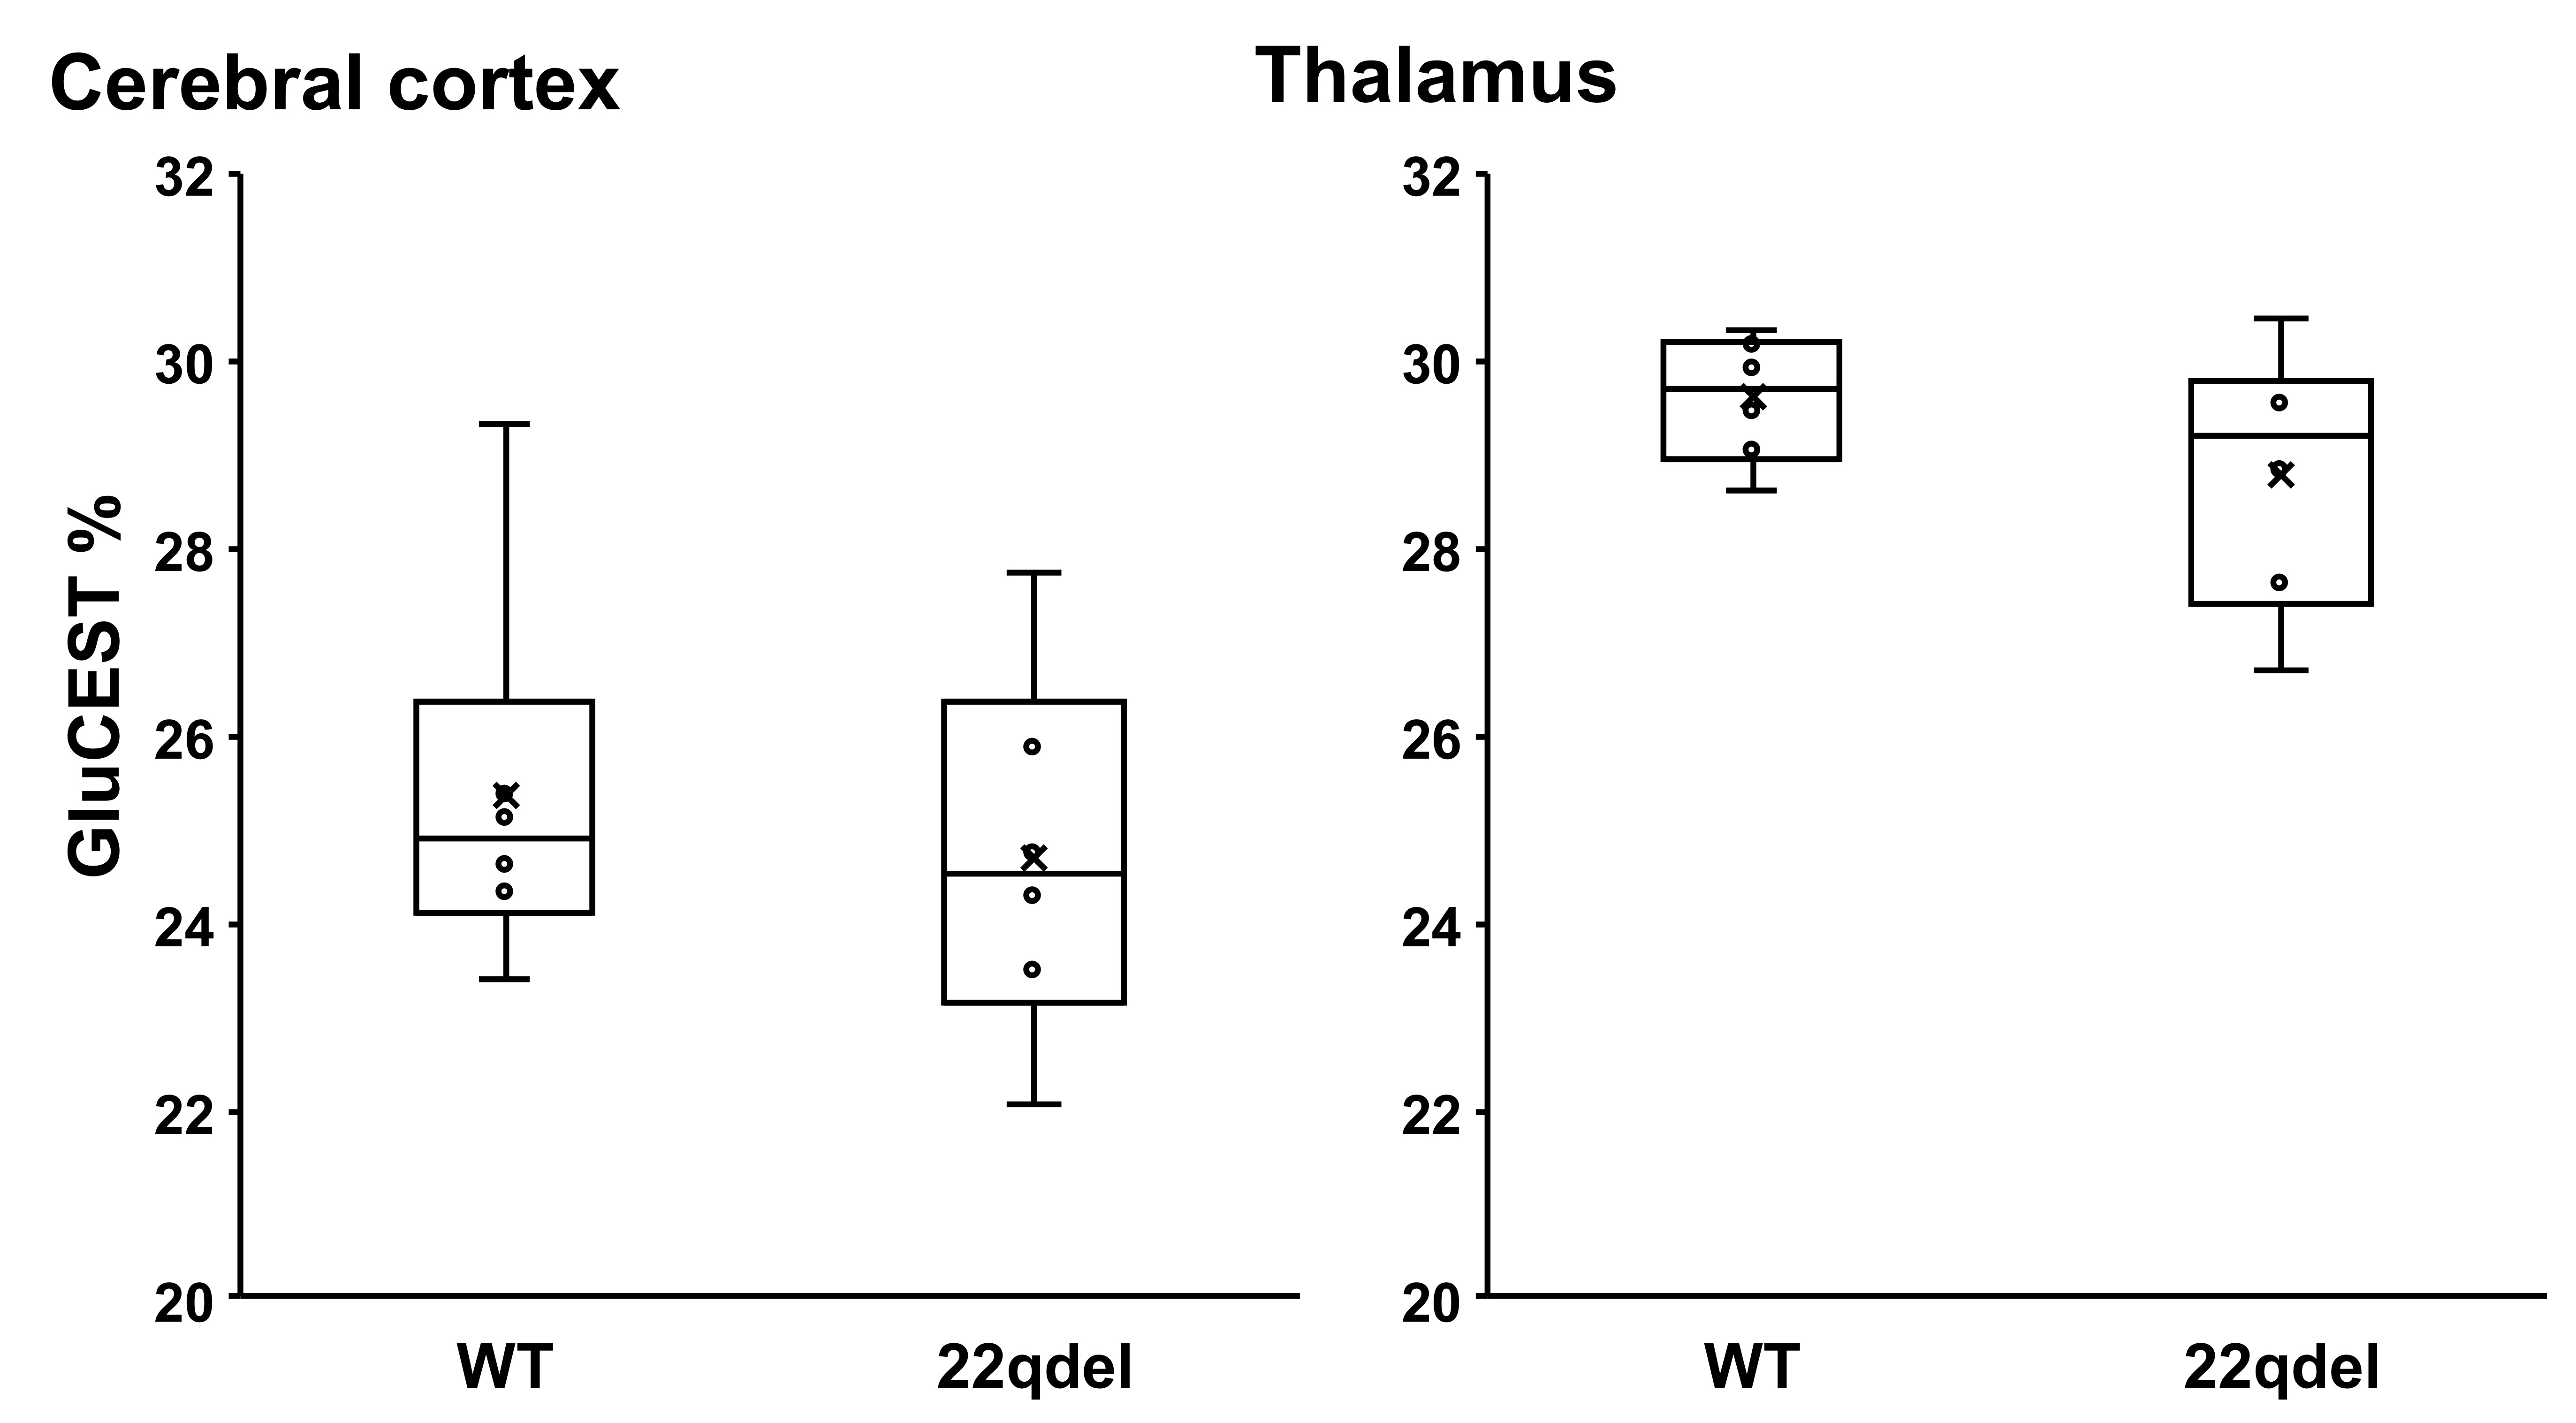
The 22q11.2DS mice had lower dorsal and ventral hippocampal GluCEST contrast compared to WT suggesting lower glutamate in those regions (Figure 1 and 2). The GluCEST contrast was found to be unaltered in the cerebral cortex and thalamus present in the same slice, although the data was trending toward lower GluCEST in those regions (Figure 3). The finding of lower GluCEST is in corroboration with the previous study in human patients of SZ10. The finding of lower GluCEST contrast in the hippocampus may reflect dysfunctional neurotransmission or downregulation of glutamatergic synapses in psychosis as a result of overactive glutamatergic neurons in the early stages. The overactivity of glutamatergic neurons may eventually lead to an excitotoxicity-mediated neuronal loss in the region. Further studies, including 1H MRS, behavioral and molecular analysis of the brain will be performed to understand the underlying mechanisms of the results observed in this study. The GluCEST MR imaging may be potentially applicable as a biomarker for detection of SZ in humans in addition to studying the efficacy of the drug/therapeutic response.Acknowledgements
This project was supported by the National Institute of Biomedical Imaging and Bioengineering of the National Institutes of Health through Grant Number P41-EB015893 and the National Institute of Neurological Disorders and Stroke through Award Number R01NS087516. Funding from the Life Span Brain Institute (LiBI)—a collaboration between the University of Pennsylvania School of Medicine and Children’s Hospital of Philadelphia.References
1. McDonald-McGinn DM et al (2015) Nat Rev Dis Primers 1:15071
2. Sumitomo A et al (2018) Sci Adv 4:eaar6637
3. Marsman A et al (2014) Neuroimage 6:398-407
4. Kumar J et al (2018) Mol Psychiatry https://doi.org/10.1038/s41380-018-0104-7
5. Chen T et al (2017) Shangh Arch Psychiatry 29:277-286
6. Cai K et al (2012) Nat Med 18:302-6
7. Crescenzi R et al (2014) Neuroimage 101:185-92
8. Davis K et al (2015) Sci Transl Med 7:309ra161
9. Pepin J et al (2016) Neuroimage 139:53-64
10. Roalf DR et al (2017) Mol Psychiatry 22:1298-1305
11. Bagga P et al (2016) J Neurochem 139:432-439
12. Kim M et al (2009) Magn Res Med 61:1441-50
Figures