0182
Anatomic alterations in amygdala subregions in medication-free patients with obsessive-compulsive disorder1Department of Radiology, Huaxi MR Research Center (HMRRC), Sichuan University, Chengdu, China, 2Department of Psychiatry, Sichuan University, Chengdu, China, 3Department of Psychiatry and Behavioral Neuroscience, University of Cincinnati, Cincinnati, OH, United States
Synopsis
Most previous human neuroimaging studies measured the volume of amygdala as a whole, however, the amygdala consists of several functionally distinct subnuclei. Recent advances in structural MR image segmentation technique have made it possible to study amygdala subnuclei volumes with a robust, automatic approach using a Bayesian inference-based atlas building algorithm. Using this algorithm, we for the first time provide a distinctive profile of amygdala subnuclei volume abnormality in a relatively large sample of drug-free obsessive-compulsive disorder patients, and provide an insight that these subnuclei contribute to different aspect of neuropathology in the disorder.
Introduction
Obsessive-compulsive disorder (OCD) has a lifetime prevalence of 1-3% of the population and causes significant distress and functional impairment1. Structural and functional imaging studies support a role for amygdala abnormalities in OCD2. Whereas amygdala consists of several histologically and functionally distinct nuclei with potentially distinct relevance for the clinical presentation of OCD3, however, most prior neuroimaging studies of OCD obtained measurements from the whole amygdala. Further, the available literature is not consistent, with reports of both total amygdala volume decrease and increase reported in case-control studies2. This inconsistency may be caused by differences in medication treatments or clinical comorbidity with depression. Hence, in the current study, we recruited a relatively large sample of drug-free OCD patients without comorbid depression to test for volumetric alterations in subnuclei of amygdala with a robust, automatic approach.Method
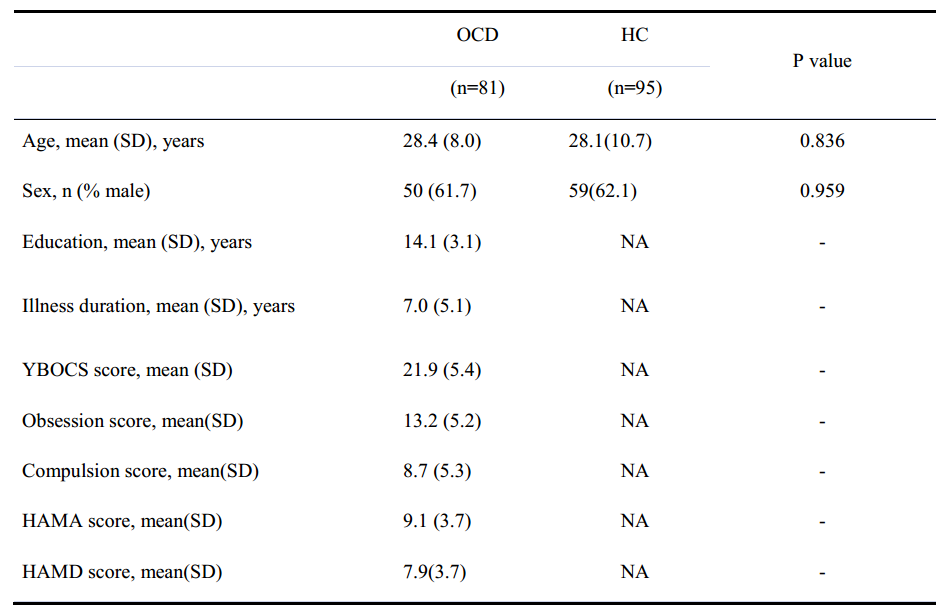
81 DSM-IV criteria diagnosed, medication-naïve OCD patients and 95 age and sex matched healthy control were recruited and informed consents were obtained from all subjects (Table 1). The severity of OCD symptoms was assessed using the Yale-Brown Obsessive Compulsive Scale (Y-BOCS), and anxiety and depression level were assessed using Hamilton Anxiety Scale (HAMA) and Hamilton Depression Scale (HAMD), respectively. High resolution T1 weighted images were obtained using a volumetric 3-dimensional Spoiled Gradient Recall (SPGR) sequence (TR/TE = 8.5/3.4ms; flip angle = 12o; 156 axial slices with thickness = 1mm, field of view = 24×24cm2 and data matrix = 512×512) via a GE 3.0 T scanner.
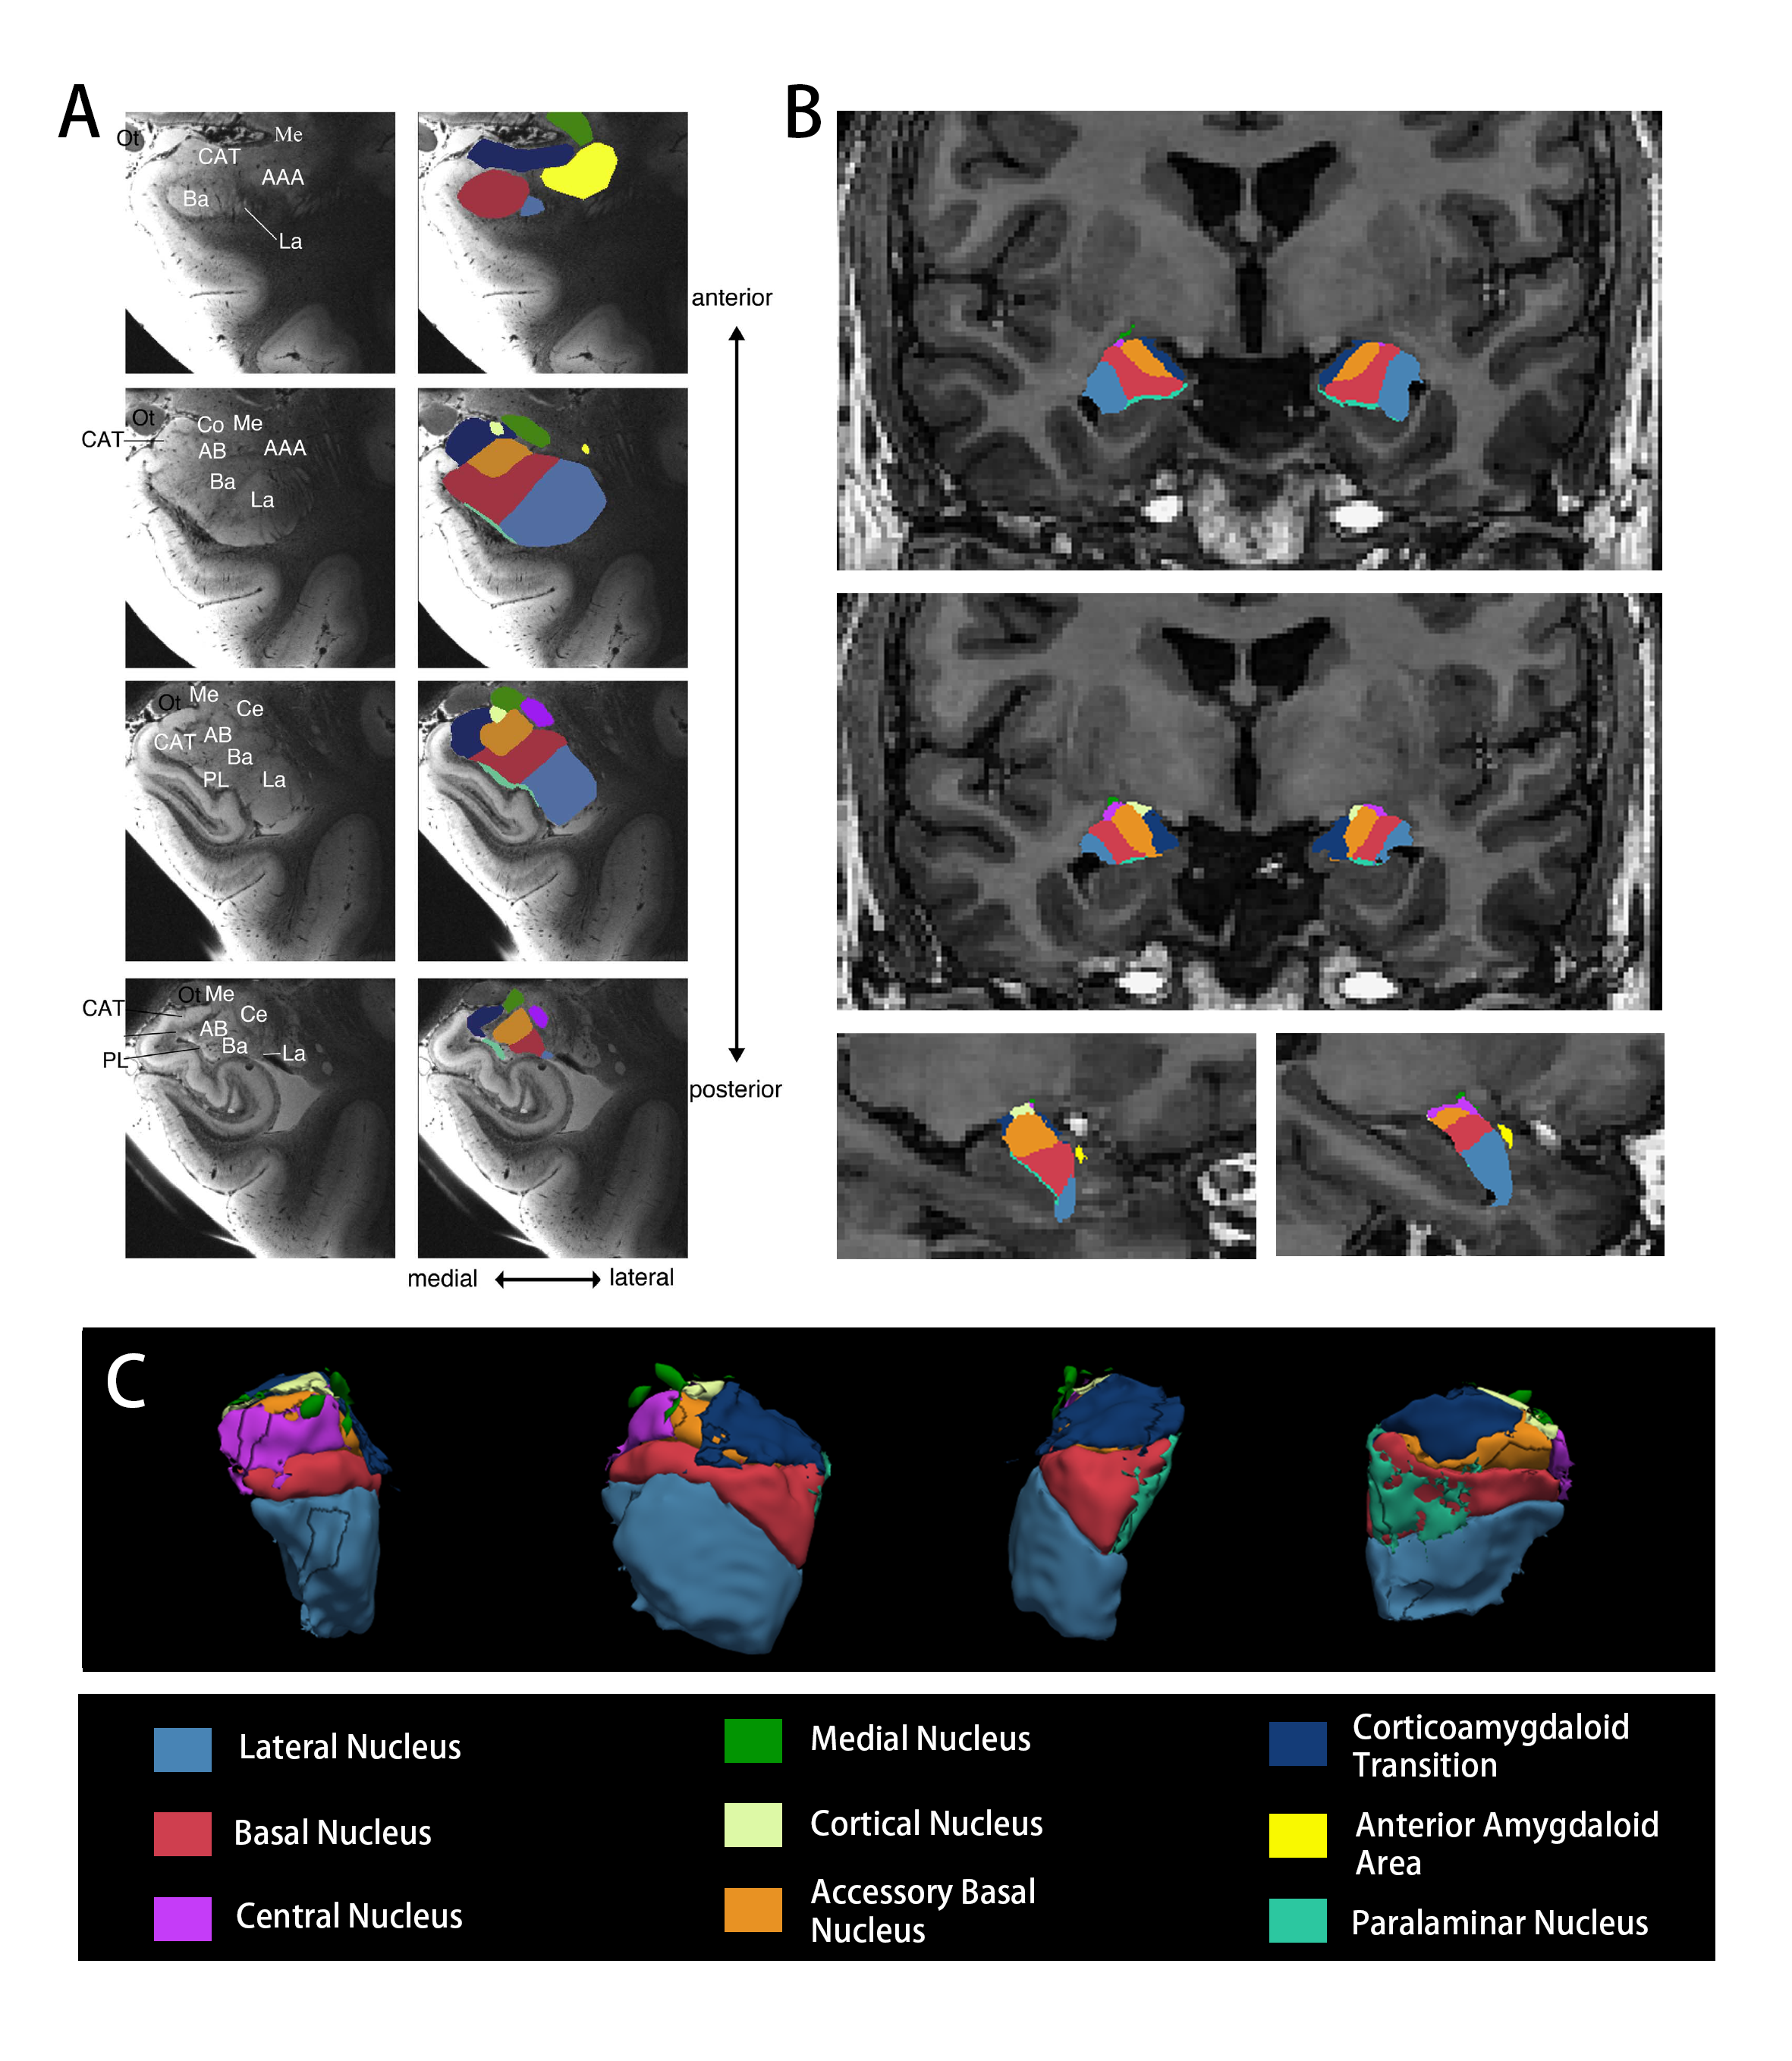
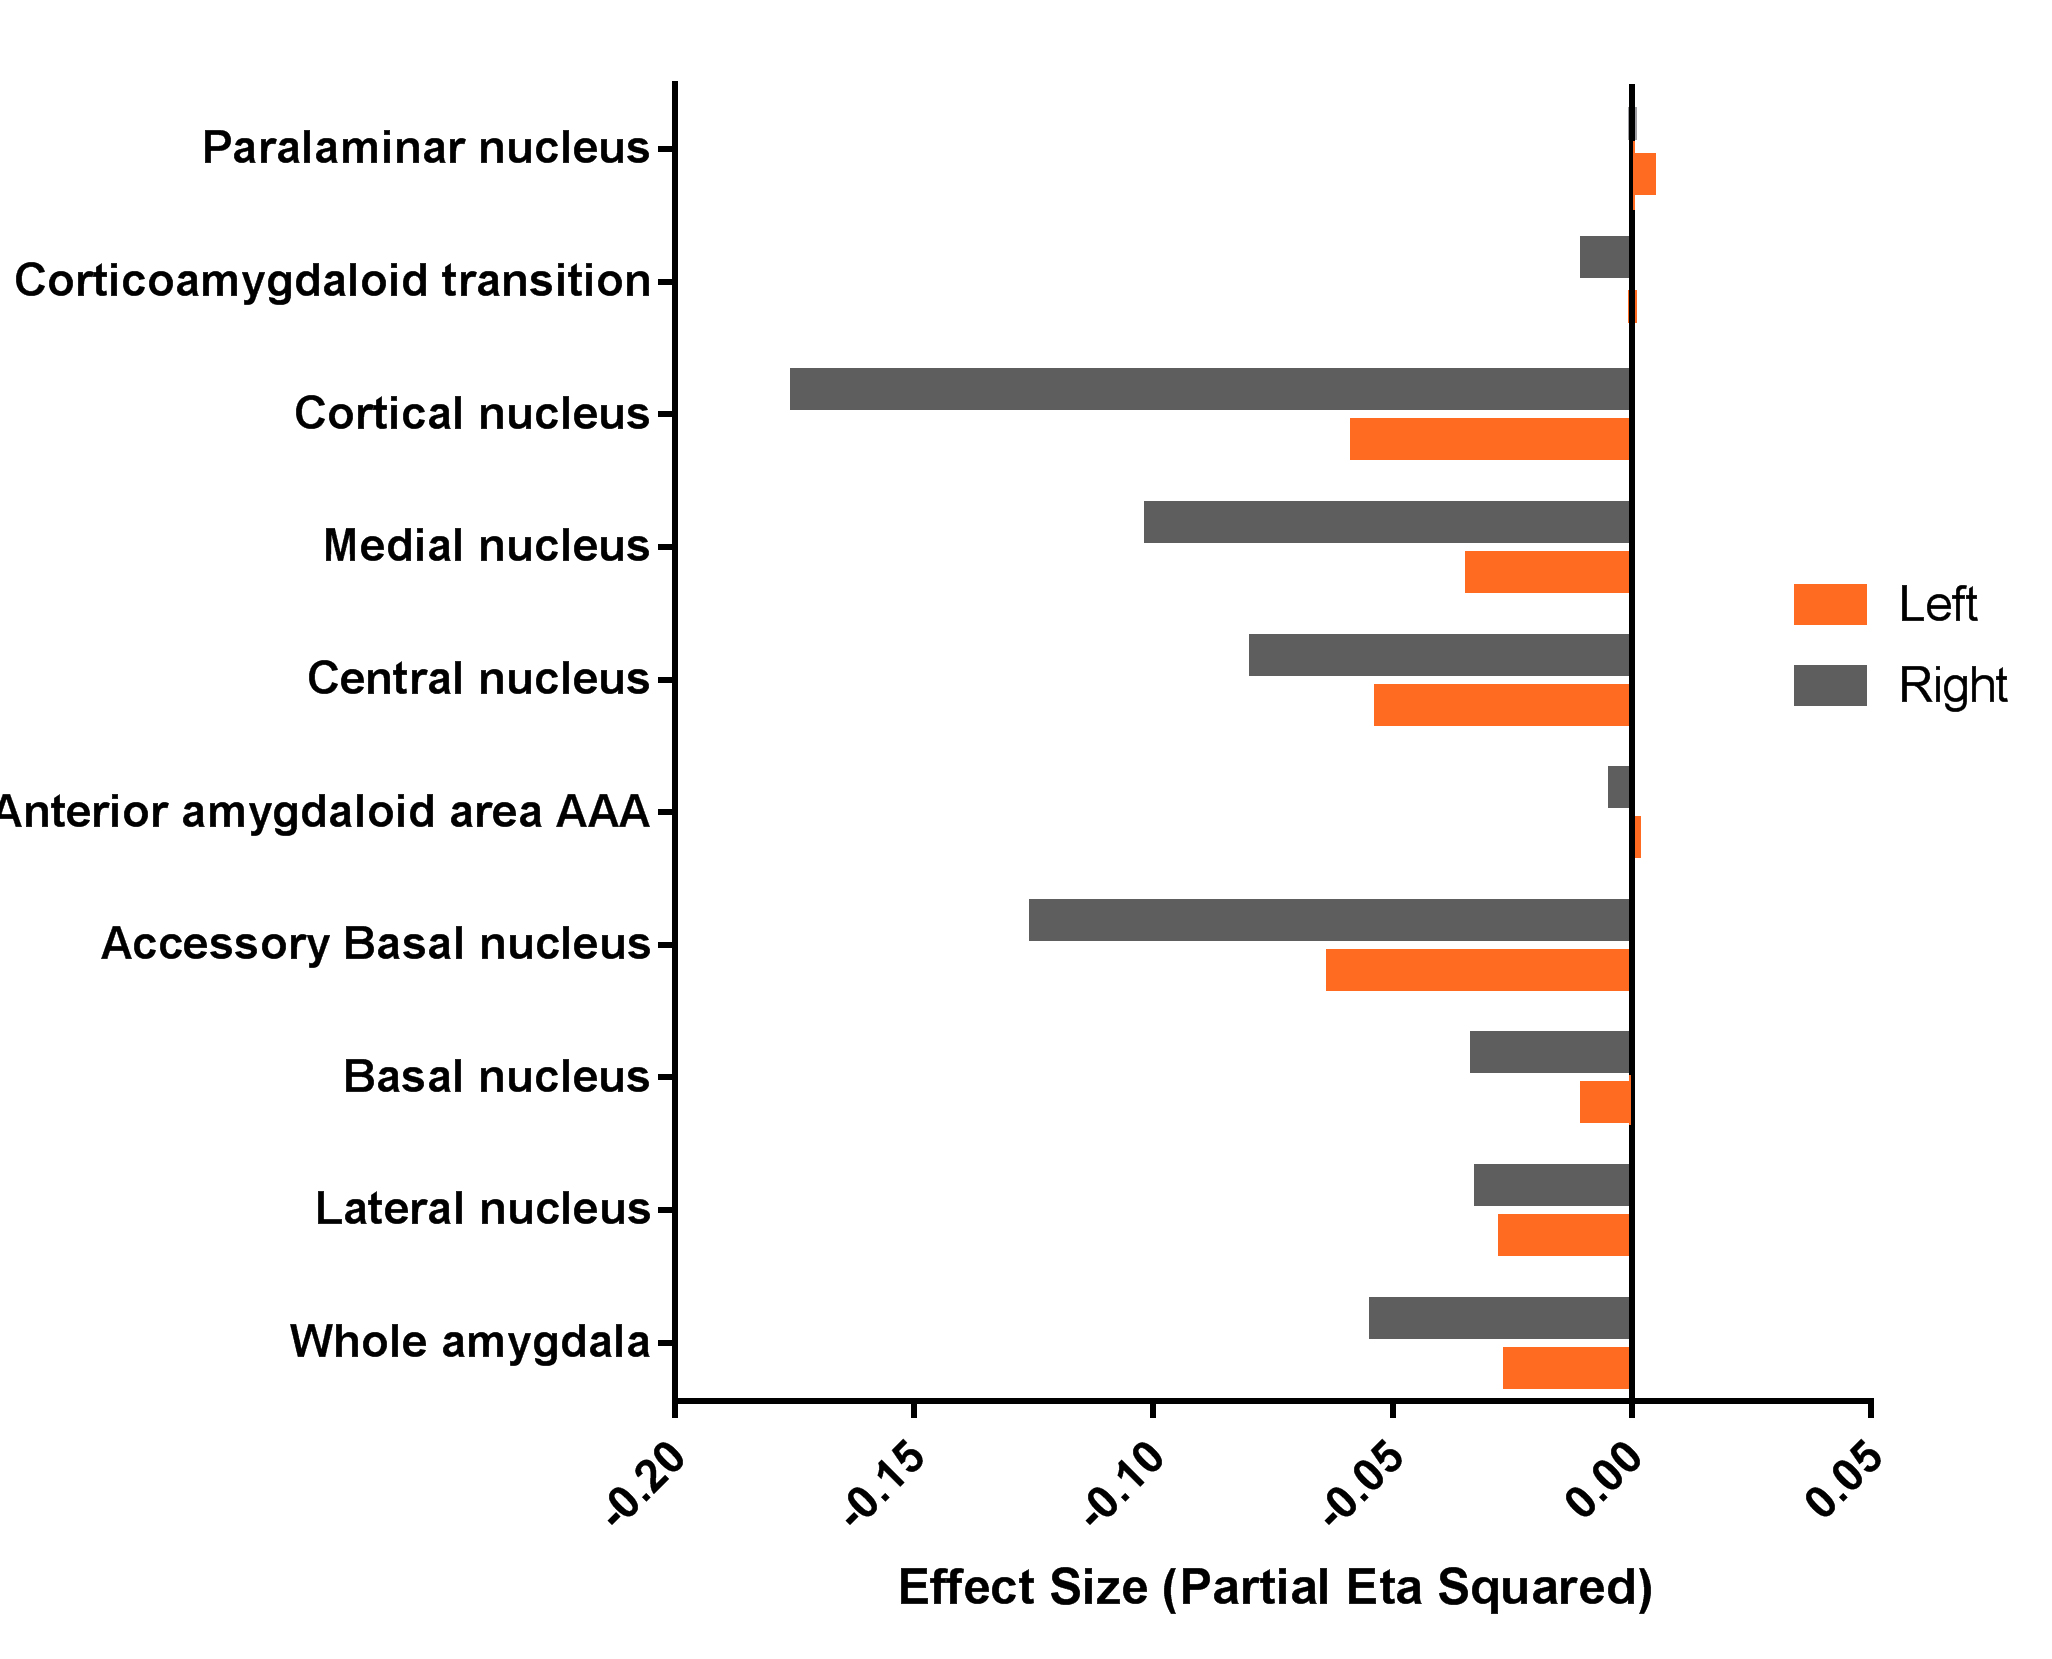
The structural data was automatically segmented using FreeSurfer software. Amygdala subfield segmentation was performed using a special purpose module in FreeSurfer software which employs a tetrahedral mesh-based probabilistic atlas built from manually delineated amygdala in in-vivo and ex-vivo data4. By this algorithm, the volume of the whole left and right amygdala and 9 subfields were obtained, including 7 nuclei (lateral nucleus (LA), basal nucleus (Ba), accessory basal nucleus (AB), central nucleus (CeA), medial nucleus (Me), cortical nucleus (Co) and paralaminal nucleus) and 2 transition areas (anterior amygdaloid area (AAA) and corticoamygdaloid transition) (Fig 1). All segmentations were visually confirmed. A multivariate analysis of covariance (MANCOVA) with age, sex and ICV as covariates was used to test for amygdala subfield volume differences between groups. Bonferroni correction used to correct for multiple comparisons, and Partial Eta Squared (η2) was calculated to evaluate effect sizes. Exploratory Bivariate correlation analyses were performed to identify associations of amygdala measures with illness duration, and YBOCS, scores, compulsion and obsession scores, and HAMA and HAMD scores with subfields using nominal significance thresholds.
Result
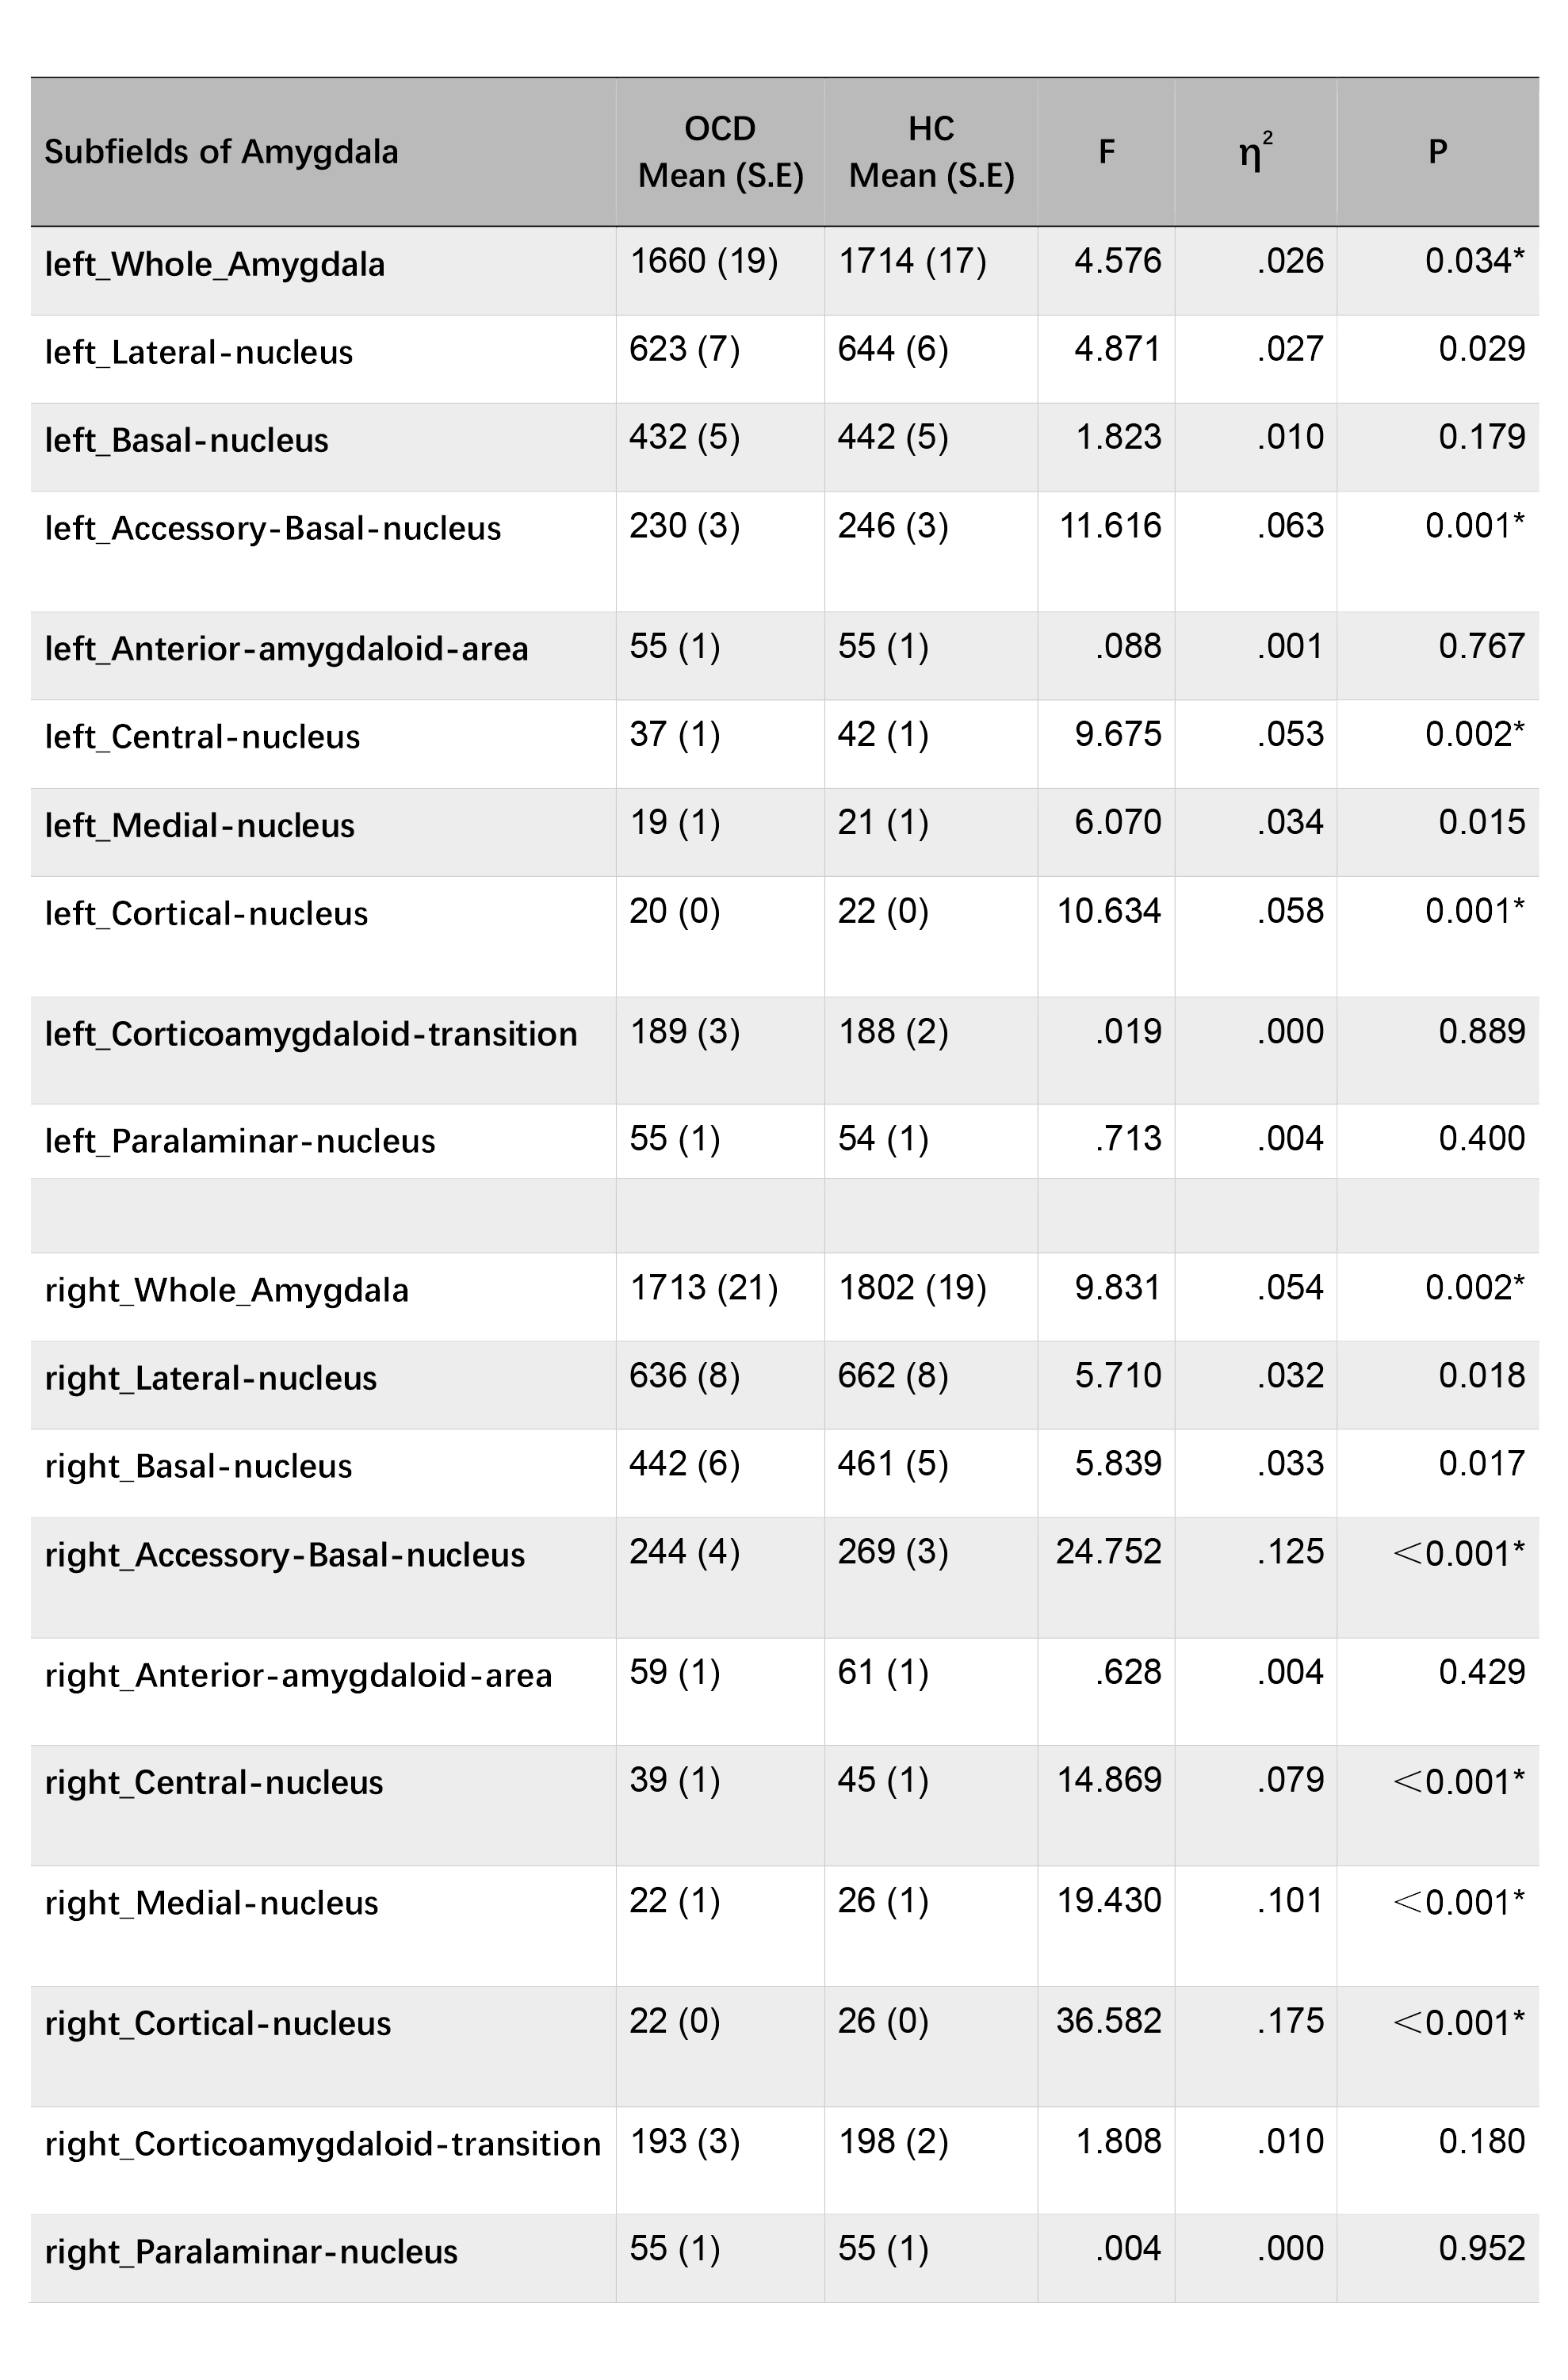
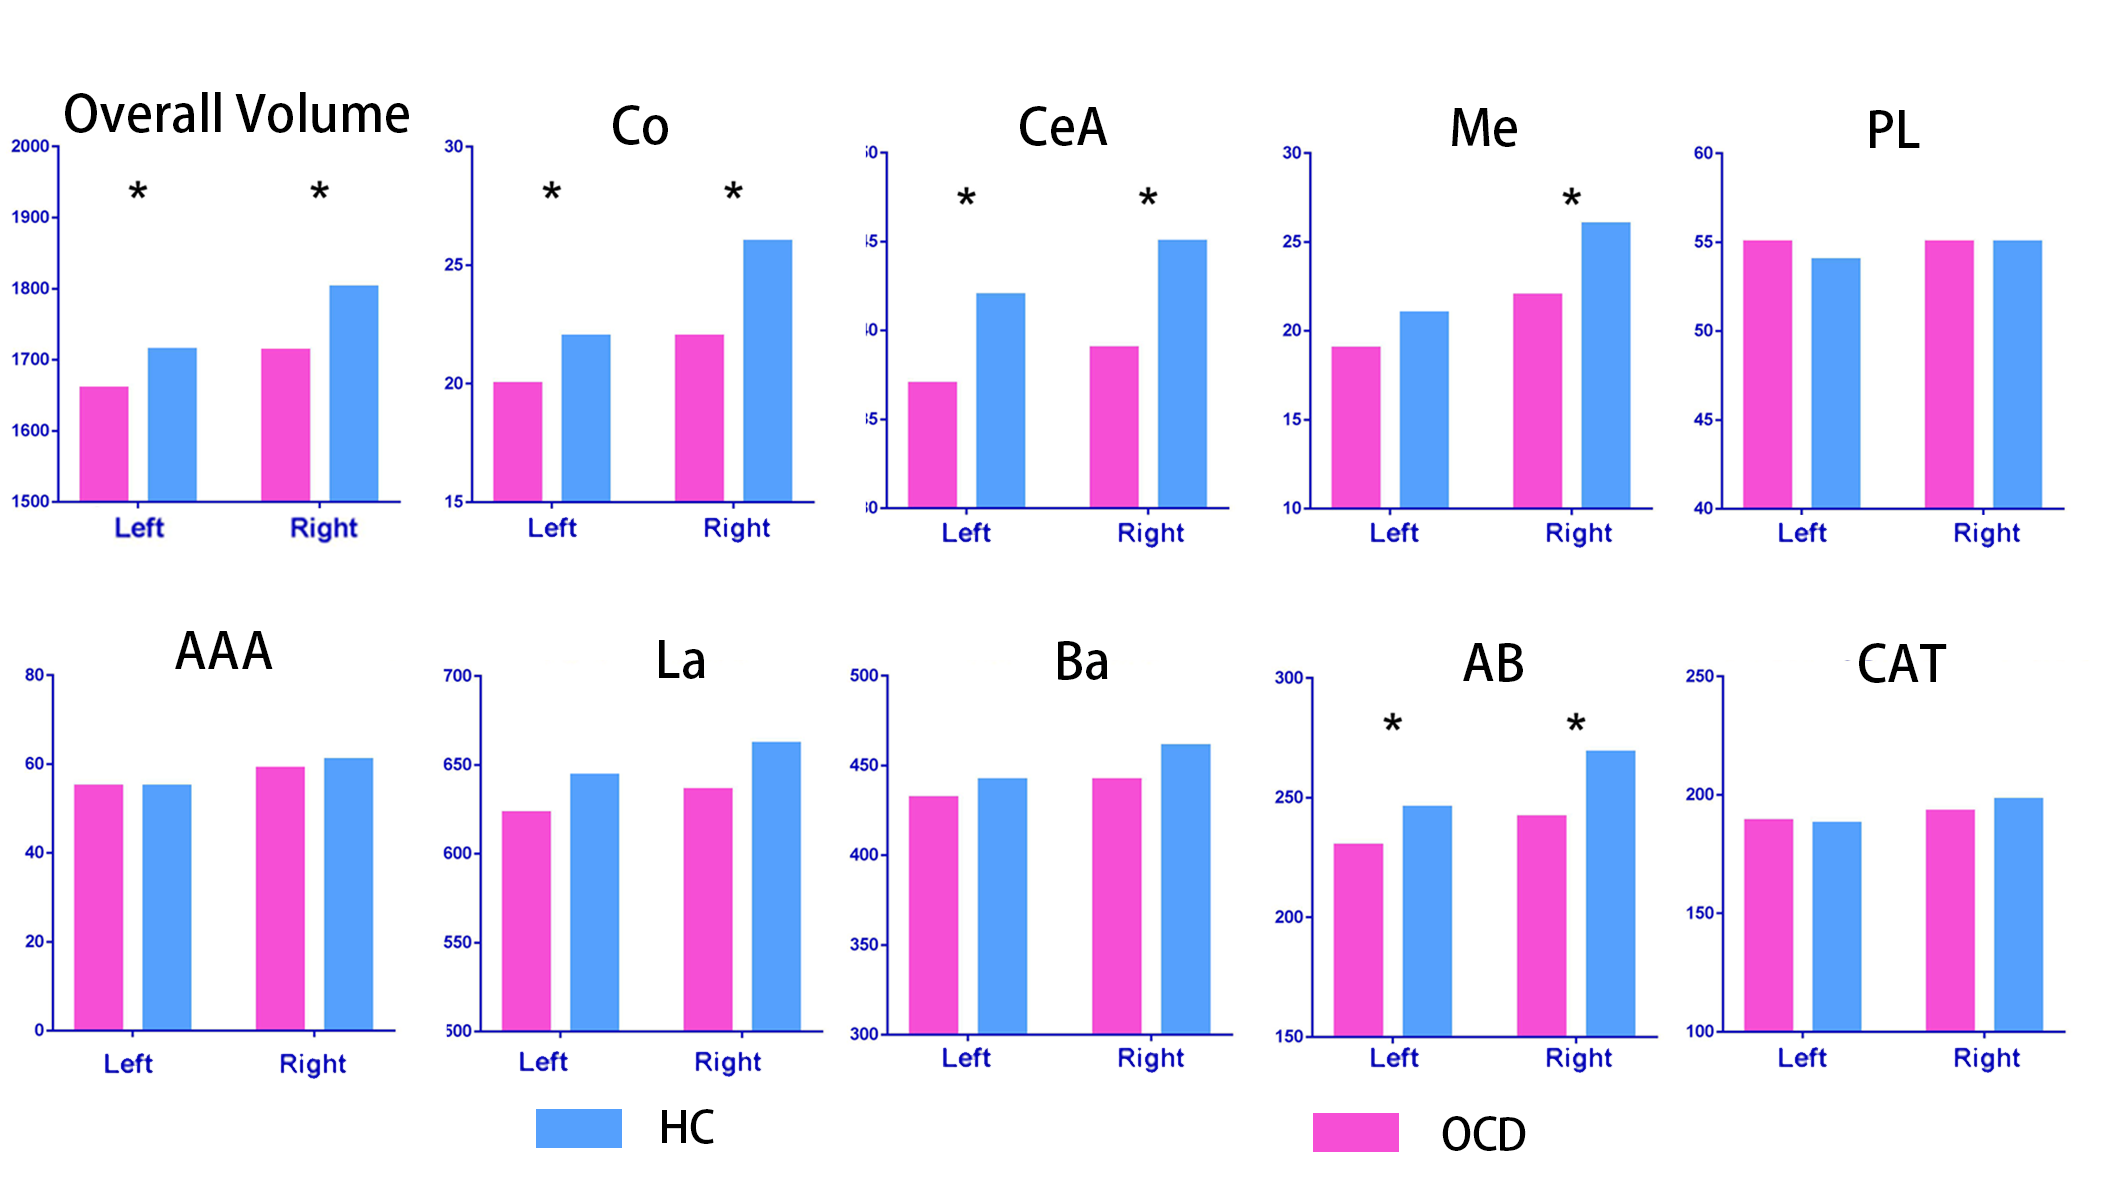
Volume of whole amygdala was significantly reduced bilaterally in patients with OCD, relative to HC (left, p=0.034; right, p=0.002) (see Table 2). Follow-up analyses of subfields revealed volume reductions in bilateral AB nuclei (left, p=0.001; right, p<0.001), CeA nuclei (left, p=0.002; right, p<0.001), Co nucleus (left, p=0.001; right, p<0.001) and right Me nucleus (p<0.001) in OCD patients relative to HC. Negative correlations were observed between illness duration and volume of right CeA nucleus (r=-0.265, p=0.018). HAMA score was found significantly correlated with nuclei volumes in right basolateral complex of amygdala (BLA, composed of Ba, La and AB) (right Ba, r=-0.232, p=0.039; right AB, r=-0.254, p=0.020).Disscussion & Conclusion
To the best of our knowledge, this is the first study that investigated amygdala subnuclei volume alterations in patients with OCD. Here, we showed that distinct subnuclei of amygdala contribute to different aspect of OCD. The CeA may associated with cognitive aspect of OCD, by its roles in selecting defensive or appetitive responses toward stimulus which facilitate adaptive behavior5. Impairments in the CeA nucleus may cause disrupt adaptive behavior contributing to behavioral inflexibility and also emotional distress. The BLA modulates anxiety level, and its impairment may associates with anxiety component in OCD as demonstrated by the association it has with HAMA3. The Me and Co nuclei are related with aggressive behavior and olfactory pathway, respectively6,7. Hence impairments in these nuclei may responsible for specific symptom dimension in OCD – aggression and contamination fear.Acknowledgements
No acknowledgement found.References
1. Prog Neuropsychopharmacol Biol Psychiatry. 2006 May;30(3):327-37.
2. Eur Neuropsychopharmacol. 2016 May;26(5):810-27.
3. Curr Biol. 2007 Oct 23;17(20):R868-74.
4. NeuroImage. 2017;155:370-382.
5. Curr Opin Neurobiol. 2018 Apr;49:141-147.
6. Curr Opin Neurobiol. 2018 Apr;49:184-191.
7. Trends Neurosci. (1998) 21, 323–331
Figures