0180
Metabolite relaxation and diffusion abnormalities in the white matter of first-episode schizophrenia: a longitudinal study1McLean Hospital, Belmont, MA, United States, 2Harvard Medical School, Boston, MA, United States
Synopsis
Microstructural abnormalities in the white matter are important in the pathophysiology of schizophrenia. Unlike to unspecific nature of water, MRS can probe the brain's intracellular microenvironment through the measurement of transverse relaxation and diffusion of neurometabolites and even providecell-specific information. In this study, we worked with first episode schizophreniapatients so as to obviate the effects of medications and toxic effects of chronic psychosis. A combination of the T2-MRS and DTS techniques were applied in a longitudinal study. NAA T2 and ADC showed more sensitive changes compared to water at the early stage of disease.
Introduction
Multiple lines of evidence suggest that microstructural abnormalities in the white matter are important in the pathophysiology of schizophrenia (SZ) (1-3). Diffusion tensor imaging (DTI) characterizes the nature of water molecular movement, but water exists in intra- and extra-cellular compartments and DTI abnormalities might reflect multiple processes and could be non-specific (3). Magnetic resonance spectroscopy (MRS) can provide an additional window to the brain's cellular microenvironment through the measurement of transverse relaxation (T2) and diffusion of neurometabolites. Unlike water, metablites’ relaxation/diffusion properties are therefore expected to depend mostly on intracellular parameters. Furthermore, some metabolites have a preferential cellular compartmentalization, which makes them cell-specific probes to explore intracellular changes (4). For schizophrenia (SZ) we still lack a clear understanding of disease progression mechanisms and have no specific targets for effective treatment and early intervention. Working with first episode (FEP) SZ patients, we can obviate the effects of medications and toxic effects of chronic psychosis. In this study, a combination of the T2-MRS and DTS techniques were applied in a longitudinal study of FEP SZ patients with two year follow-ups, exploring the effect of the disease evolution on the intracellular microstructures, especially during the early stages.Methods
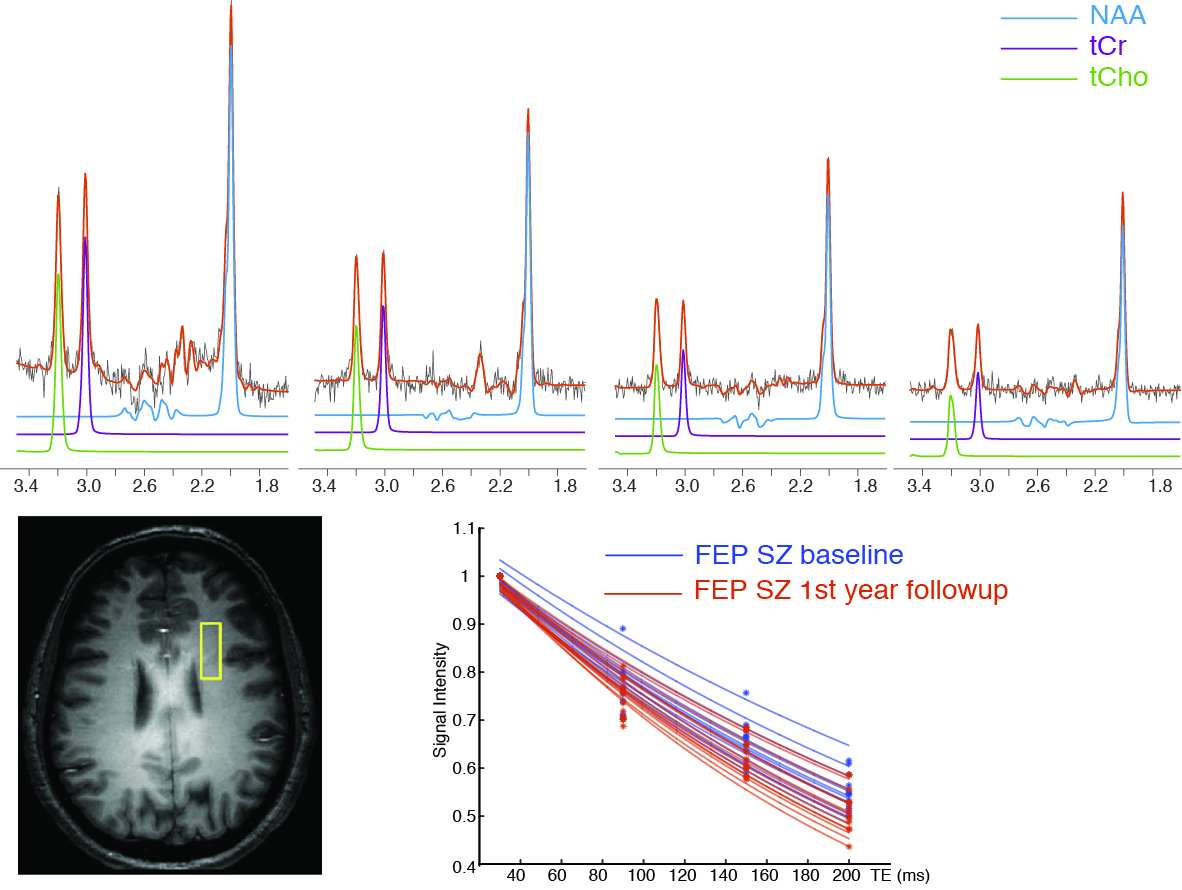
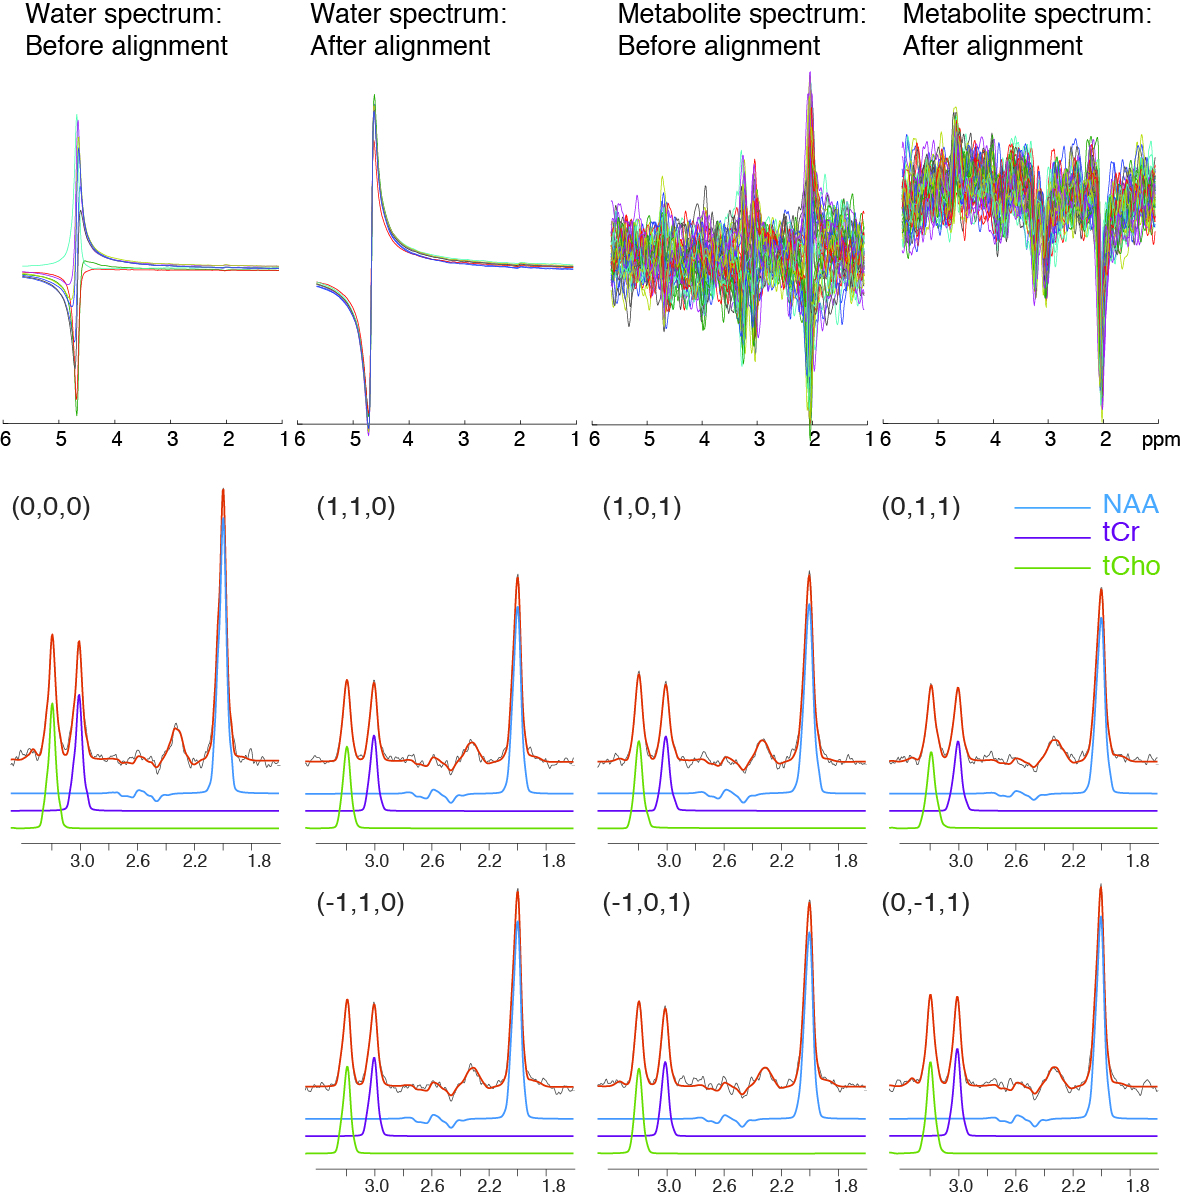
We recruited 14 participants with FEP SZ from the clinical services at our hospital with approval. MRI scans were performed on baseline, 1st and 2nd year follow-up. 9 healthy subjects from the community with matching demographic factors were also recruited as controls with baseline and 2nd year MRI scans. All MRS acquisitions were conducted on a 4 T Varian/UnityInova full body MR scanner, using a 16-rung, single-tuned, volumetric birdcage coil. A 1×3×3 cm3 single MRS voxel was then placed on in the corona radiata. The voxel was consistently positioned in pure WM (Fig. 1). T2 were obtained using a PRESS sequence modified with 4 varying TEs (30, 90, 120 and 200 ms) and TR = 3000 ms; 48 repetitions for metabolite and 8 repetitions for water T2 measurements. A modified PRESS sequence with diffusion gradients was used for DTS measurements. Bipolar diffusion gradients with six directions—(1,1,0) (1,0,1) (0,1,1) ( 1,1,0) ( 1,0,1) (0, 1,1)—and one control (0,0,0) were applied. The applied b value was 1000 sec/mm2. In these measurements, repetition time/echo time = 3000/135 ms, diffusion time = 60 ms, repetitions = 96 and 4 for metabolites and water diffusion measurements, respectively. The averages were saved individually and phase and frequency corrections (Fig. 2) were applied using FID-A (5). Eddy current corrections with water as reference and quantifications were performed with LCModel (6). Repeated measures ANOVA were performed for longitudinal data points using OriginPro.Results and discussions
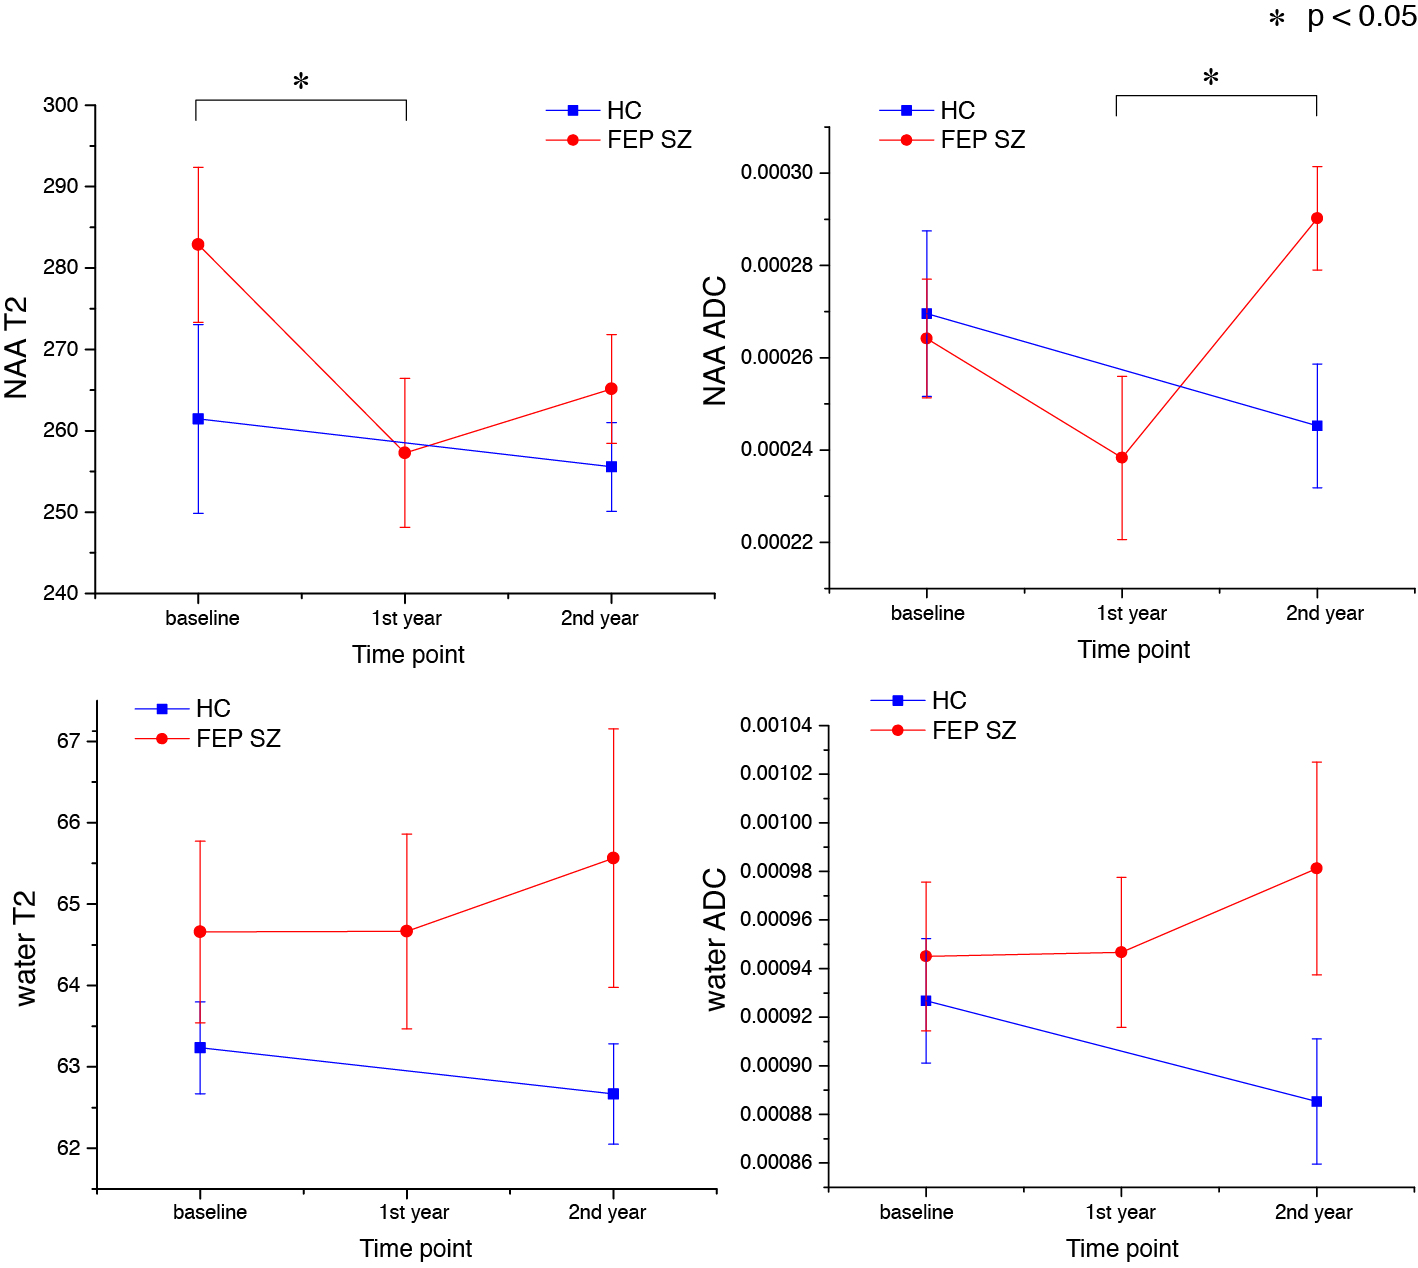
Representative spectra of T2-MRS and DTS as well as LCModel fittings were shown in Fig. 1 and 2 respectively. The T2 and ADC curves of NAA and water longitudinal changes of both patients and controls were presented in Fig 3. A repeated measures ANOVA with a Greenhouse-Geisser correction determined that NAA T2 differed statistically significantly between time points (p = 0.03). Post hoc tests using the Bonferroni correction revealed that a significant difference between baseline and 1styear follow-up (p = 0.02). The same analysis on NAA ADC demonstrated a boundary statistical significance between time points (p = 0.07) and the post hoc tests showed a boundary difference between 1st and 2nd year follow-up (p = 0.06). No significant T2 or ADC difference of tCr and tCho was observed between time points. Because NAA is located almost exclusively localized to neurons, the shortened NAA T2 suggests intra-axonal abnormalities in SZ, possibly due to increased interactions with intracellular macromolecules or to changes in cell size (7). The increased NAA ADC observed in SZ patients could be an increase in intra-axonal space available for diffusion (8). The control group didn’t show significant changes between the baseline and the follow-up in either NAA T2 (p = 0.7) or ADC (p = 0.2). Regarding the water measurements, SZ group showed slight increases in both T2 (p = 0.74) and ADC (p = 0.11) without significance. It can be seen that all these findings that emerge over time in FEP SZ (elevated NAA ADC, reduced NAA T2, elevated water ADC, and elevated water T2) are similar to what we have previously reported in chronic SZ patients (7,8). So here we may be finding evidence that these abnormalities are not pronounced at baseline and are the result of an active process early on in disease which eventually settles down to the patterns we see in chronic patients.Acknowledgements
This work was supported by: R21MH114020 (FD), R01MH094594 (DO) and R01MH104449 (DO).
References
1. Stephan KE, Friston KJ, Frith CD. Dysconnection in schizophrenia: from abnormal synaptic plasticity to failures of self-monitoring. Schizophr Bull 2009;35(3):509-527.
2. Paus T, Keshavan M, Giedd JN. Why do many psychiatric disorders emerge during adolescence? Nat Rev Neurosci 2008;9(12):947-957.
3. Kubicki M, McCarley R, Westin CF, Park HJ, Maier S, Kikinis R, Jolesz FA, Shenton ME. A review of diffusion tensor imaging studies in schizophrenia. J Psychiatr Res 2007;41(1-2):15-30.
4. Palombo M, Ligneul C, Valette J. Modeling diffusion of intracellular metabolites in the mouse brain up to very high diffusion-weighting: Diffusion in long fibers (almost) accounts for non-monoexponential attenuation. Magnetic Resonance in Medicine 2017;77(1):343-350.
5. Simpson R, Devenyi GA, Jezzard P, Hennessy TJ, Near J. Advanced processing and simulation of MRS data using the FID appliance (FID-A)-An open source, MATLAB-based toolkit. Magnetic resonance in medicine : official journal of the Society of Magnetic Resonance in Medicine / Society of Magnetic Resonance in Medicine 2017;77(1):23-33.
6. Provencher SW. Estimation of metabolite concentrations from localized in vivo proton NMR spectra. Magnetic resonance in medicine : official journal of the Society of Magnetic Resonance in Medicine / Society of Magnetic Resonance in Medicine 1993;30(6):672-679.
7. Du F, Cooper A, Cohen BM, Renshaw PF, Ongur D. Water and metabolite transverse T2 relaxation time abnormalities in the white matter in schizophrenia. Schizophr Res 2012;137(1-3):241-245.
8. Du F, Cooper AJ, Thida T, Shinn AK, Cohen BM, Ongur D. Myelin and axon abnormalities in schizophrenia measured with magnetic resonance imaging techniques. Biological psychiatry 2013;74(6):451-457.
Figures