0179
Importance of early spectral variations during 48 months of longitudinal follow-up MRI and MRS in 100 patients treated glioblastoma1Radiology, CHU et Université Picardie Jules Vernes, Amiens, France, Amiens, France, Metropolitan, 2CHU et Université Picardie Jules Vernes, Amiens, France, Amiens, France, Metropolitan, 3Tsinghua University, Beijing, China, Beijing, China, 4Université de Rouen, France, Rouen, France
Synopsis
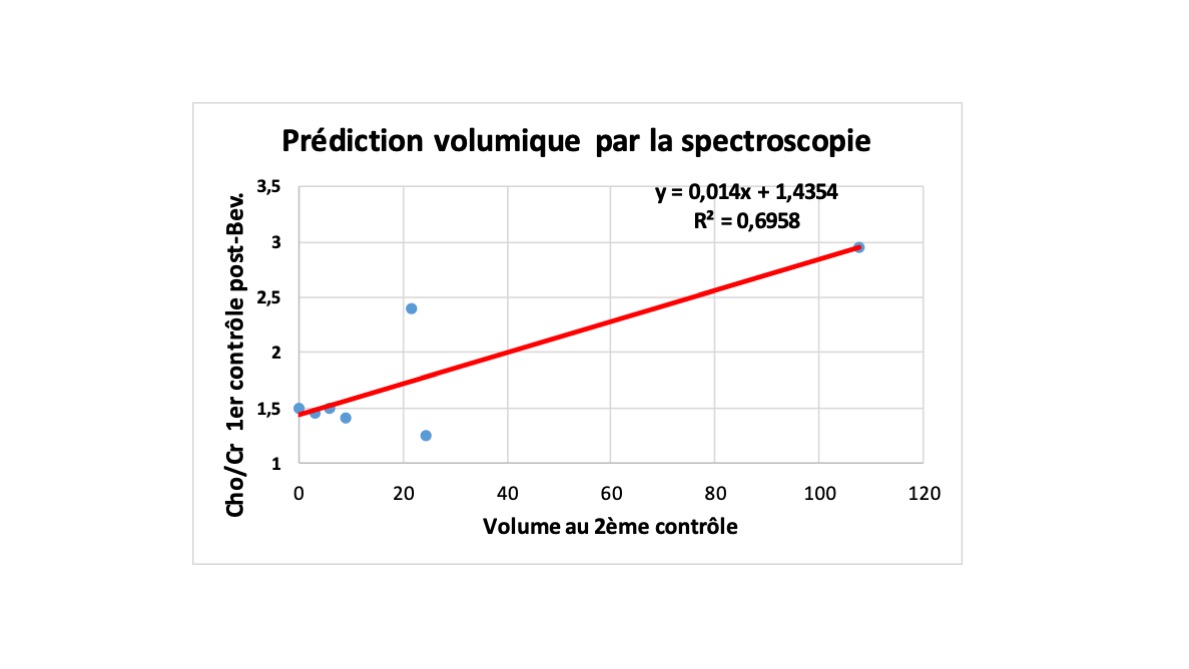
MRS with Cho/Cr, Lac/Cr, CH2/Cr and NAA/Cr ratios, could be more sensitive than MRI and could, in some cases, be predictive of worsening in glioblastomas follow-up. These spectroscopic changes occurred well before clinical deterioration. There is a large variability, but repetition and modelisation of spectroscopic measurements during longitudinal follow-up could allow us to diminish it and to improve glioblastomas prognostic evaluation especially at and after relapses. Studying the relationship between MRS measures, segmentation and perfusion parameters could lead to better understanding of therapeutic response and patients selection, especially with regard to chemotherapy and antiangiogenic molecules and in future stress modulators.
Introduction
to better understand glioblastomas tumor metabolism and post chemotherapy, radiotherapy and antiangiogenic variations and to determine cerebral variation in MRS measures of metabolites and spectral profiles during a 48 months longitudinal follow-up in 100 patients with glioblastomas tumors with different resection percentage, hyperperfusion and contrast enhancement initially and treated with STUPP protocol and antiangiogenicSubjects and Methods
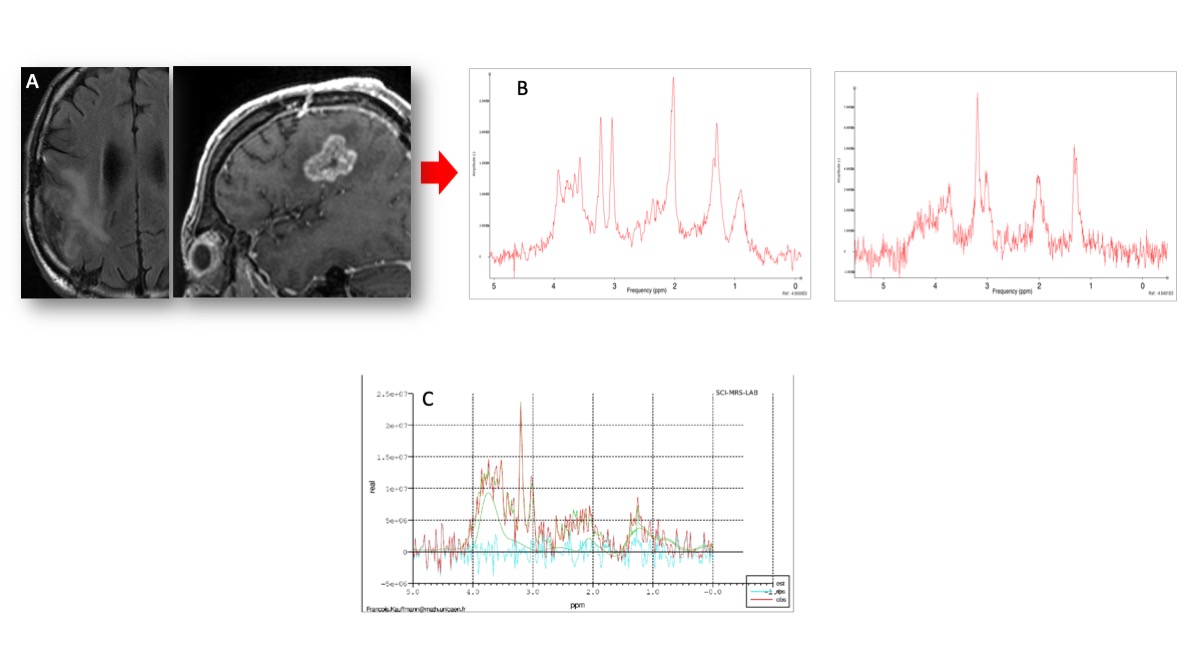
Over 100 patients all biopsied and all treated by surgery and STUPP protocol, 54 underwent antiangiogenic therapy and more than 420 exams were done MRI: Sagittal T1, axial FLAIR, diffusion, coronal T2, 3D T1 and late axial T1 after gadolinium. MRS: 1H, single voxel (6 to 12 cm3), PRESS with multiple TEs on a 3 T or 1,5 T (GEMS). Data processing: SA/GE, JMRUI yielding amplitudes, areas, ratios (Cho/Cr, CH2/Cr, NAA/Cr and Lac/Cr), and relative concentrations. Statistical analysis: of longitudinal MRI, perfusion and spectroscopic data (every 2 months over 48 months).Results
Quantitative
studies in MRI with multi-spectral segmentation and tissular classification are
ongoing. Spectroscopic profiles improve under STUPP protocol, then
worsen with increases in Choline/N-Acetyl-Aspartate (Cho/NAA), Cho/Cr and CH2
lipids/Cr and lactate/Cr ratios, and decreases in NAA/Cr. After STUPP,
chemotherapy and antiangiogenic therapies tumoral volumes (necrosis and
contrast enhancement), in MRI, change between two exams while spectroscopic
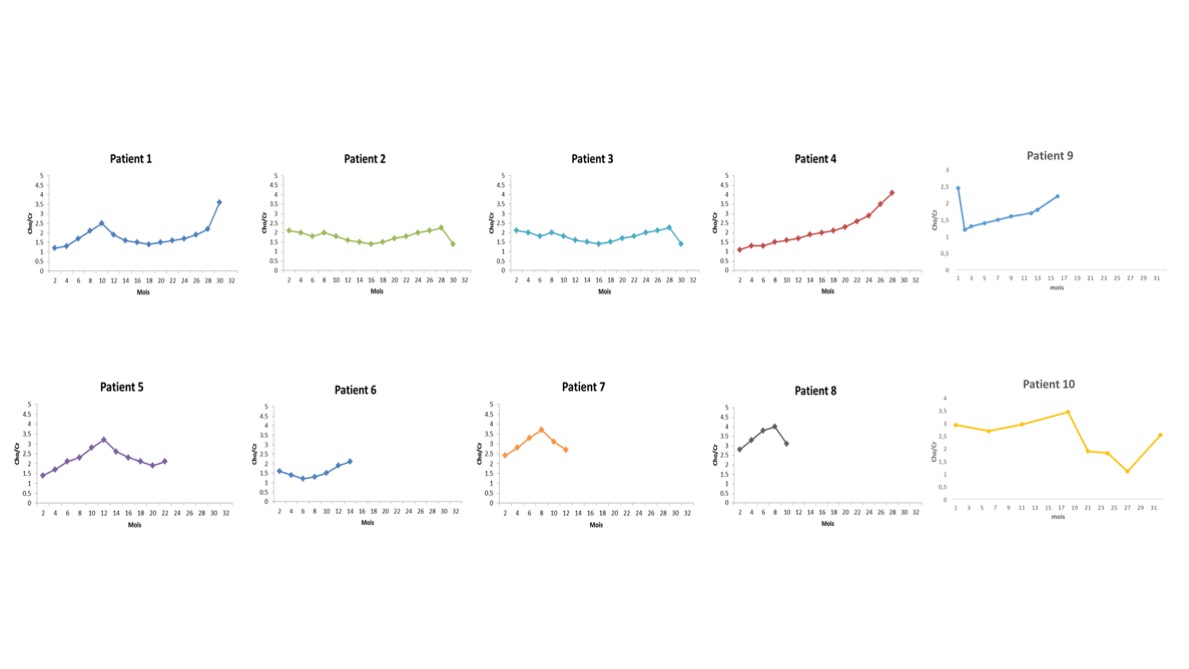
profiles and ratios do change more. MRS could, in fact with proliferation who
persists then increases or reappear
(Cho/Cr increase), be earlier and more sensitive than MRI and could be
predictive of survival, clinical worsening even the hyperperfusion or the
enhancement disappear, and treatment responses. The water and creatine are
quite stable, especially in the contralateral side, which could justify using
them for some other ratios to quickly detect spectroscopic variations. Effect of TE on measurements: Concentration of NAA always
has higher estimation on the short TE while lactate often has higher estimation
on the 288 ms TE. Spectroscopic and metabolic changes often come well before
clinical deterioration and sometimes before improvement. Therefore, MRS could
be more sensitive and could detect changes earlier than MRI and sometimes is
predictive.Discussion/Conclusion
Temozolomide and Avastin were well tolerated. MRI changed (especially CE and Necrosis) in T1 for most of the patients but MRS changed more with variable ratio of mI/Cr, increase Cho/Cr, Glx/Cr, lactate/Cr, CH2 lipids/Cr and decrease NAA/Cr at baseline. We observed a decrease in Cho/Cr ratio and hyperperfusion and contrast enhancement decrease for patients whose clinical condition improved and inverse results for those whose conditions deteriorated. MRS allows non-invasive follow-up of treated glioblastomas tumors. There is a large variability, but repetition and modelisation of spectroscopic measurements during longitudinal follow-up could allow us to diminish it and to improve prognostic evaluation. Studying the relationship between MRS measures, segmentation and perfusion parameters could lead to better understanding of tumoral processes and of therapeutic response, especially with regard to chemotherapy, radiotherapy and antiangiogenic molecules and in the future oxidative stress, hypoxia modulators and hyperthermia therapies.Acknowledgements
No acknowledgement found.References
Hattingen et al. Evaluation of optimal echo time for 1H-spectroscopic imaging of brain tumors at 3 Tesla. View issue TOC, Volume 26, Issue 2, August 2007, Pages 427–431
Dou W. et al. A framework of fuzzy information fusion for the segmentation of brain tumor tissues on MR images. Image and Vision Computing, Volume 25, Issue 2, February 2007, Pages 164–171
Artzi M. et al. Differentiation between vasogenic-edema versus tumor-infiltrative area in patients with glioblastoma during bevacizumab therapy: A longitudinal MRI study. European Journal of Radiology, Volume 83, Issue 7, July 2014, Pages 1250–1256
Figures