0176
Elevated brain glutamate levels in type 1 diabetes1Radiology and Nuclear Medicine, Radboud university medical center, Nijmegen, Netherlands, 2Internal Medicine, Radboud university medical center, Nijmegen, Netherlands, 3Pediatrics, Radboud university medical center, Nijmegen, Netherlands
Synopsis
Type 1 diabetes affects the structure and functioning of the brain, but the neurochemical mediators that may accompany these negative effects are largely unknown. We investigated brain metabolite levels with 1H MRS in patients with type 1 diabetes and normal awareness of hypoglycemia, patients with impaired awareness of hypoglycemia (IAH) and non-diabetic controls. Brain glutamate levels were elevated in type 1 diabetes and correlated with glycemic control and age of disease onset, but not with burden of hypoglycemia as reflected by IAH. This suggests a potential role for glutamate as early marker of hyperglycemia-induced cerebral decline in type 1 diabetes.
Introduction
Type 1 diabetes has a negative effect on the structure and functioning of the brain.1 Several studies report on a lower cognitive performance, a reduced gray matter volume and altered cerebral metabolism and metabolic pathways in type 1 diabetes.2,3 Known risk factors for these effects on the brain include a diabetes onset in early childhood and poor glycemic control.4 Recently, also the presence of impaired awareness of hypoglycemia (IAH), which results from exposure to recurrent hypoglycemia, has been associated with reduced cognitive function and structural cerebral decline.5 The neurochemical mediators that may precede, underlie or accompany these negative effects on the brain are currently largely unknown. Here we assessed the impact of type 1 diabetes on neuro-metabolite levels.Methods
Experimental protocol
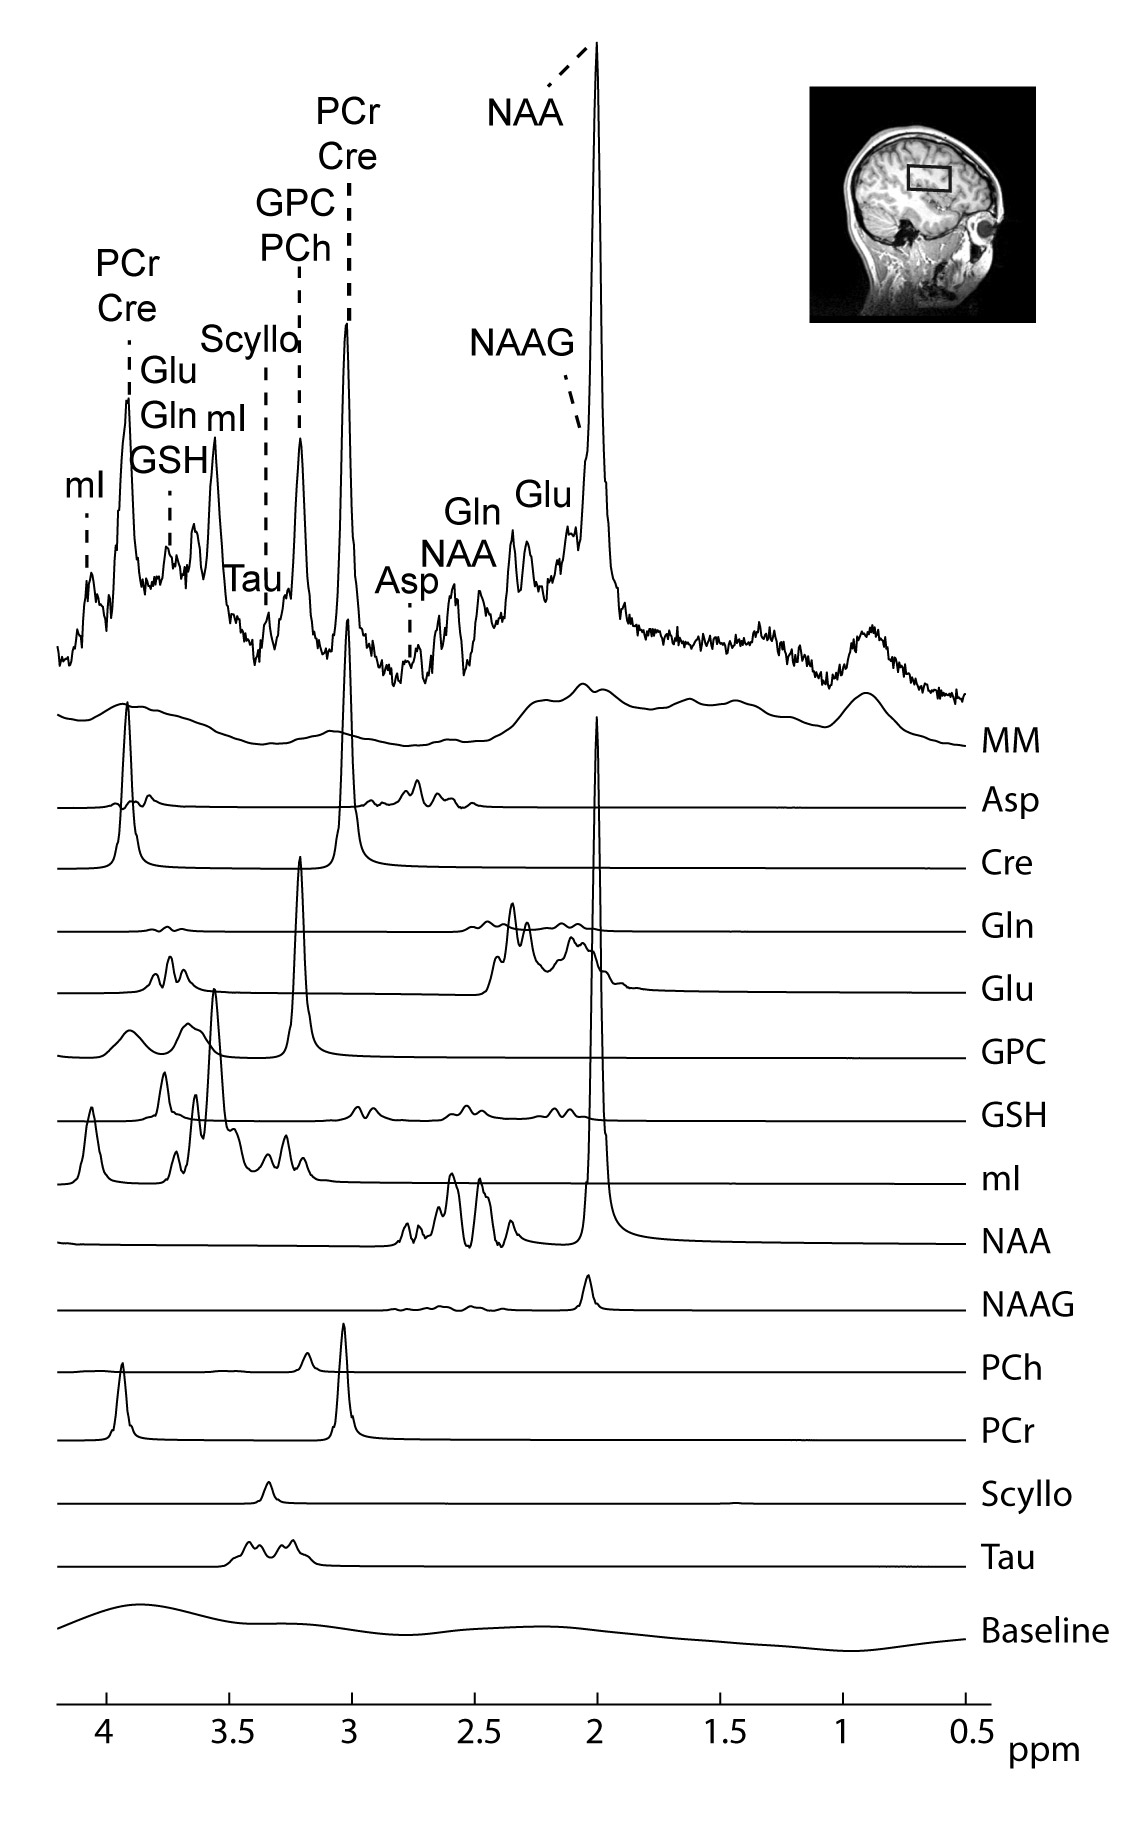
We included 13 healthy controls, 18 subjects with type 1 diabetes and normal awareness of hypoglycemia (NAH) and 13 subjects with type 1 diabetes and IAH. Brain metabolite levels were determined by 1H MRS, measured under hyperinsulinemic-euglycemic conditions. MR measurements were performed on a 3T MR system (Tim MAGNETOM Trio (n = 32) or MAGNETOM Prisma-fit (n = 12), Siemens, Erlangen, Germany) using a body coil for excitation and a 12-channel receive-only head coil. A T1-weighted anatomical image (MPRAGE; 256 x 256 mm2 field of view; 1 mm3 isotropic voxels) was used for MRS voxel positioning and for determination of the amount of grey matter, white matter and cerebrospinal fluid in the MRS voxel. 1H MRS data were acquired from a single voxel (22.5-25.0 cm3) with a sLASER6 spectroscopy sequence (TE 30-33 ms; TR 3000 ms; 32 averages). A water-unsuppressed spectrum was used for absolute metabolite quantification and eddy-current correction. Spectra were analysed with LCModel software (figure 1).7 Concentrations were corrected for partial volume effects and for T1 and T2 relaxation effects. If the covariance between metabolites was consistently high (i.e., correlation coefficient below -0.3), they were reported as sum.
Statistics
Differences in metabolite levels between subjects with IAH, subjects with NAH and healthy controls were determined using analysis of variance (ANOVA) with Bonferroni post-hoc tests. Linear regression analysis was performed between glutamate levels and HbA1c levels and between glutamate levels and the age of onset of diabetes.
Results
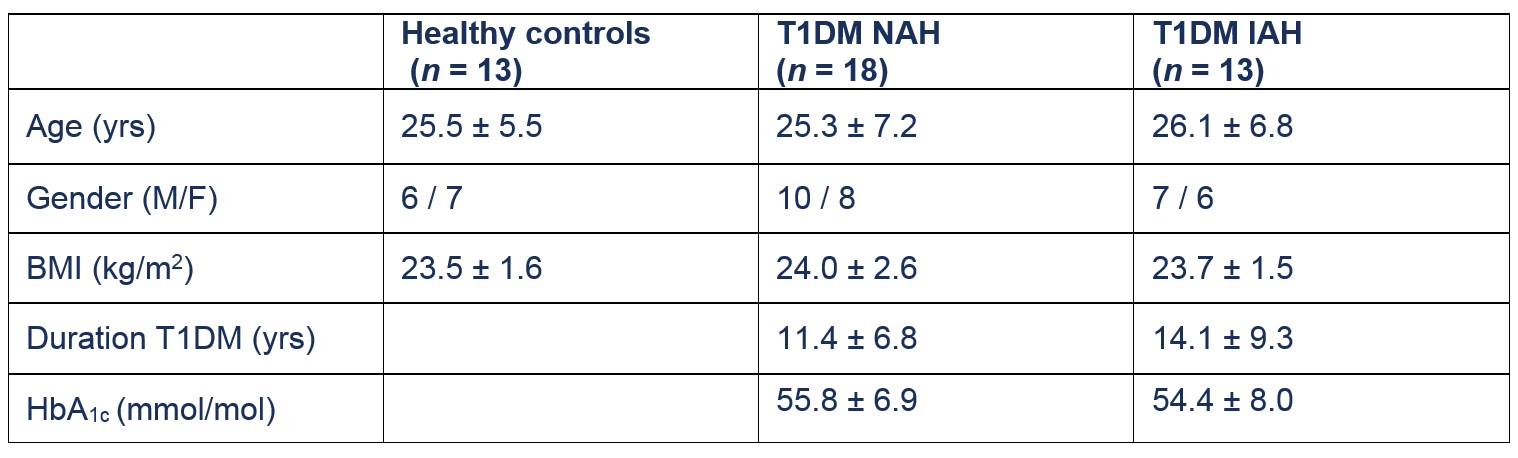
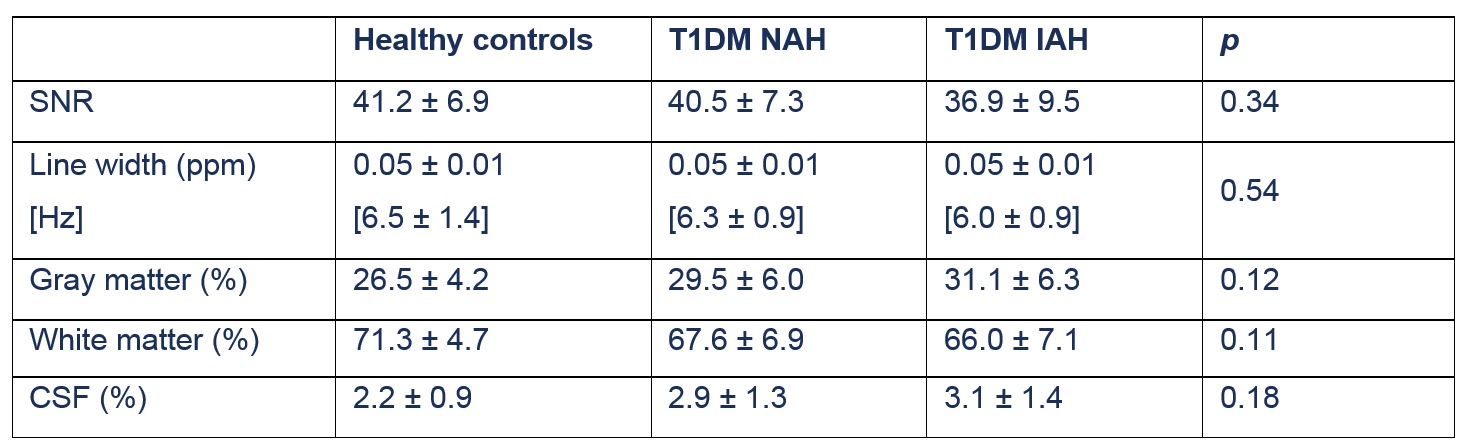
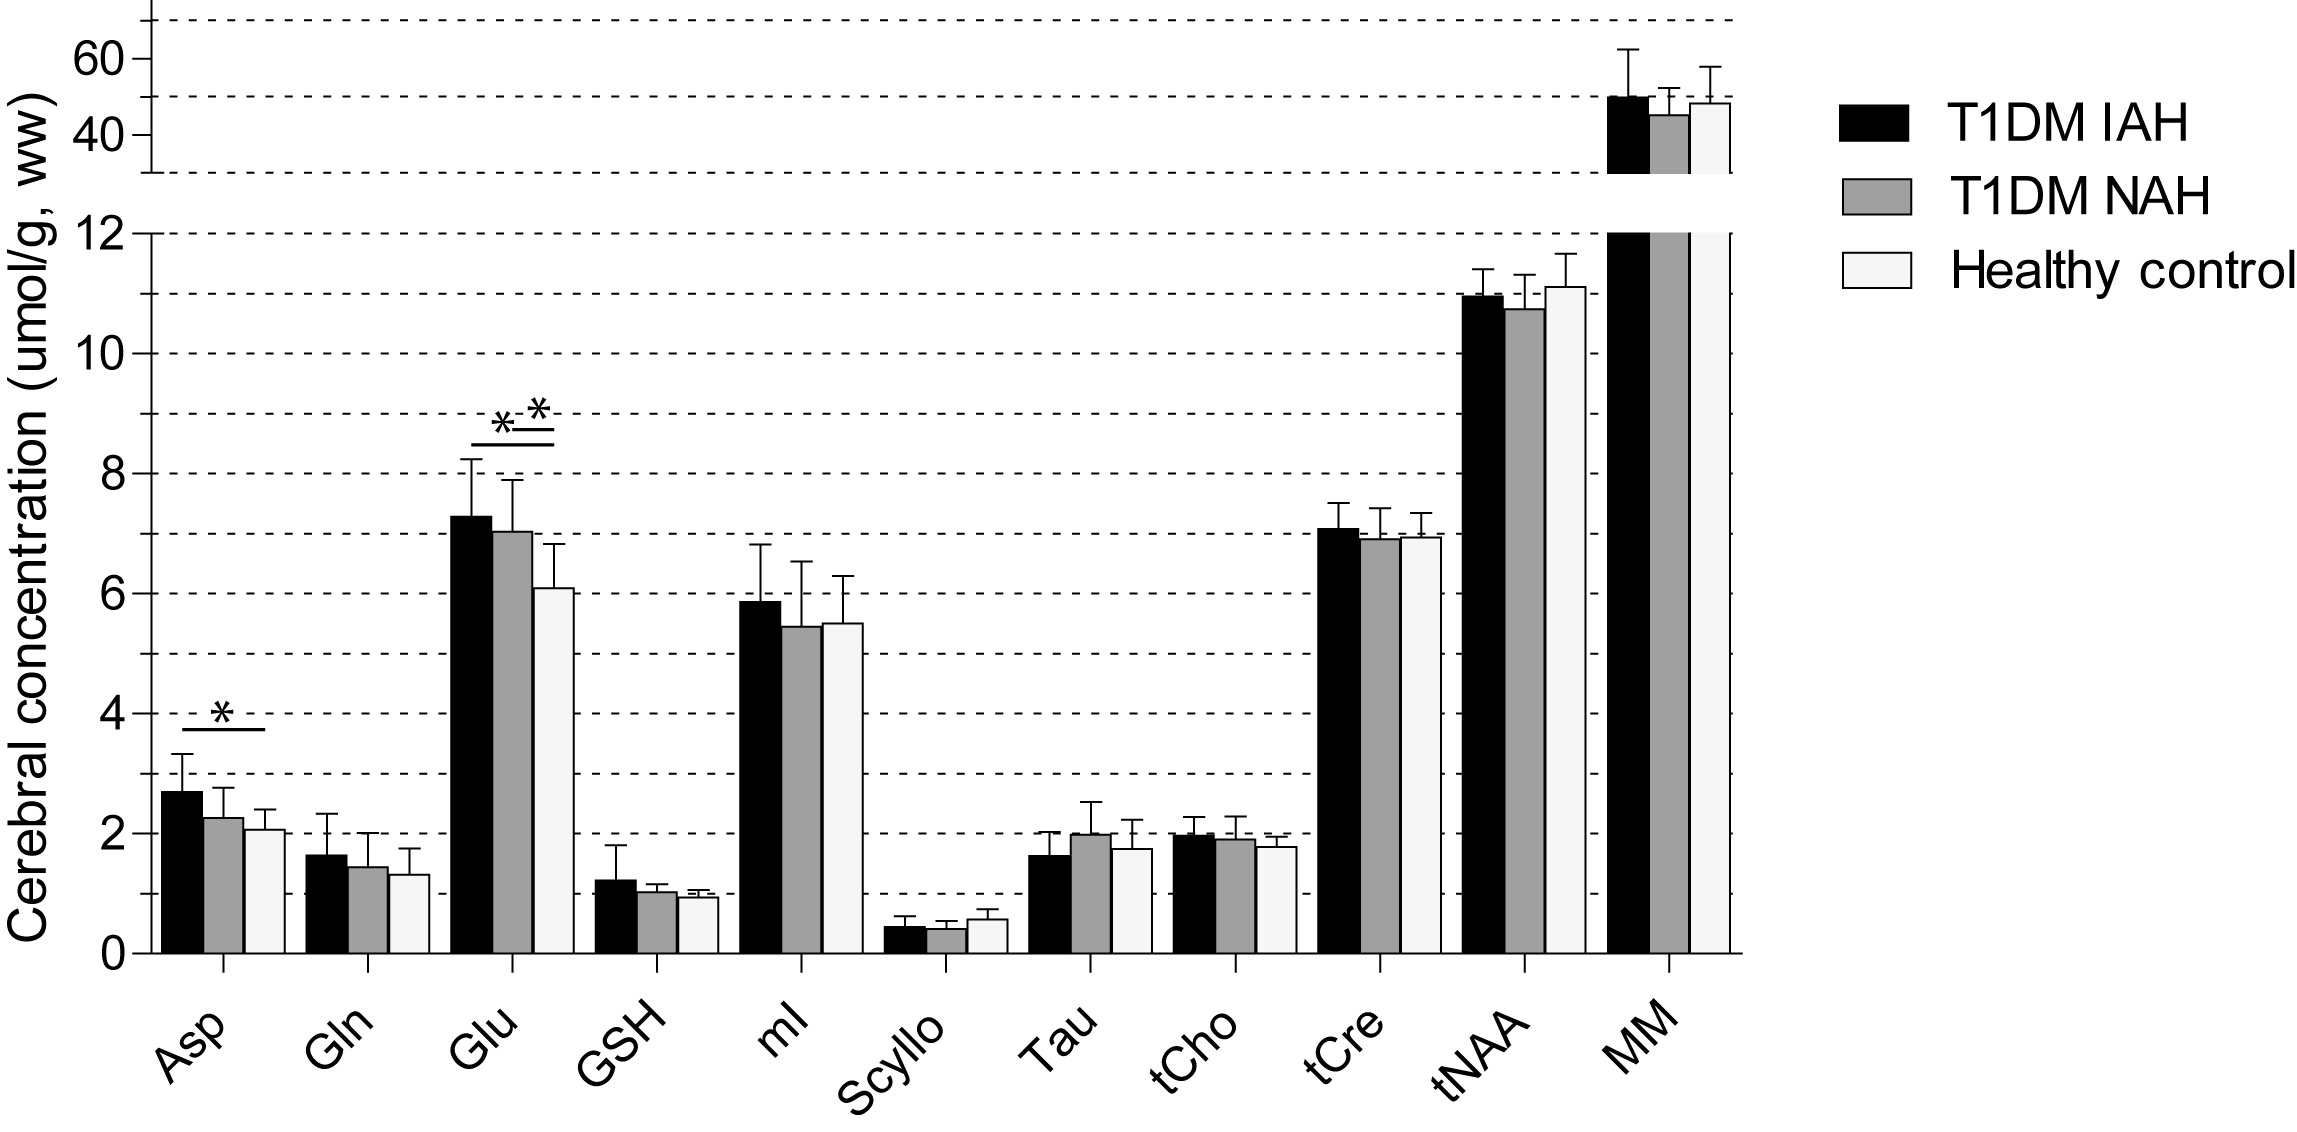
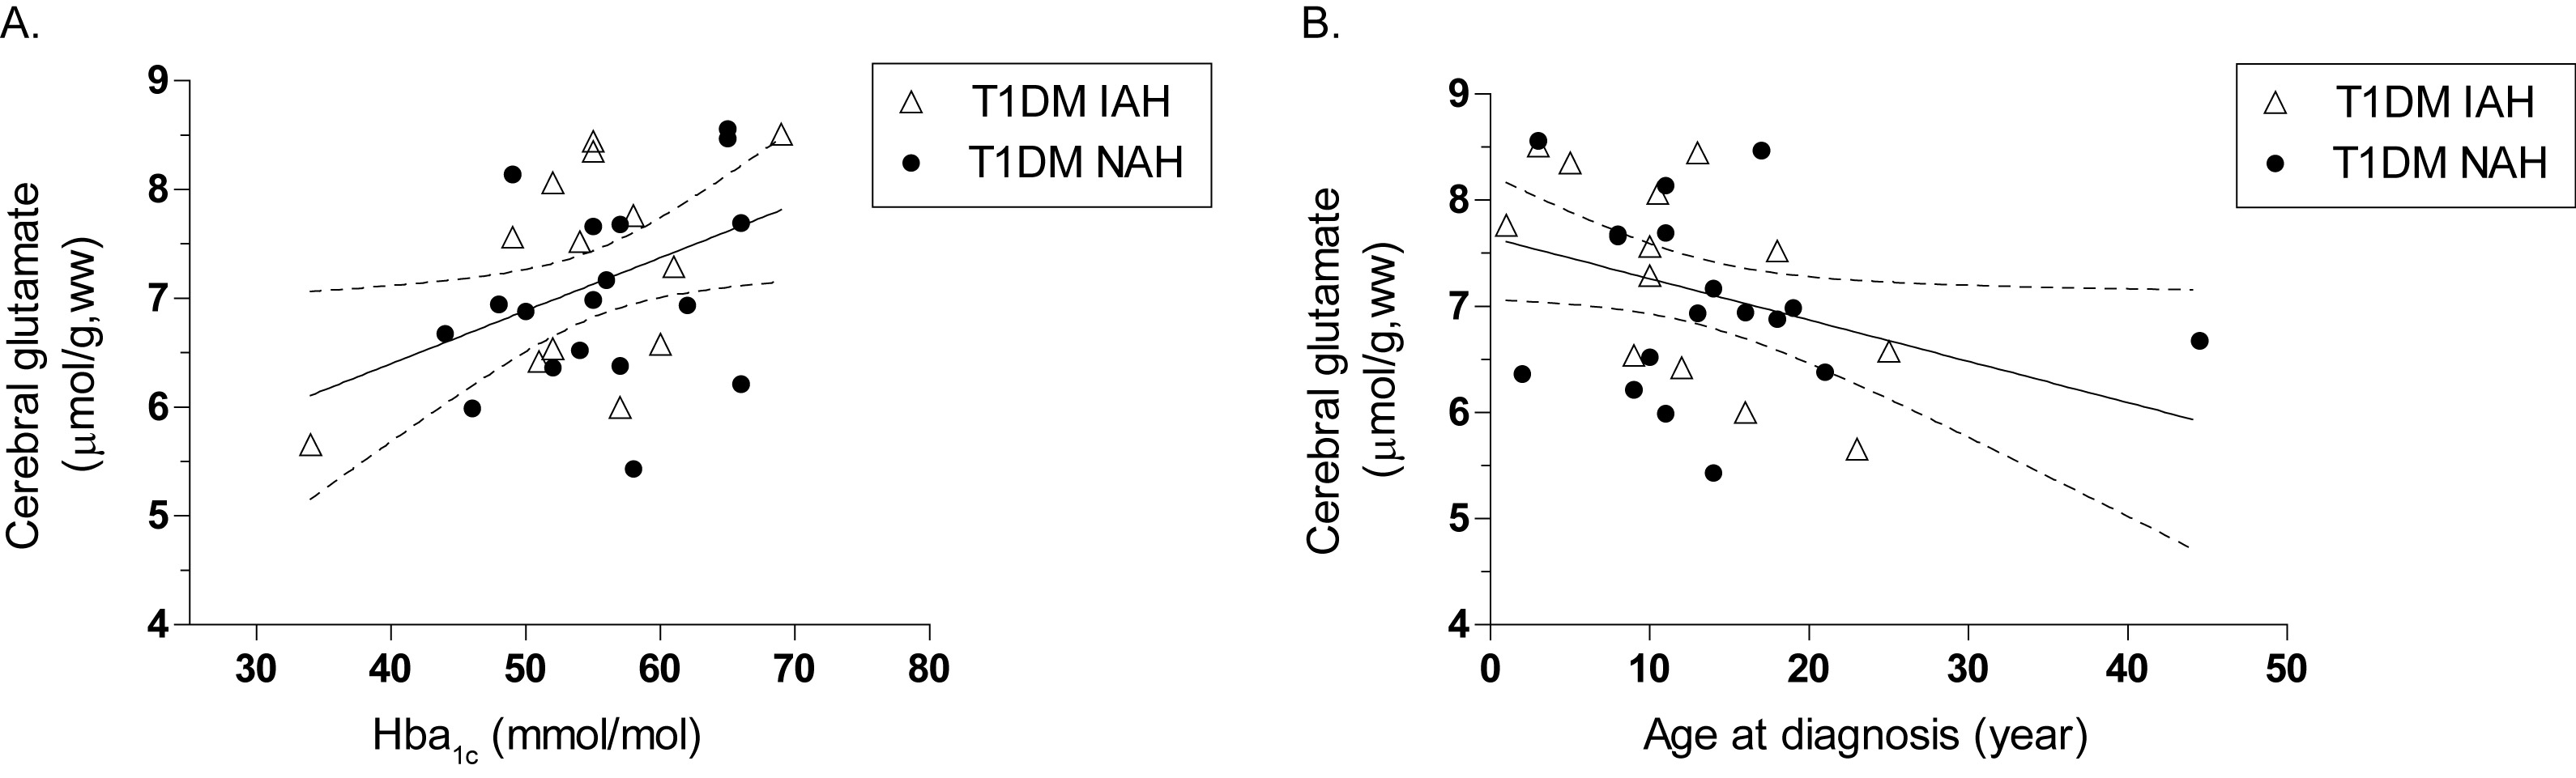
The subjects were matched for age, gender, BMI, duration of diabetes and HbA1c levels (table 1). Plasma glucose levels were well in the euglycemic range (5.3 ± 0.6 mmol/L) during data acquisition. The spectral quality and voxel composition were comparable between groups (table 2). Upon comparing the neurochemical profile of the three groups of subjects (figure 2), we found glutamate levels to be higher in subjects with type 1 diabetes, both in those with NAH (+15%, p = 0.013) and in those with IAH (+19%, p = 0.003), when compared to non-diabetic controls. Cerebral glutamate levels were linearly correlated to HbA1c-levels in patients with type 1 diabetes (r = 0.40; p = 0.03) and inversely correlated to the age of onset of type 1 diabetes (r = -0.36; p = 0.04) (figure 3). All other metabolite levels were similar across groups, apart from an increase in aspartate levels in type 1 diabetes and IAH.Discussion and conclusion
Our main finding is that the brain glutamate levels are elevated in type 1 diabetes. Glutamate is one of the most important excitatory neurotransmitters and changes in glutamate levels may be linked to metabolic activity.8 Alternatively, glutamate itself may act as a metabolic substrate for the tricarboxylic acid (TCA) cycle, through conversion to α-ketoglutarate. Higher glutamate levels could be the result of a cerebral protection mechanism in response to multiple hypoglycemic insults during a lifetime with diabetes. We also found higher aspartate levels in type 1 diabetes with IAH which may be associated with the malate – aspartate shuttle and NAD+/NADH balance.
In conclusion, we show that there are alterations in neuro-metabolites in patients with type 1 diabetes. Cerebral glutamate levels are higher in type 1 diabetes and correlate with known risk factors for cerebral decline, suggesting a potential role for glutamate in the cerebral complications of type 1 diabetes. Recurrent hypoglycemia, as reflected by the presence of IAH, has only limited additional impact on the neurochemical profile of patients with type 1 diabetes.
Acknowledgements
No acknowledgement found.References
- Moheet et al., Ann N Y Acad Sci 2015
- Cukierman-Yaff et al., Diabetes Metab Res Rev 2014
- Rooijackers et al., Cell Mol Life Sci 2016
- Jacobson et al. Diabetologia 2011
- Hansen et al, Diabetologia 2017
- Scheenen et al, Magn Reson Med 2008
- Provencher Magn Reson Med 1993
- Mangia et al, Neurochem Res 2012
Figures