0175
Glial and axonal changes in mouse models of disease investigated with diffusion-weighted magnetic resonance spectroscopy at 11.7 T1Centre de NeuroImagerie de Recherche (CENIR), Institut du Cerveau et de la Moelle épinère (ICM), Paris, France, 2Sorbonne Université, UMR S 1127, Inserm U 1127, CNRS UMR 7225, Institut du Cerveau et de la Moelle épinère (ICM), Paris, France, 3Department of Computer Science and Centre for Medical Image Computing, University College of London (UCL), London, United Kingdom, 4Institute of biomedical imaging, Atomic Energy and Alternative Energies Commission (CEA), Fontenay-aux-Roses, France, 5Champalimaud Neuroscience Programme, Champalimaud Centre for the Unknown, Lisbon, Portugal, 6Core Facility ICM.Quant, Institut du Cerveau et de la Moelle épinère (ICM), Paris, France
Synopsis
The goal of this study was to evaluate the alterations of white matter microstructure in two different mouse models of white matter disease: the cuprizone (CPZ) model of multiple sclerosis and the Plp1 overexpressing (PLP-tg66) model of Pelizeaus-Merzbacher disease. To this end, we employed diffusion-weighted MR spectroscopy (DW-MRS) to measure concentrations and apparent diffusion coefficients of several metabolites in the corpus callosum of wild-type, CPZ and PLP-tg66 mice at 11.7 T. DW-MRS markers of axonal and glial degeneration were compared with histological measures.
Purpose
Diffusion-weighted MR spectroscopy (DW-MRS) is a unique technique to disentangle different pathological mechanism of brain tissue, by providing specific markers of axonal and glial cells damage1-2. In particular, diffusion of N-acetylaspartate + N-acetylglutamate (tNAA) has been suggested as a marker of intra-axonal damage3, while diffusion of choline compounds (tCho) gives insight into alterations of glial cells4. Recently, diffusion of myo-inositol (Ins) has been shown to be sensitive to astrocytic morphological changes5. Here we used the cuprizone (CPZ) mouse model of multiple sclerosis to reproduce pathological features of inflammation and demyelination6 and the Plp1 overexpressing (PLP-tg66) mouse model of Pelizeaus-Merzbacher disease to reproduce hypomyelinating disorder7. The aim of this study was to compare metabolite concentrations and apparent diffusion coefficients (ADCs) measured in CPZ and in PLP-tg66 with those derived in their corresponding strains of wild-type (WT) mice, and to compare these measures with histological markers, in order to determine whether DW-MRS provides reliable biomarkers of white matter integrity.Methods
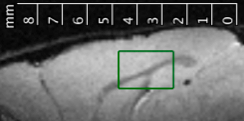
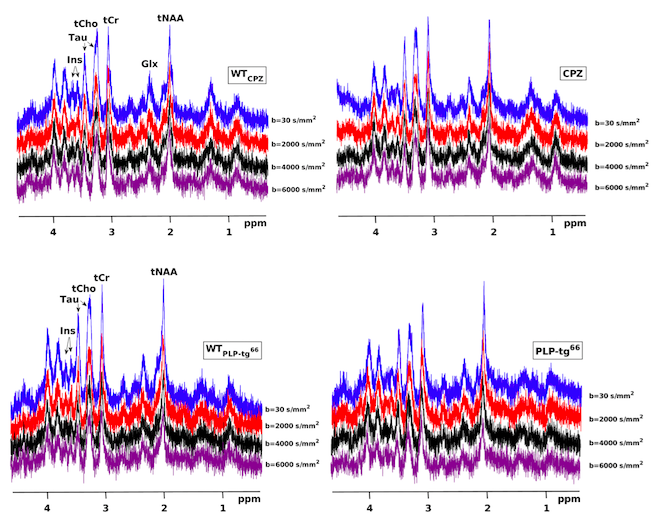
Two strains of mice were used for the two models. Nine CPZ and ten WTCPZ mice, twelve PLP-tg66 and nineteen WTPLP-tg66 mice were scanned with an 11.7 T Bruker scanner using a diffusion-weighted STE-LASER sequence8. A volume of interest of 6x1.5x3 mm3 was located in the body of the corpus callosum (Figure 1). Spectra were acquired with TE/TR=33/5000 ms, and TM=60 ms. Diffusion weighting was applied in three orthogonal directions with diffusion time Δ=64 ms and four b-values of 30, 2000, 4000, 6000 s/mm2 (32 averages per condition) (Figures 2). Unsuppressed water data were also acquired for eddy current corrections. At each b-value, frequency and phase corrections were performed on single scans before averaging. Spectra quantification was performed with LCModel9. Data were considered reliable according to Cramer-Rao lower bound (CRLB) thresholds (CRLB<5% for tNAA, tCr (creatine + phosphocreatine) and Tau (taurine), CRLB<10% for tCho, Ins). ADCs were calculated for tNAA, tCho and Ins by log-linear regressions of the signal decay plotted as function of the b value. Histological measures of axonal integrity and inflammation were obtained by electron microscopy (EM) and immunohistochemistry (IHC) (as described in [10-11]).Results
Diffusion-weighted spectroscopy
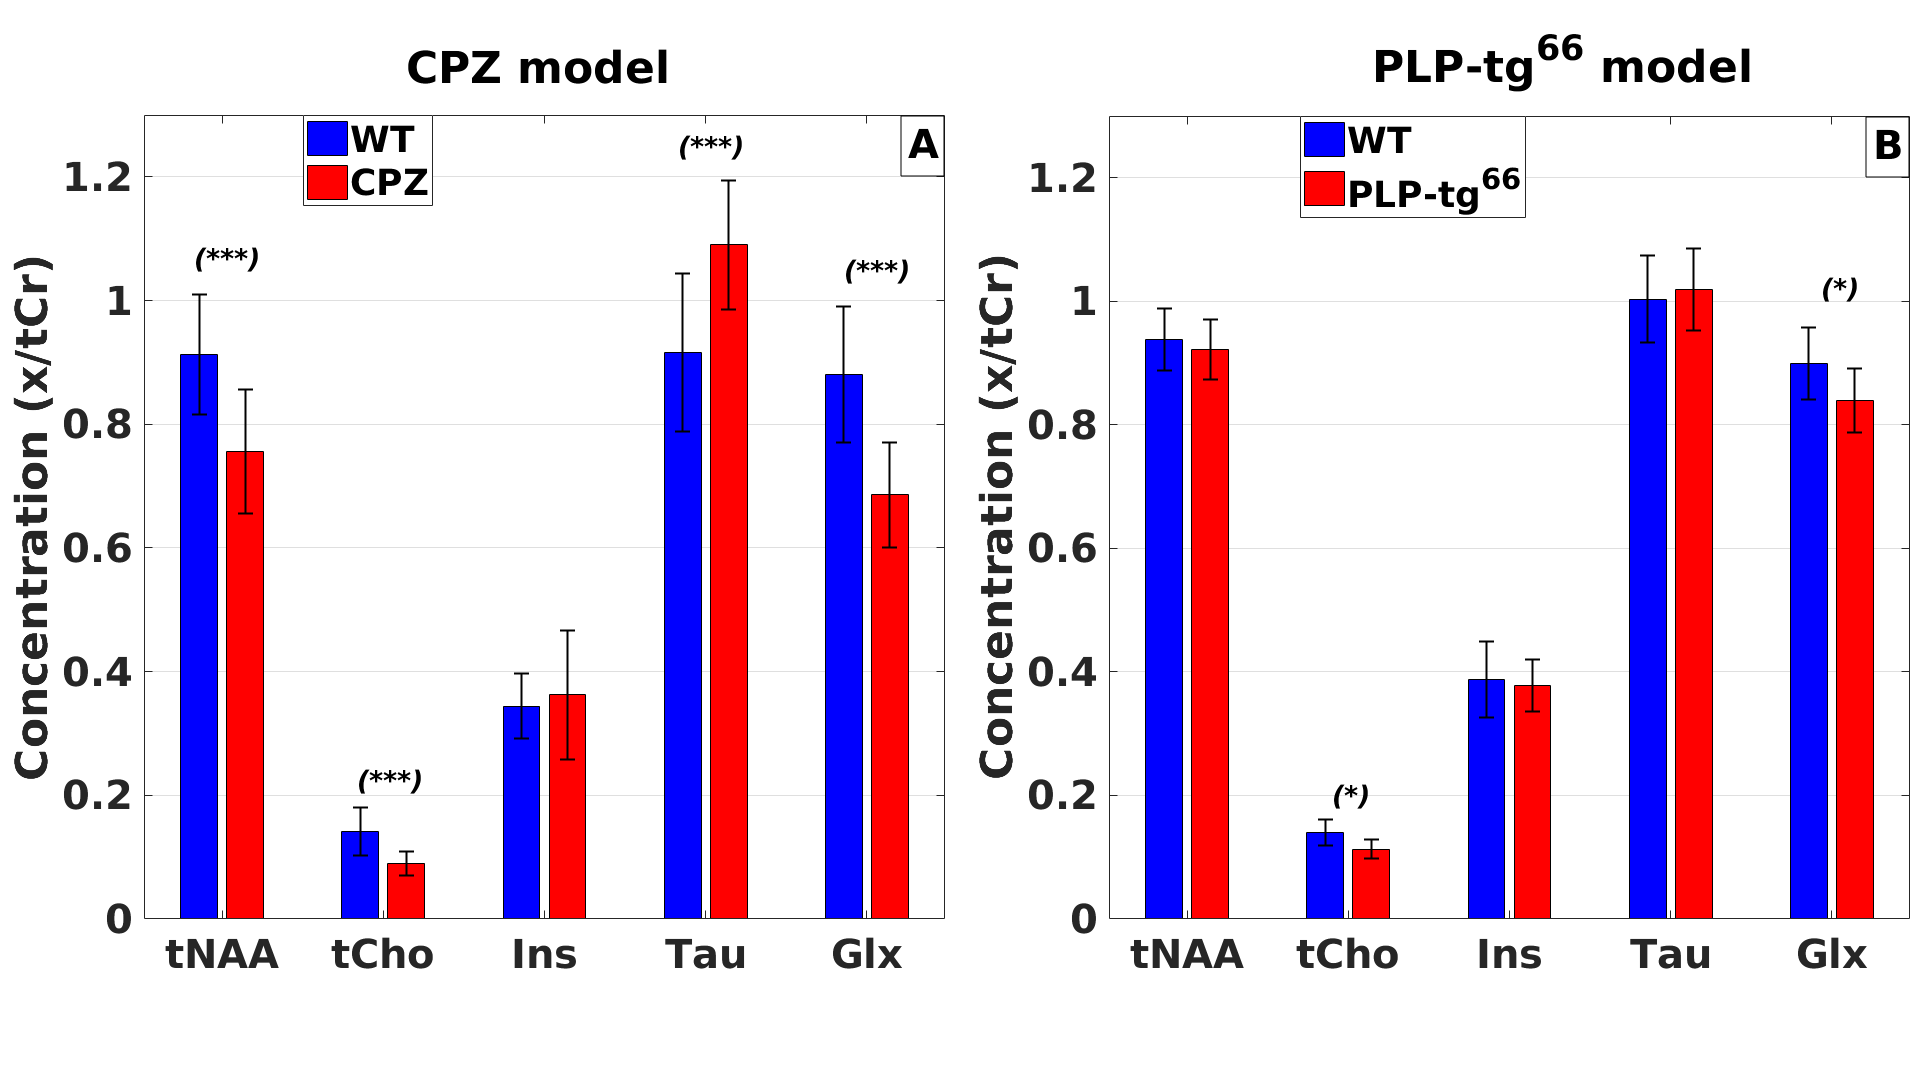
Concentrations: Metabolite concentrations were expressed as concentration ratios relative to tCr, since the absolute tCr concentration did not differ significantly between groups (CPZ vs WTCPZ and PLP-tg66 vs WTPLP-tg66). Significant variations were observed in tNAA/tCr, tCho/tCr, Tau/tCr and glutamate+glutamine (Glx)/tCr (p<0.005) in CPZ vs WTCPZ, and in tCho/tCr and Glx/tCr (p<0.05) in PLP-tg66 vs WTPLP-tg66 (Figure 3).
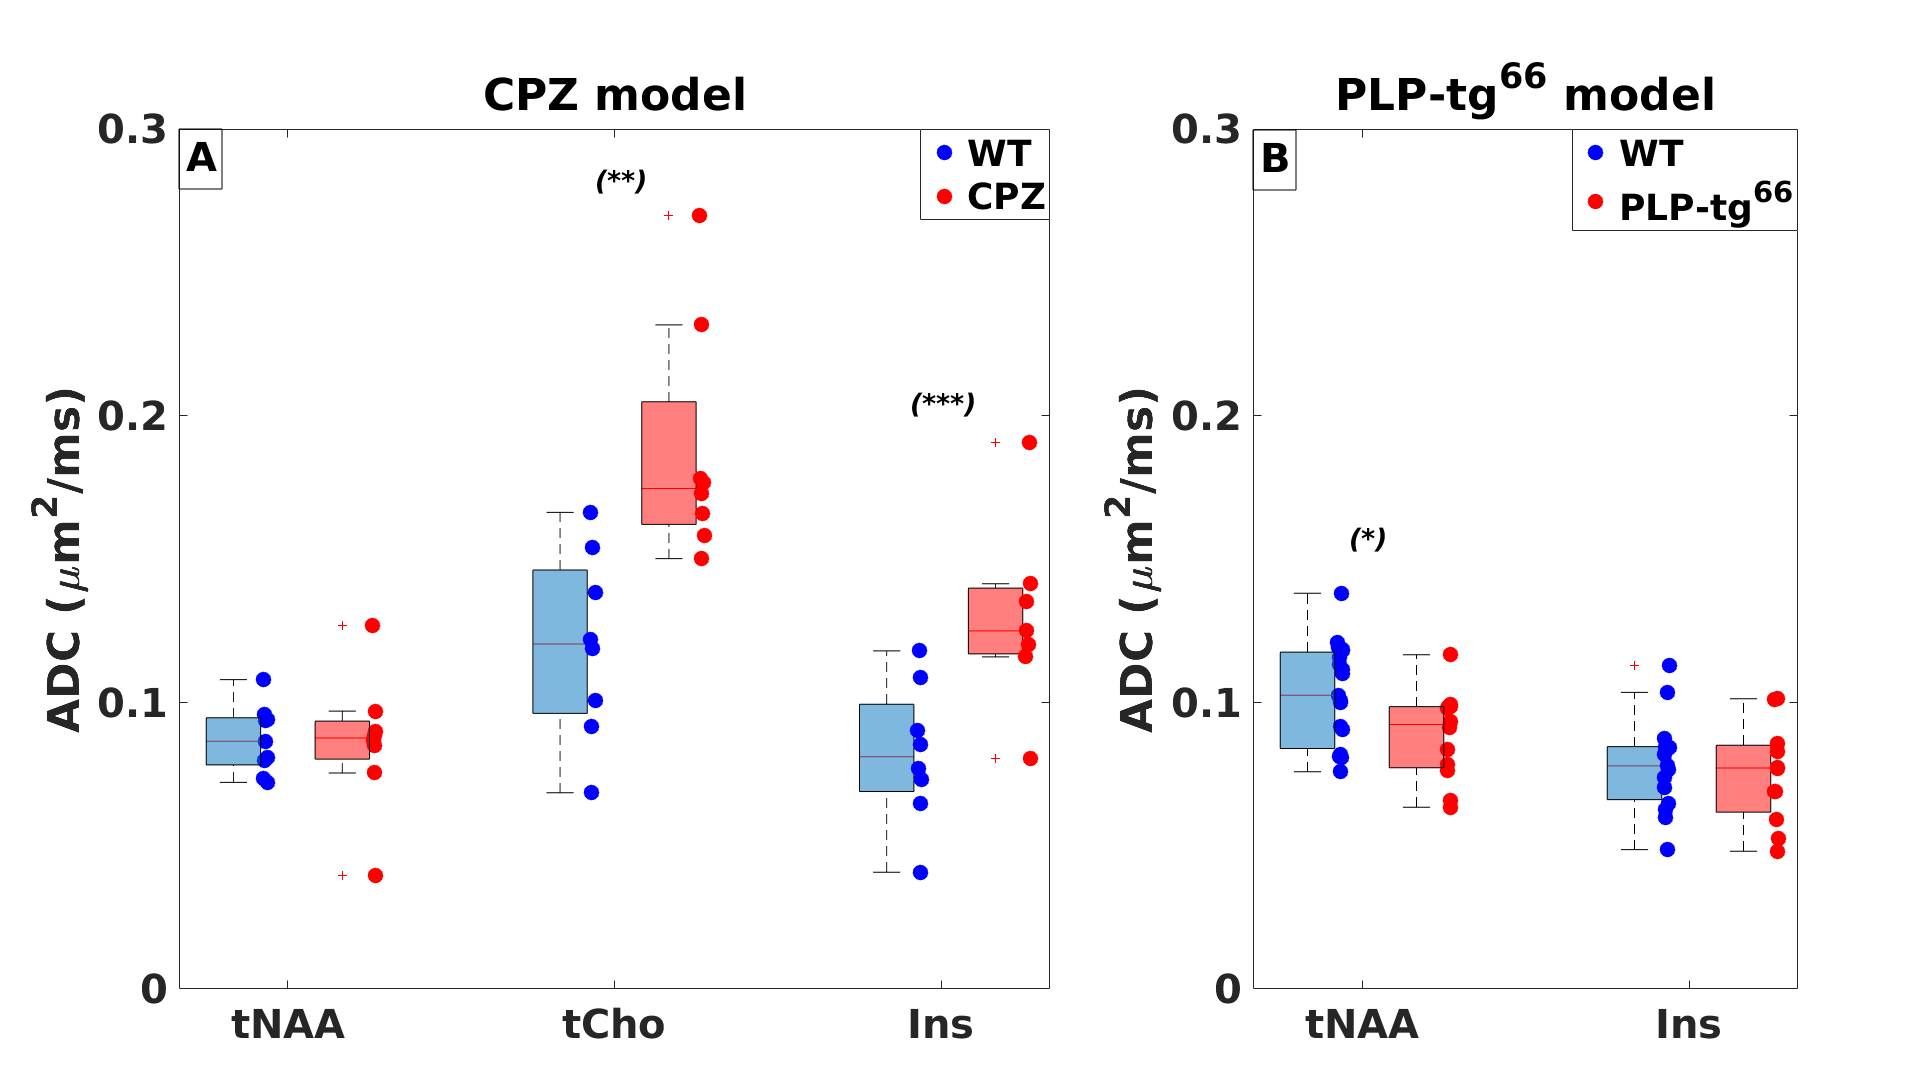
Metabolite diffusion: Interestingly, a significant increase was observed in the ADCs of tCho (p<0.005) and Ins (p<0.01) in CPZ mice compared to WTCPZ, whereas no significant variation was found in ADC of tNAA (Figure 4). Conversely, in PLP-tg66, a significant decrease in ADC of tNAA (p<0.05) was observed compared to WTPLP-tg66, while no significant variation was found in ADC of Ins between the two groups. tCho diffusion data in PLP-tg66 mice were not evaluated due to the low signal-to-noise ratio at high b values.
Histology
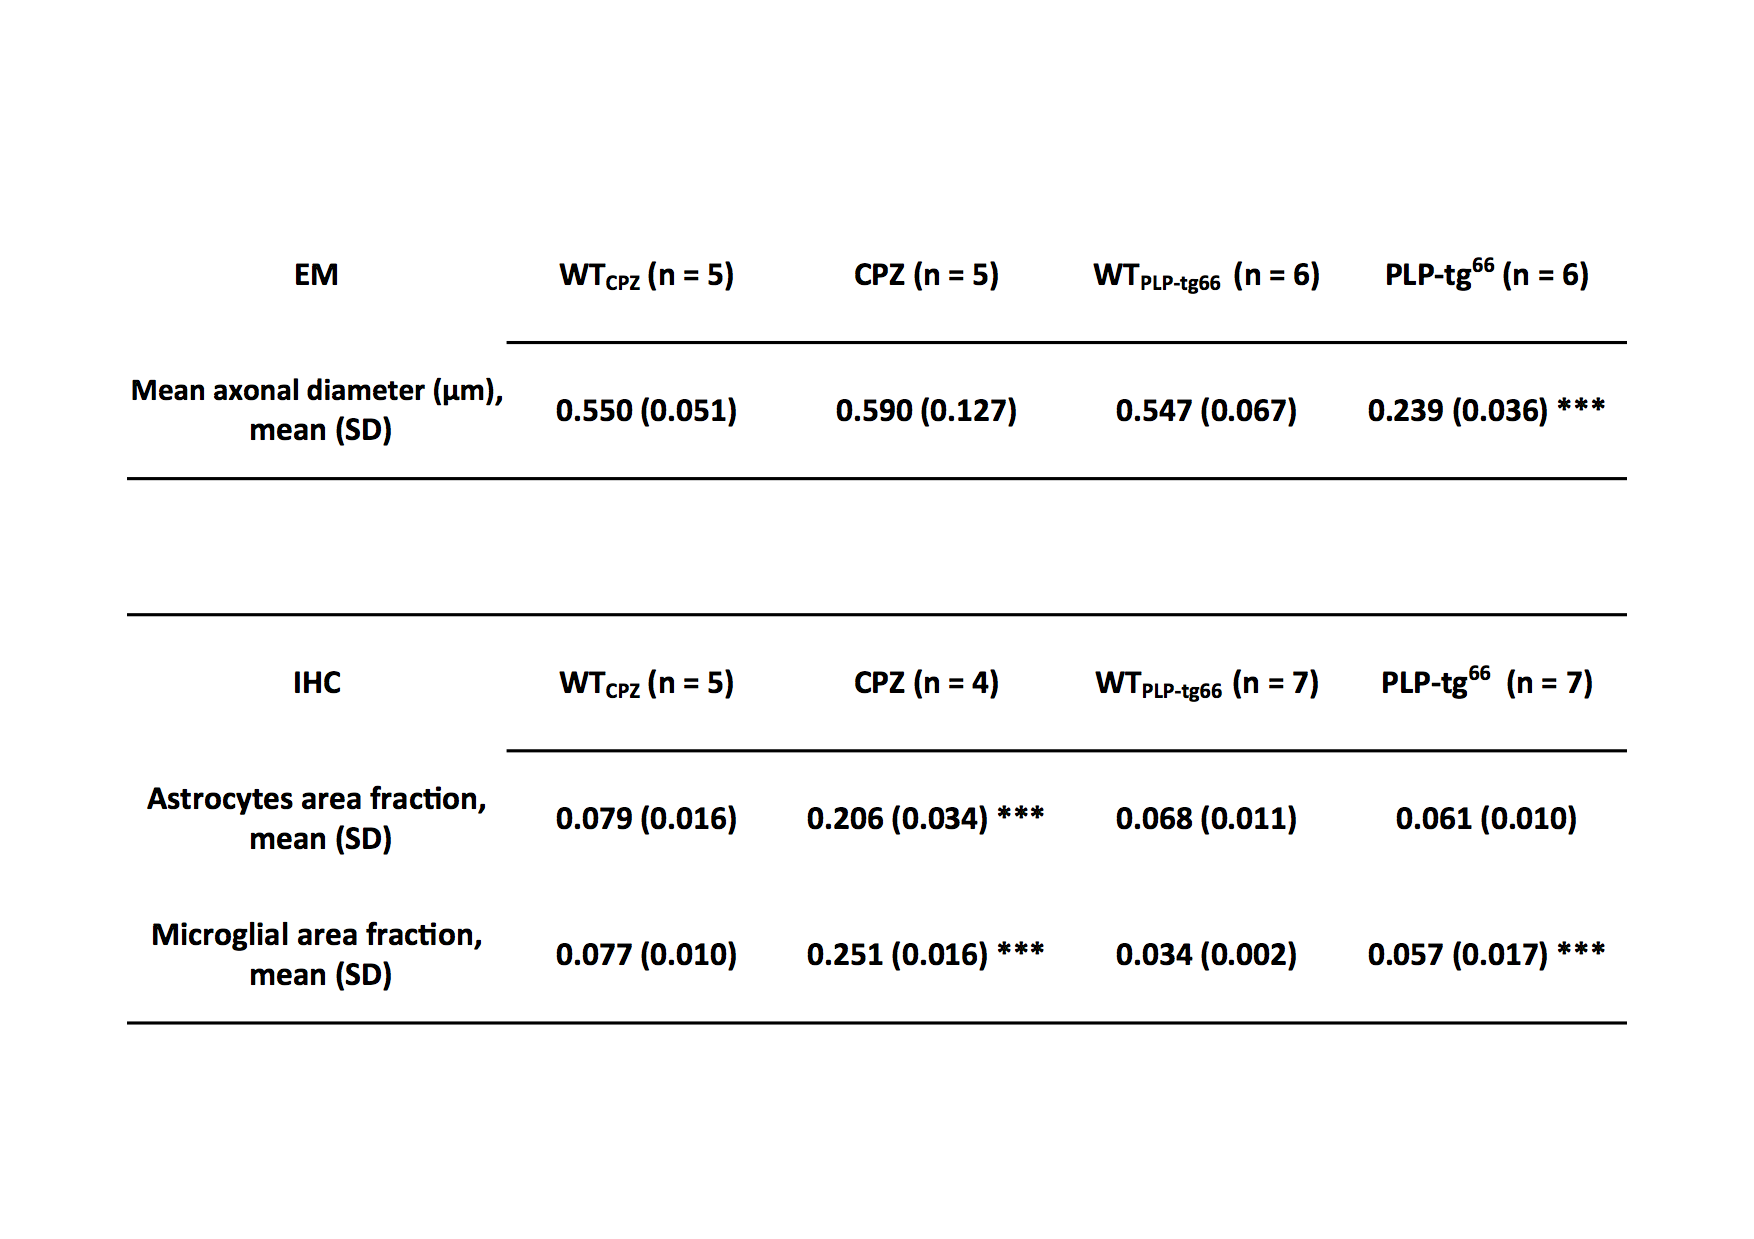
EM: Axonal diameters did not change significantly in CPZ mice compared to WTCPZ, whereas a significant reduction was observed in PLP-tg66 vs WTPLP-tg66 (table 1).
IHC: Significant increased astrocytic and microglial activity were present in CPZ mice compared to WTCPZ. Microgliosis but no astroglial alterations were observed in PLP-tg66 vs WTPLP-tg66 (table 1).
Discussion
Concentrations: Decrease of tNAA/tCr, tCho/tCr and Glx/tCr may be correlated to mitochondrial dysfunction, as previously suggested12, which is a known pathological feature in both models. Increase of Tau/tCr in CPZ mice likely reflects the presence of inflammation11 also revealed by increased astrocytic and microglial immunofluorescence.
tNAA diffusion: No difference in CPZ mice could reflect axonal integrity as confirmed by normal neurofilament immunofluorescence and by intact axonal diameters from EM measures. Moreover, the decrease of tNAA ADC in PLP-tg66 mice was compatible with the axonal diameters reduction, which was evidenced from EM measures.
tCho diffusion: Increase in CPZ mice was consistent with glial cell activation/swelling induced by inflammation processes. Ins diffusion: Increase in CPZ mice and no variation in PLP-tg66 mice suggested the presence of astrocytic hypertrophy in CPZ model. This result was confirmed by increased astrocytic immunofluorescence in CPZ mice and no alteration in PLP-tg66 mice.
Conclusion
In both models, metabolite diffusion metrics provided additional information to conventional MRS and were consistent with histological findings. These results strengthen the value of using DW-MRS metrics as markers of axonal integrity (tNAA diffusion), astrocytic activity (Ins diffusion), and inflammation (tCho). The full study will incorporate correlations of DW-MRS biomarkers with histological data.Acknowledgements
The authors acknowledge support from Investissements d’avenir [grant number ANR-10-IAIHU-06 and ANR-11-INBS-0006].References
[1] Nicolay et al, Diffusion NMR spectroscopy, NMR Biomed, 14:94-111 (2001).
[2] Palombo et al, Insights into brain microstructure from in vivo DW-MRS, NeuroImage 182:97-116 (2018)
[3] Wood et al, Investigating axonal damage in multiple sclerosis by diffusion tensor spectroscopy, J Neurosci, 32(19):6665-6669 (2012).
[4] Ercan et al, Glial and axonal changes in systemic lupus erythematosus measured with diffusion of intracellular metabolites, Brain, 139(5):1447-1457 (2016).
[5] Ligneul et al, Diffusion-weighted magnetic resonance spectroscopy enables cell-specific monitoring of astrocyte reactivity in vivo, bioRxiv, https://doi.org/10.1101/350306.
[6] Gudi et al, Glial response during cuprizone-induced de- and remyelination in the CNS: lesson learned, Front Cell Neurosci 8(73) (2014).
[7] Ruiz et al, Oxidative stress and mitochondrial dynamics malfunction are linked in Pelizeaus-Merzbacher disease, Brain Pathol 28: 611-630 (2018).
[8] Ligneul et al, Metabolite diffusion up to very high b in the mouse brain in vivo: Revisiting the potential correlation between relaxation and diffusion properties, MRM, 77(4):1390-1398 (2017).
[9] Provencher, Estimation of metabolite concentrations from localized in vivo proton NMR spectra, MRM 30: 672-679 (1993).
[10] Orije et al, Longitudinal monitoring of metabolic alterations in cuprizone mouse model of multiple sclerosis using 1H-magnetic resonance spectroscopy, NeuroImage 114:128–135 (2015).
[11] Jelescu et al, In vivo quantification of demyelination and recovery using compartment-specific diffusion MRI metrics validated by electron microscopy, NeuroImage 132: 104-114 (2016).
[12] Xuan et al, The cuprizone-induced changes in 1H-MRS metabolites and oxidative parameters in C57BL/6 mouse brain: Effects of quetiapine, Neurochem Int 90: 185-192 (2015).
Figures