0170
Metrics that Matter: Improved statistical power to detect differences in tissue microstructure through dimensionality reduction1School of Psychology, Cardiff University Brain Research Imaging Centre, Cardiff, United Kingdom, 2Department of Paediatrics, The University of Melbourne, Parkville, Australia, 3Developmental Imaging, Murdoch Childrens Research Institute, Parkville, Australia, 4Computer Science, University of Sherbrooke, Sherbrooke, QC, Canada, 5School of Psychology, Australian Catholic University, Victoria, Australia
Synopsis
Various diffusion metrics have been proposed for characterising tissue microstructure. However, it is unclear which metric best captures individual microstructural differences. One possible approach is to explore all available metrics. However, this increases the chance of Type I error and makes interpretation difficult. Using data-reduction approaches, we identified two principal components that capture 85% of the variance in diffusion measurements. The first captures properties related to hindrance, while the second reflects tissue complexity. We demonstrate the utility of this approach by showing significant correlations with age of these new metrics, whereas little to no effects were observed with any individual metric.
Introduction
Profiling diffusion MRI metrics along brain pathways allows for a comprehensive assessment of white matter microstructure1-4. However, many of these metrics share overlapping information which may cause redundancies in data analysis and ultimately decrease statistical power. To avoid this, we propose a data reduction framework to explore redundant covariance using various diffusion MRI metrics. We hypothesize that this process will 1) provide better insight into patterns of associations between the different metrics and 2) show increased sensitivity to individual differences in tissue microstructure. We demonstrate the utility of this approach by applying our method to study age-related differences in tissue microstructure in healthy children and adolescents.Methods
Acquisition: Data from 37 young healthy volunteers (age 8-18) were acquired using a CHARMED5 protocol on a Siemens 3T Connectom system with 14 b0 images, 30 directions at b = 500,1200 s/mm², 60 directions at b = 2400, 4000, 6000 s/mm² and 2×2×2 mm³ voxels (TE/TR: 59/3000 ms, δ/Δ: 7.0/23.3 ms).
Preprocessing: Data were denoised6, corrected for signal drift7, motion8, distortion9, gradient non-linearities10 and Gibbs ringing11.
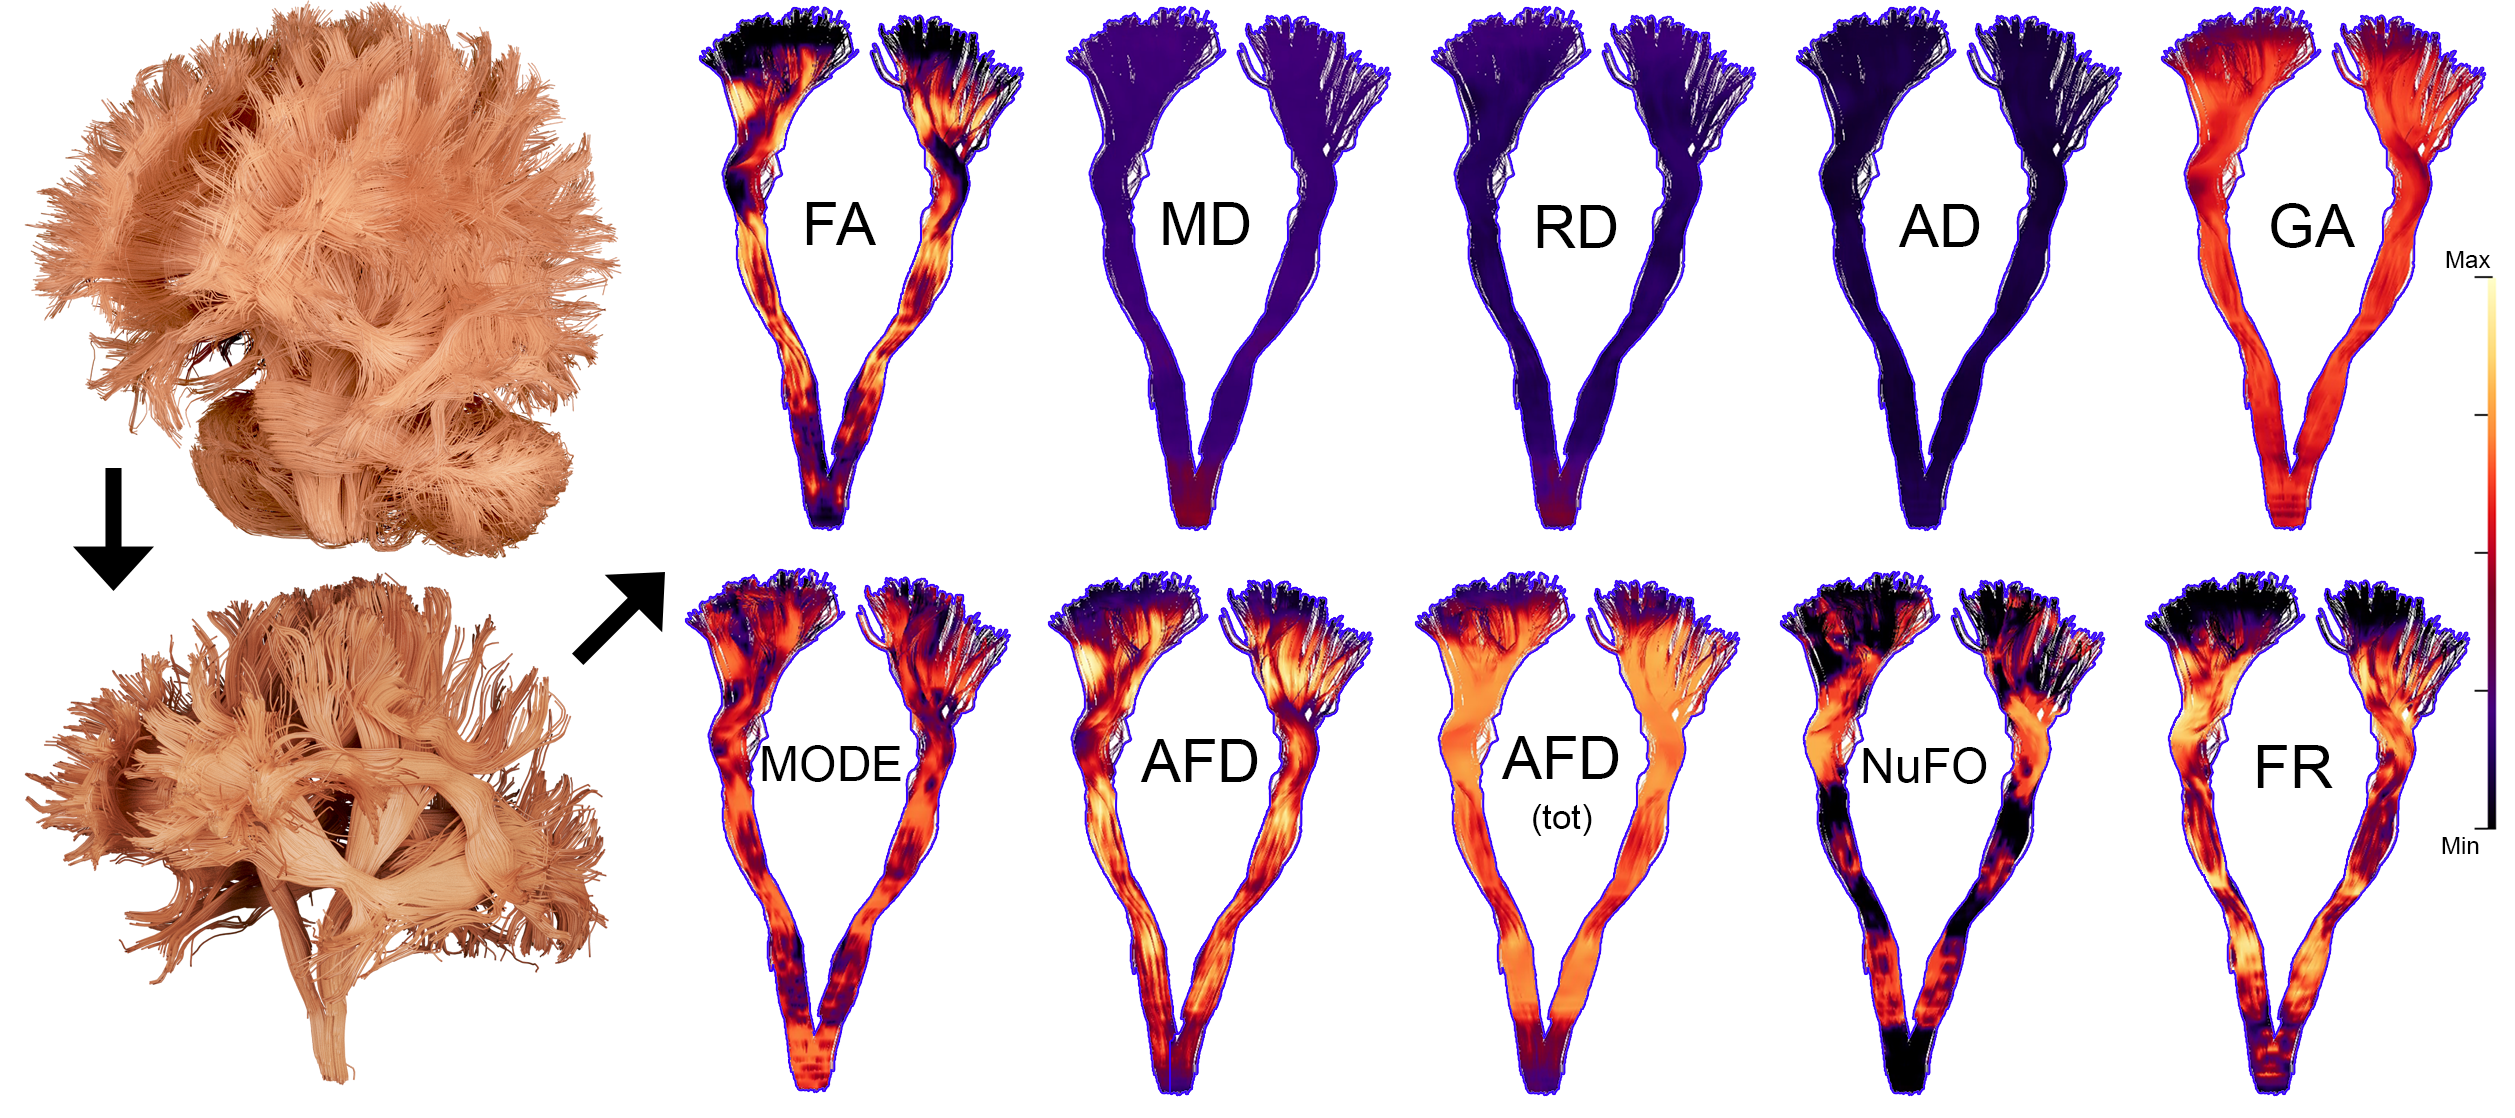
Processing: Multi-shell multi-tissue constrained spherical deconvolution12 (MSMT-CSD) was applied to generate fiber Orientation Distribution Functions (fODFs, lmax = 8) using 3-tissue group-averaged response functions, followed by image intensity normalisation MRtrix13. For each subject, whole-brain tractography and manual extraction of 22 bundles was done using FiberNavigator14 (1.8M seeds, fODF peaks > 0.1). For each bundle, along-tract profiling was performed along 20 sections using the Python toolbox developed by Cousineau et al.4, where streamlines points are assigned to a representative core version of the bundle. The following metrics (Fig. 1) were then averaged per sections of the core, based on their weighted distance assignments: Fractional Anisotropy (FA), Axial Diffusivity (AD), Radial Diffusivity (RD), Mean Diffusivity (MD), Geodesic Anisotropy15 (GA), Tensor Mode16, Apparent Fiber Density17 (AFD, fiber-specific), AFDtot (l = 0), Number of Fiber Orientations18 (NuFO) and Restricted fraction5 (FR).
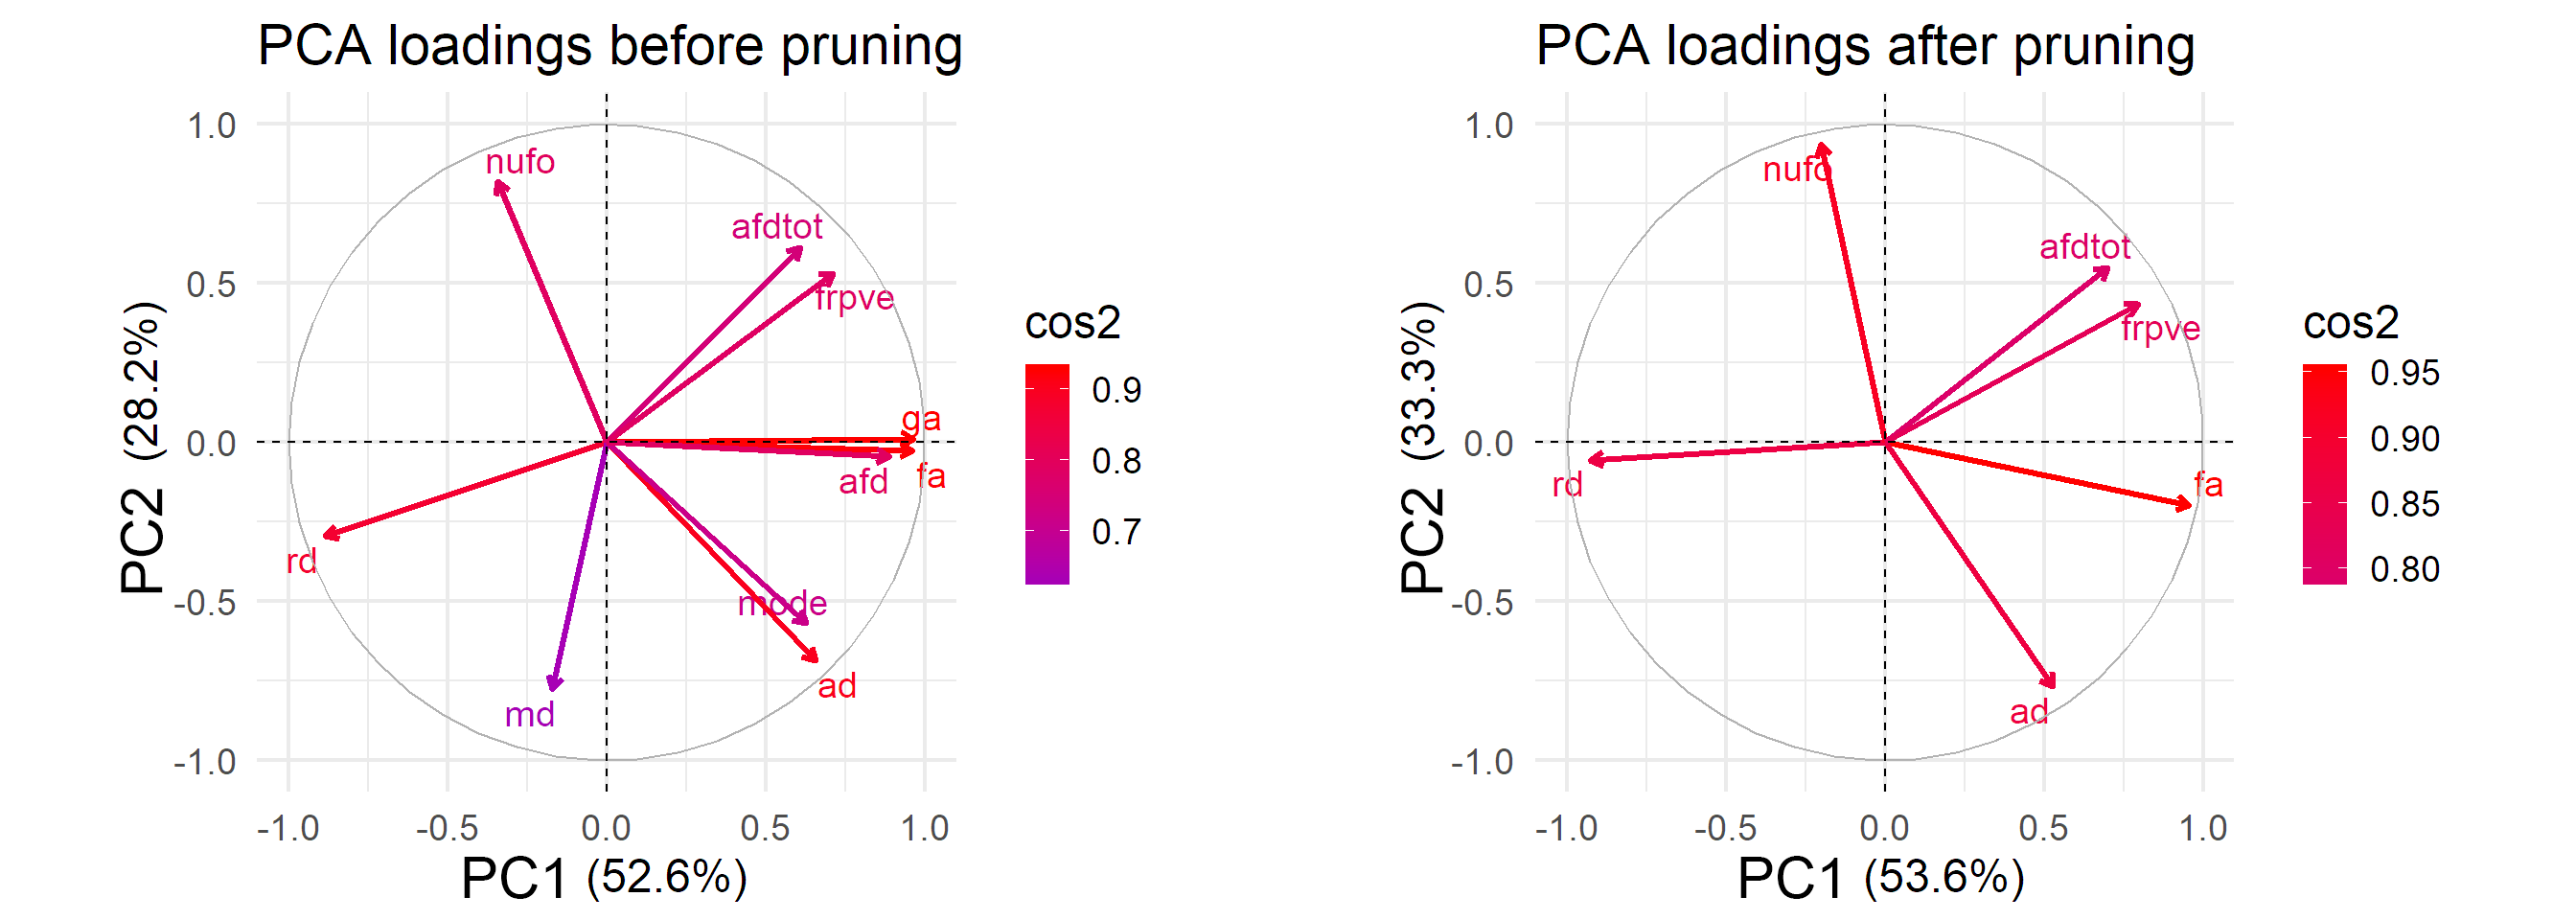
Statistical analysis: A principal component analysis (PCA) was applied to analyse the contribution of each metric (variables) by concatenating the entire set of profiles (z-transformed) across subjects and bundles. Metrics showing shared variance or failing the Kaiser-Meyer-Olkin test for sampling adequacy (KMO < 0.5) were discarded to balance stability and the PCA was re-computed. PC maps were then derived using a linear combination of the z-transformed metrics (weighted by their contribution to each PC). Finally, age relationships were investigated for each bundle using a conservative Bonferroni multiple comparisons correction (0.05 / (M maps × N bundles)), whereby statistical significance was defined as: pPCs < 1.1e-3, and pmetrics < 2.2e-4.
Results
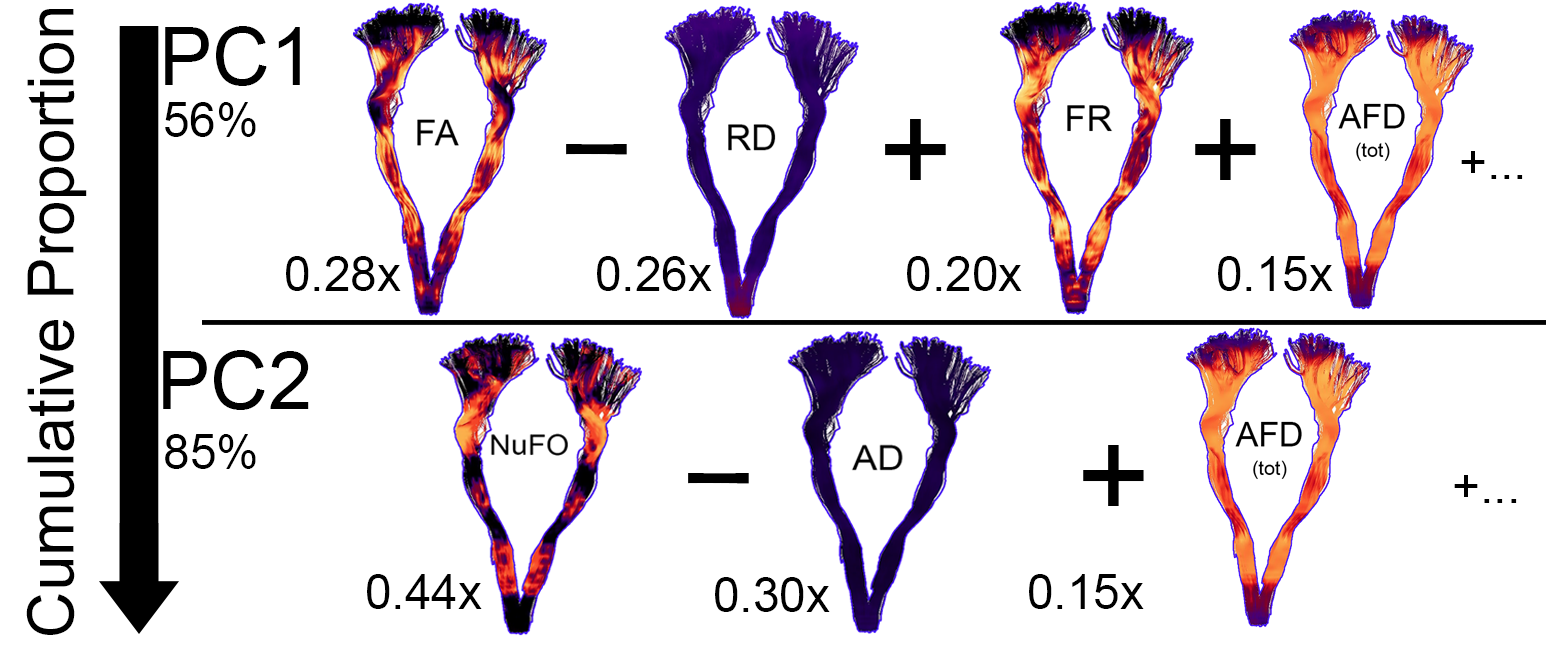
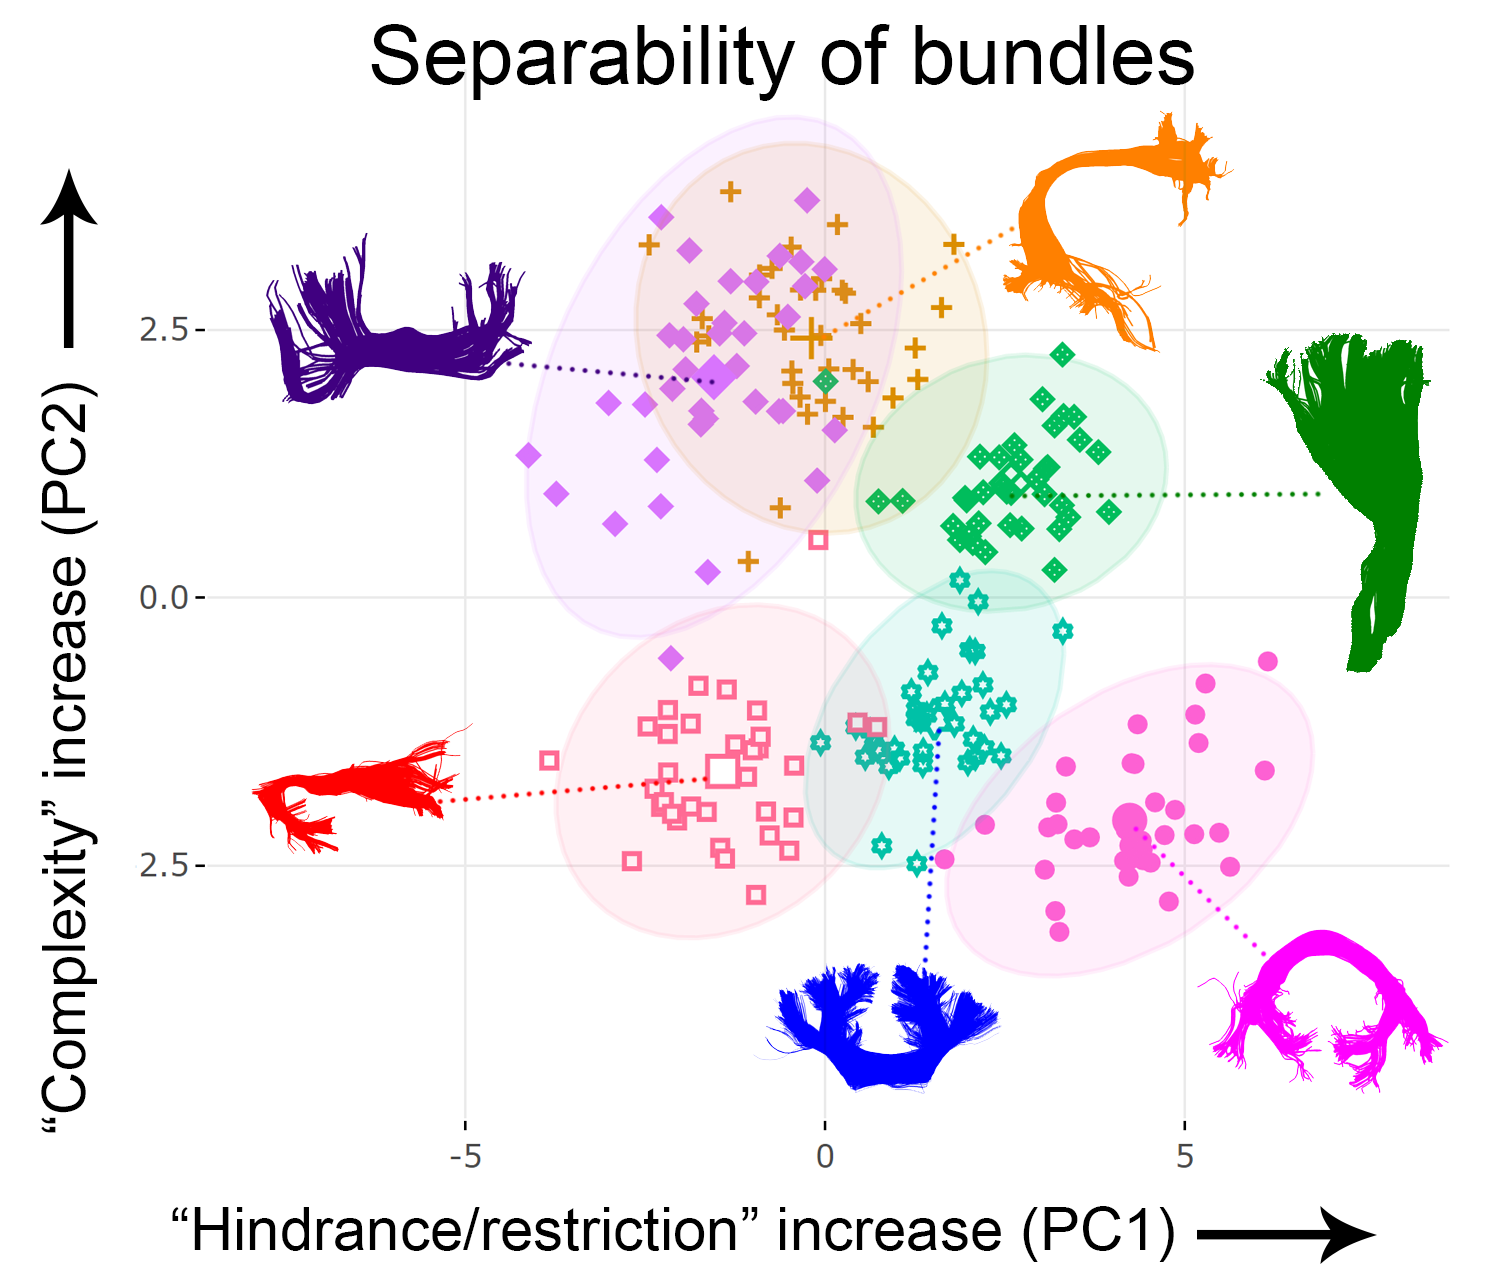
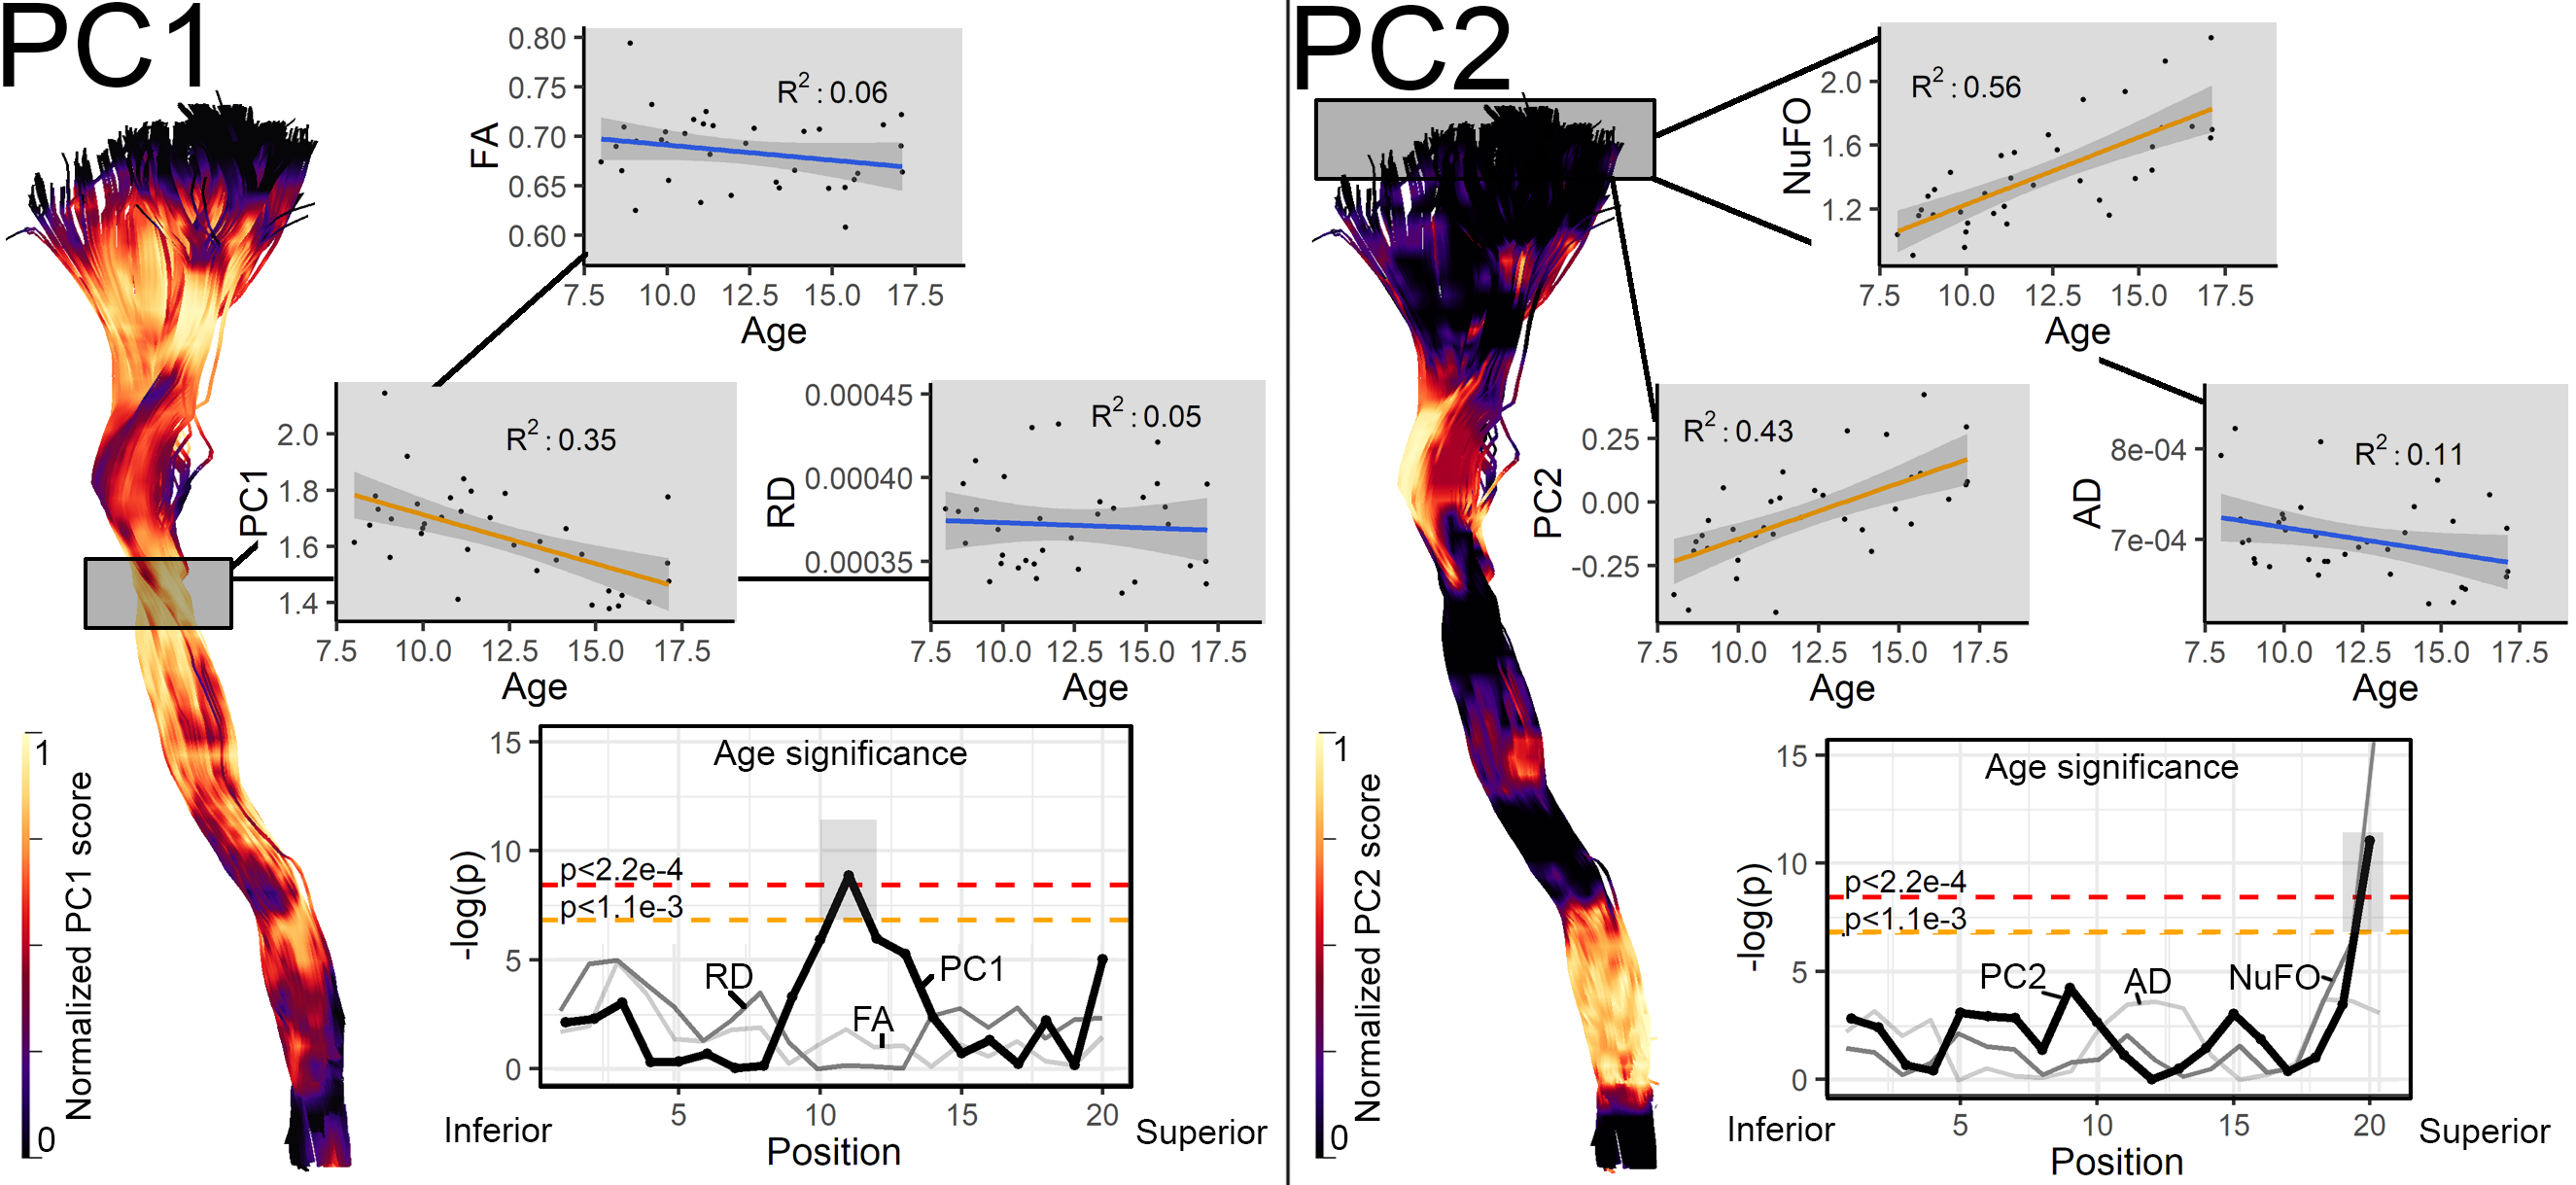
Fig. 1 illustrates the various input metrics mapped along the corticospinal tract (CST) of a representative subject. Clear dissociation between those metrics is observed in Fig. 2 after the removal of redundant ones (i.e., GA, AFD, Mode and MD). The first two PCs account for 85% of the variability in the data (KMOtot: 0.70). The PC that explains the largest part of the variability comprises FA, RD, AFDtot and FR. (Fig. 3, PC1). The second PC is mostly driven by dispersion and complexity-sensitive measurements (NuFO, AD). Fig. 4 shows how different bundles project and cluster in the new reference frame (bundle averages). Fig. 5 shows that PC1 and PC2 have a stronger relationship with age in the CST when compared to the individual metrics forming those same PCs. Age relationships were also observed in other developmental-sensitive tracts19, 20 (e.g., arcuate fasciculus, cingulum and genu of the corpus callosum).Discussion
Metrics accounting for the largest percent of variance in the data (PC1) are those known to be most sensitive to hindrance or restriction in the signal, including FA, FR and AFD. In contrast, PC2 features metrics that are sensitive to complexity in the signal, such as NuFO and AD. Our results highlight the sensitivity of PC1 and PC2 as a composite measure by 1) showing significant correlation with age in regions where other metrics did not, and 2) reflecting effects captured by the other metrics.Conclusion
Our results support the use of data reduction to detect along tract differences in tissue microstructure. Specifically, the curse of dimensionality and redundancies in statistical analyses were considerably mitigated by the extracting components sensitive to the properties of hindrance/restriction and dispersion/complexity. Future work will involve non-linear dimensionality reduction techniques (e.g., manifold learning) to fully disentangle the metric space. The proposed framework may open new avenues for examining brain microstructure in general.Acknowledgements
MC is supported by the Postdoctoral Fellowships Program from the Natural Sciences and Engineering Research Council of Canada (NSERC) and a Wellcome Trust New Investigator Award (to DKJ). CMWT is supported by a Rubicon grant from the NWO. This work was also funded by a Wellcome Trust Strategic Award and a Wellcome Trust New Investigator Award.References
[1] Bells, S., et al. "Tractometry–comprehensive multi-modal quantitative assessment of white matter along specific tracts." Proc. ISMRM. Vol. 678. 2011.
[2] Yeatman, Jason D., et al. "Tract profiles of white matter properties: automating fiber-tract quantification." PloS one7.11 (2012): e49790.
[3] De Santis, Silvia, et al. "Why diffusion tensor MRI does well only some of the time: variance and covariance of white matter tissue microstructure attributes in the living human brain." Neuroimage 89 (2014): 35-44.
[4] Cousineau, Martin, et al. "A test-retest study on Parkinson's PPMI dataset yields statistically significant white matter fascicles." NeuroImage: Clinical 16 (2017): 222-233.
[5] Assaf, Yaniv, and Peter J. Basser. "Composite hindered and restricted model of diffusion (CHARMED) MR imaging of the human brain." Neuroimage 27.1 (2005): 48-58.
[6] Veraart, Jelle, et al. "Denoising of diffusion MRI using random matrix theory." NeuroImage 142 (2016): 394-406.
[7] Vos, Sjoerd B., et al. "The importance of correcting for signal drift in diffusion MRI." Magnetic resonance in medicine 77.1 (2017): 285-299.
[8] Andersson, Jesper LR, and Stamatios N. Sotiropoulos. "An integrated approach to correction for off-resonance effects and subject movement in diffusion MR imaging." Neuroimage 125 (2016): 1063-1078.
[9] Andersson, Jesper LR, Stefan Skare, and John Ashburner. "How to correct susceptibility distortions in spin-echo echo-planar images: application to diffusion tensor imaging." Neuroimage 20.2 (2003): 870-888.
[10] Glasser, Matthew F., et al. "The minimal preprocessing pipelines for the Human Connectome Project." Neuroimage 80 (2013): 105-124.
[11] Kellner, Elias, et al. "Gibbs‐ringing artifact removal based on local subvoxel‐shifts." Magnetic resonance in medicine 76.5 (2016): 1574-1581.
[12] Jeurissen, Ben, et al. "Multi-tissue constrained spherical deconvolution for improved analysis of multi-shell diffusion MRI data." NeuroImage 103 (2014): 411-426.
[13] Tournier, J‐Donald, Fernando Calamante, and Alan Connelly. "MRtrix: diffusion tractography in crossing fiber regions." International Journal of Imaging Systems and Technology 22.1 (2012): 53-66.
[14] Chamberland, Maxime, et al. "Real-time multi-peak tractography for instantaneous connectivity display." Frontiers in neuroinformatics 8 (2014): 59.
[15] Fletcher, P. Thomas, Stephen M. Pizer, and Sarang Joshi. Statistical variability in nonlinear spaces: Application to shape analysis and DT-MRI. University of North Carolina at Chapel Hill, 2004.
[16] Kindlmann, Gordon, et al. "Diffusion tensor analysis with invariant gradients and rotation tangents." IEEE Transactions on Medical Imaging 26.11 (2007): 1483-1499.
[17] Raffelt, David, et al. "Apparent fibre density: a novel measure for the analysis of diffusion-weighted magnetic resonance images." Neuroimage 59.4 (2012): 3976-3994.
[18] Dell'Acqua, Flavio, et al. "Can spherical deconvolution provide more information than fiber orientations? Hindrance modulated orientational anisotropy, a true‐tract specific index to characterize white matter diffusion." Human brain mapping34.10 (2013): 2464-2483.
[19] Lebel, Catherine, Sarah Treit, and Christian Beaulieu. "A review of diffusion MRI of typical white matter development from early childhood to young adulthood." NMR in Biomedicine (2017): e3778.
[20] Genc, Sila, et al. "Development of white matter fibre density and morphology over childhood: A longitudinal fixel-based analysis." NeuroImage 183 (2018): 666-676.
Figures