0169
Mapping short association fibres in the human visual system with ultra high resolution and high sensitivity diffusion MRI1Neurophysics, Max Planck Institute for Human cognitive and Brain Sciences, Leipzig, Germany, 2International Max Planck Research School on Neuroscience of Communication: Function, Structure, and Plasticity, Leipzig, Germany, 3Neurocomputation and Neuroimaging Unit, Department of Education and Psychology, Free University Berlin, Berlin, Germany, 4Felix Bloch Institute for Solid State Physics, Faculty of Physics and Earth Sciences, Leipzig University, Leipzig, Germany
Synopsis
Short association fibres connect proximal cortical areas over short distances. These fibres are highly underrepresented in the current MRI-derived human brain connectome. We combined sub-millimetre resolution diffusion MRI, acquired with a 300 mT/m gradient system and high sensitivity coil for imaging the occipital cortex, with fMRI-driven retinotopic maps of V1/V2. These maps were used to identify the short V1-V2 connections in the human visual processing stream. V1-V2 connectivity was in agreement with previously reported anatomical and functional connectivities. Our results provide an important step towards the construction of a more complete MRI-derived human brain connectome via robust short fibre mapping.
Introduction
Short association fibres or U-fibres connect proximal cortical areas over short distances1. U-fibres are highly underrepresented in the current MRI-derived human brain connectome. This is largely due to methodological challenges in Diffusion Weighted Imaging (DWI) of these fibres. High spatial resolutions and dedicated fibre estimation and tractography models are required to map the narrow crossing fibre structures in superficial white matter (SWM)2-4. Moreover, limited quantitative knowledge of geometry and distribution makes validation of U-fibre mapping difficult5.
Connectivity is well characterised in early cortical areas of the primate visual processing stream6-7. The visual system is an ideal testbed for mapping short association fibres using DWI tractography. It is known that visual information flow between primary and secondary visual cortical areas (V1, V2) follows the principle of retinotopic projection, suggesting highly efficient connectivity of the retinotopic segments via short connections.
Here, short association fibres connecting V1-V2 in the human visual processing stream were mapped using sub-millimetre resolution DWI. Results were in line with fMRI-based retinotopy and published anatomical and functional connectivities of V1 and V2 6-11. The presented method was combined with myelin-sensitive quantitative MRI metrics12 to characterize myelination in short association fibres.
Methods
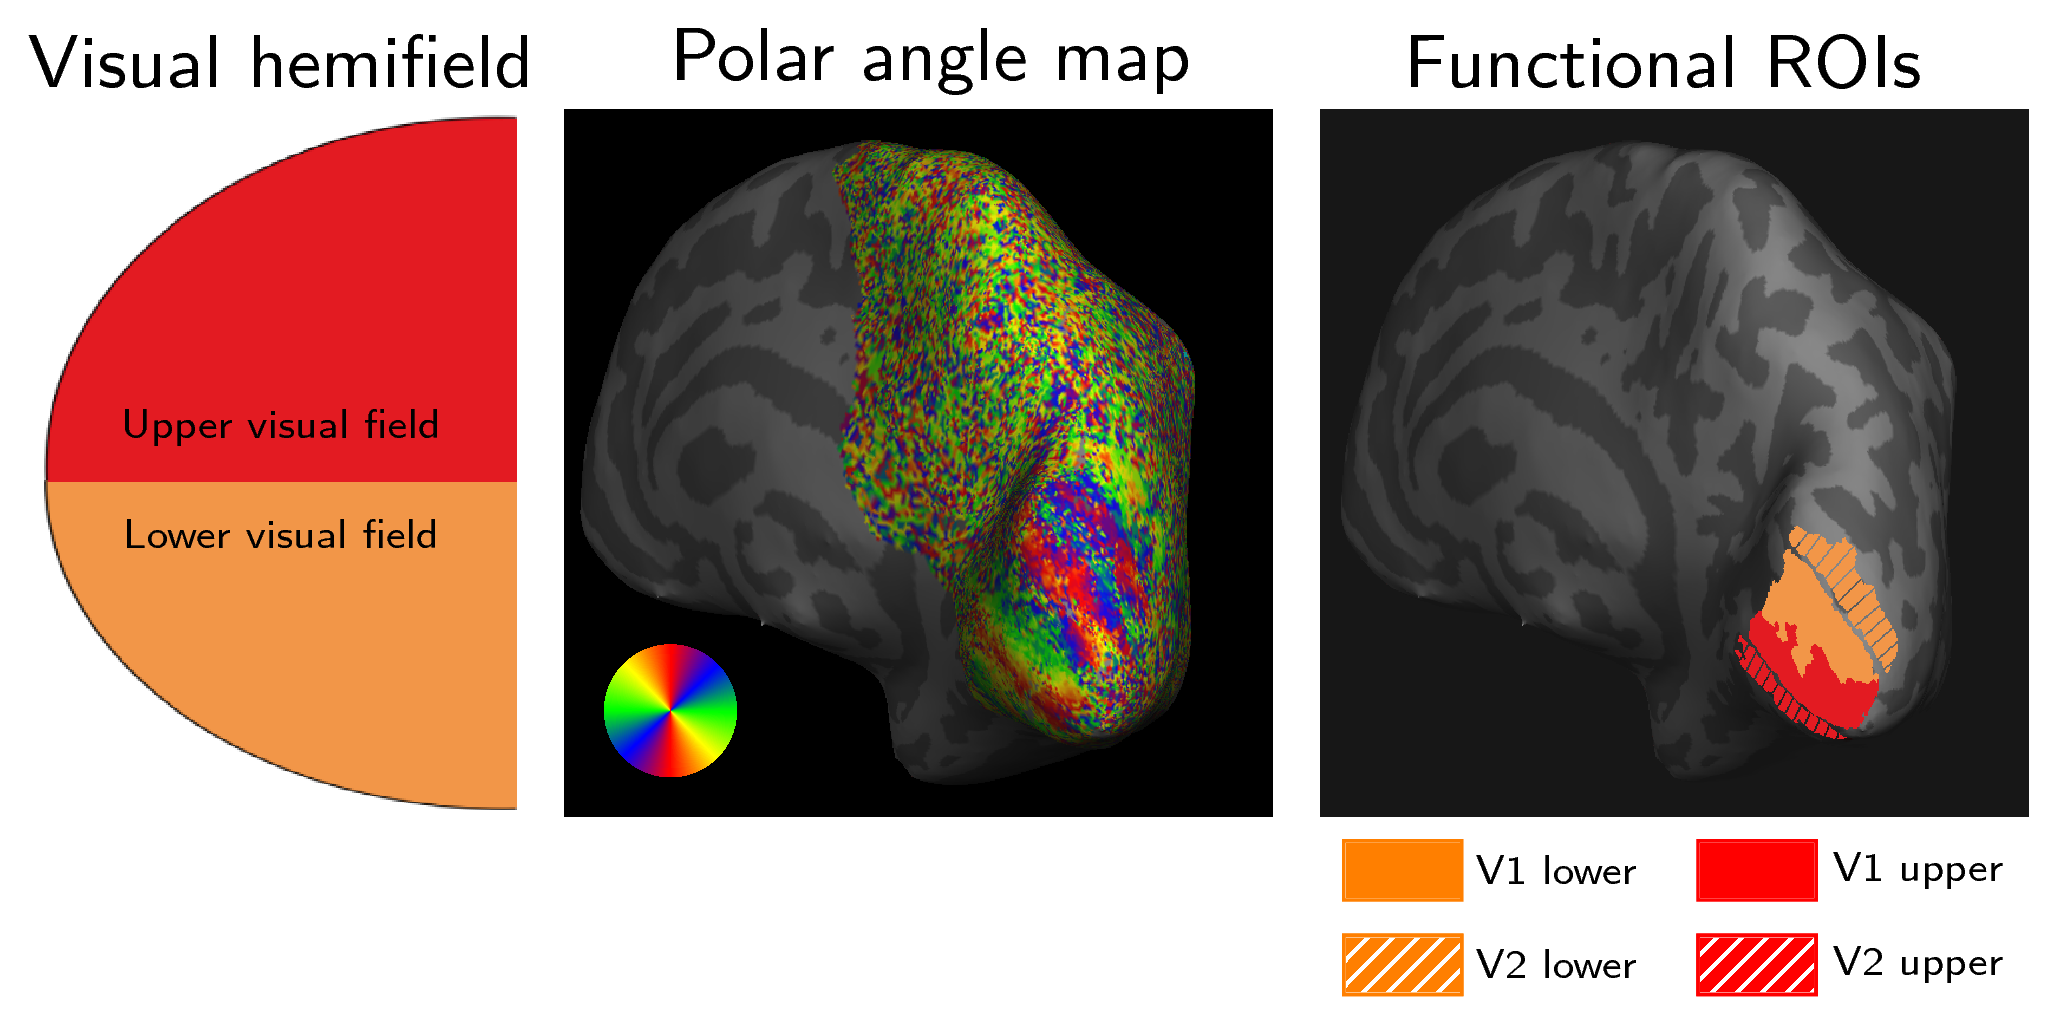
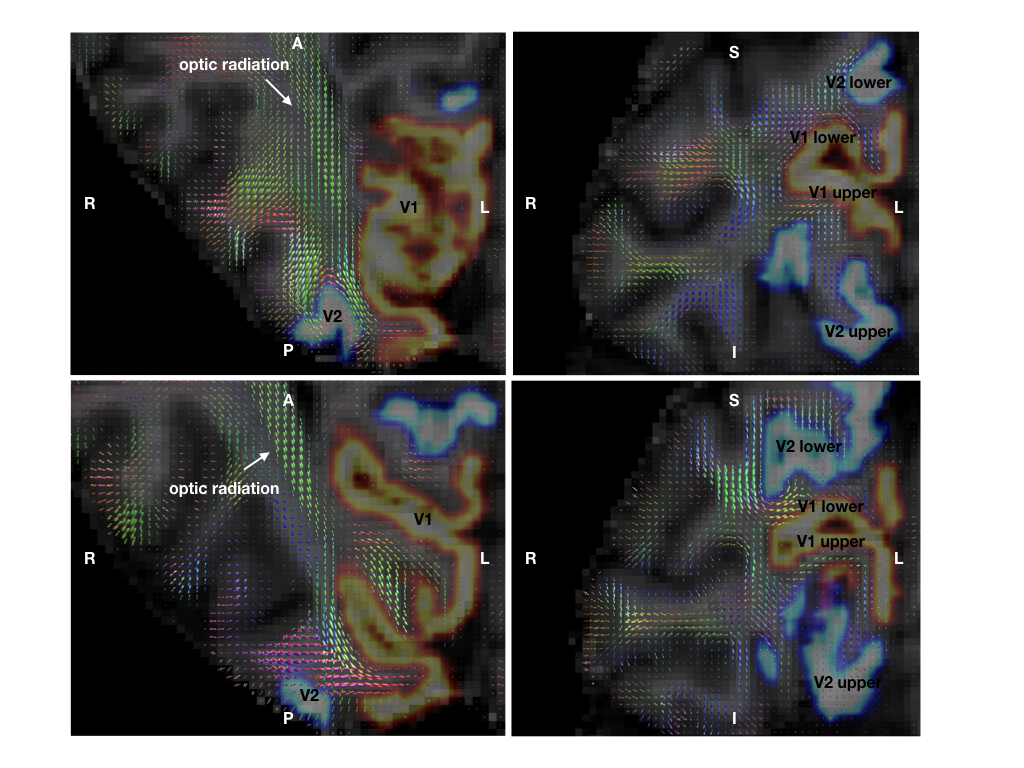
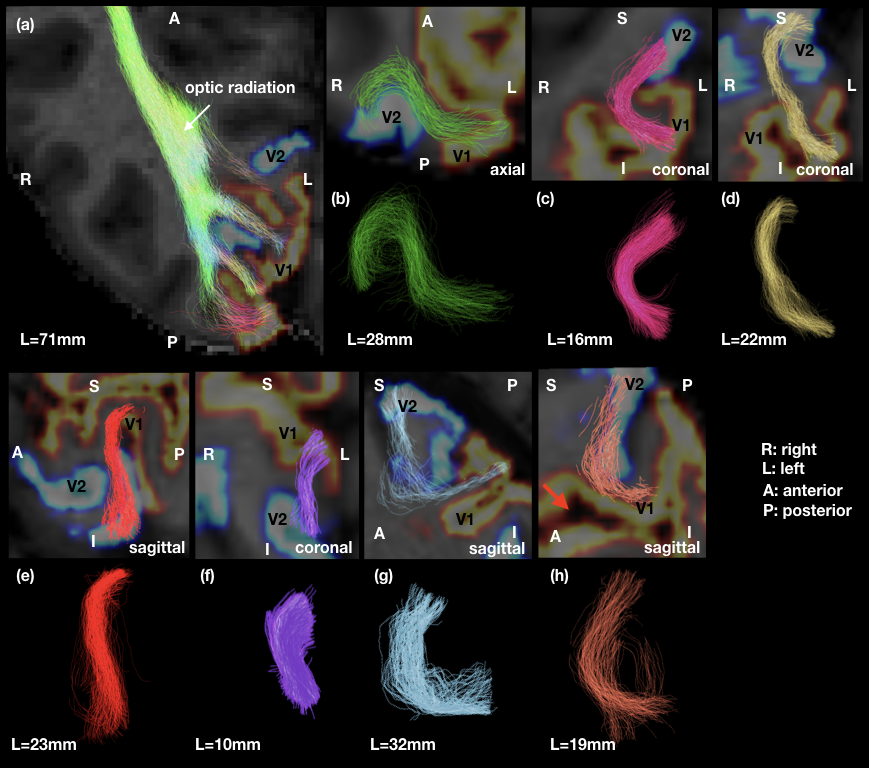
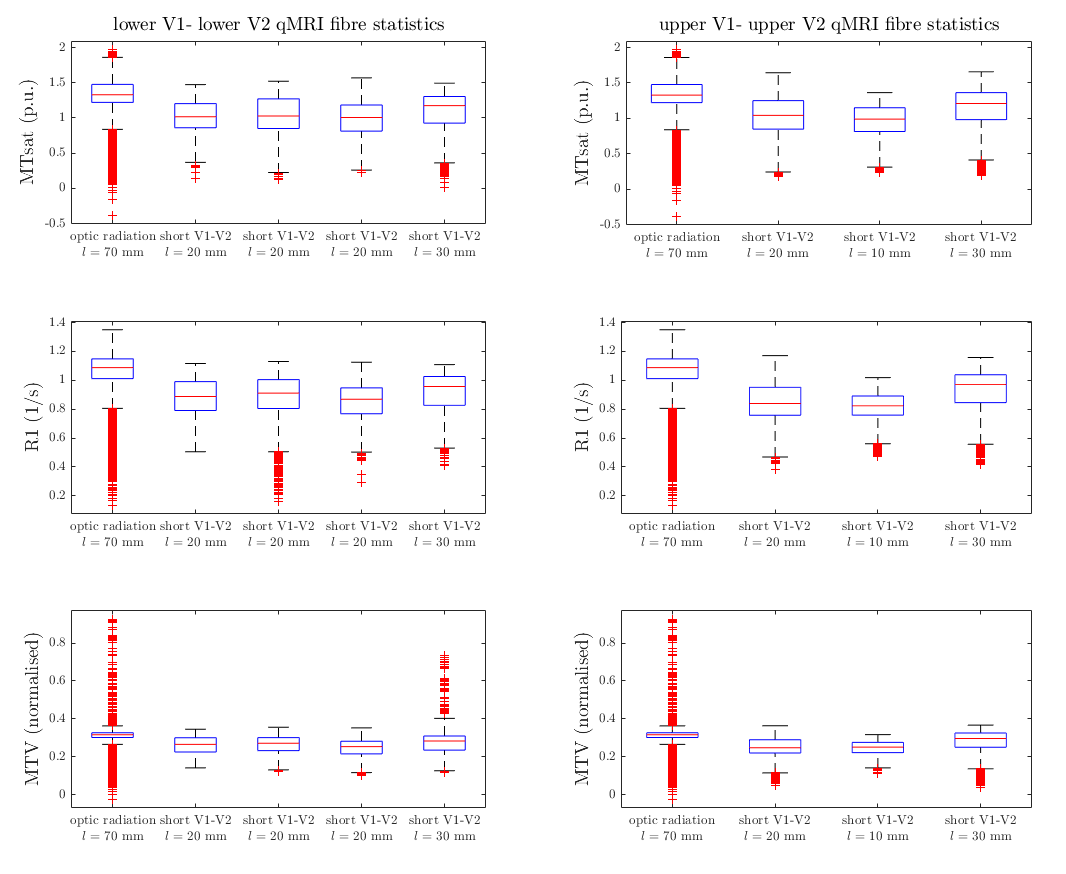
DWI and multiparameter maps (MPM)13 were acquired for a single healthy subject (female, 26) on a 3T Connectom scanner (Siemens Healthineers, Erlangen, Germany; maximum gradient strength 300 mT/m). The subject provided written informed consent in compliance with a protocol approved by the local ethics committee. DWI were acquired using a flexible RF 23-channel receive coil14 for high sensitivity imaging of the occipital cortex15, a single-shot 2D-EPI sequence, 800 μm isotropic resolution, 60 non-collinear whole-sphere distributed diffusion-encoding directions per shell, two shells (b=800, 1800 s/mm2), 15 interleaved b=0, TE/TR 66 ms/8700 ms, Partial Fourier 5/8, readout bandwidth 1200 Hz/Px, acquisition matrix 256 × 106, 62 oblique near-axial slices, AP phase encoding. Two repetitions were acquired. A single b=0 image was recorded with PA phase encoding for distortion correction. Whole-brain MPM were acquired using a 32-channel RF head coil with isotropic resolution 800 μm from which longitudinal relaxation rate (R1), magnetisation transfer saturation (MTsat) and proton density (PD) maps were estimated as MRI-derived myelin markers using the hMRI toolbox (hmri.info). Phase-encoded retinotopic mapping was performed using fMRI with 1mm isotropic resolution on a 7T scanner (Siemens Healthineers, Erlangen, Germany) and representations of lower and upper visual fields in V1/V2 were masked (Figure 1) 16.DWI were preprocessed using an optimized pipeline including noise and Gibbs ringing removal, bias-field intensity correction, gradient non-linearity correction, susceptibility and eddy current- induced distortion correction 17. MPM and fMRI were registered to DWI native space (Figure 2). Fibre orientation density functions (fODF) were computed using unsupervised multi-shell multi-tissue constrained spherical deconvolution (MSMT-CSD)18. Probabilistic streamline tractography was performed with fODF peak and angle thresholds 0.1 and 45°, respectively19-20. The fMRI-derived retinotopic V1/V2 maps were used for V1–V2, V1-V1 and V2-V2 connectivity mapping on both hemispheres (Figure 3). The optic radiation tract was delineated by user-defined ROIs. Average statistics were computed for R1, MTsat and MTVF (1-PD/100) for short V1-V2 connections and the optic radiation.Results
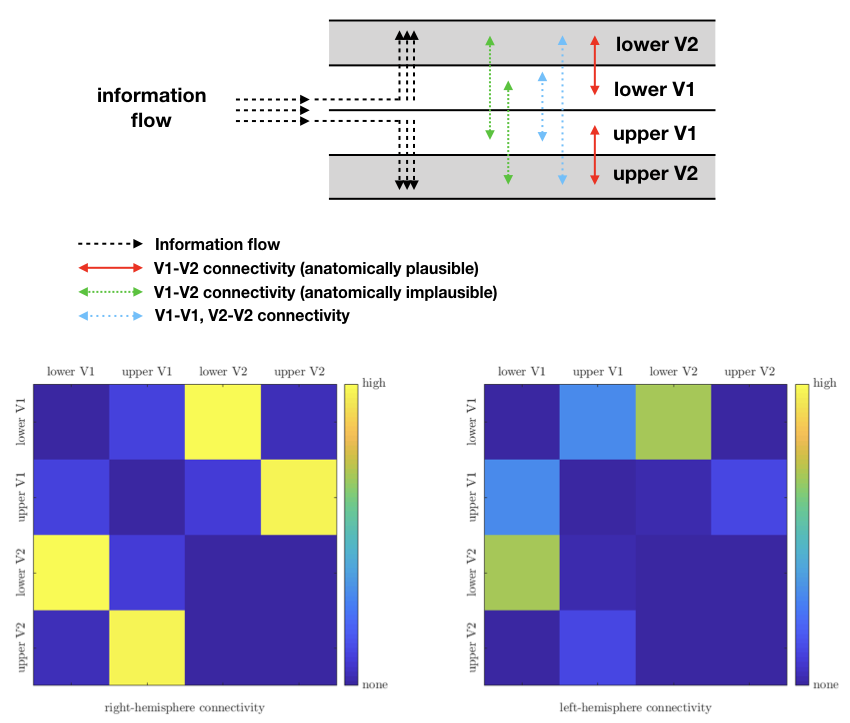
Short fibre mapping in the human visual processing stream was enabled in vivo. High quality DWI were acquired using high performance gradients and high sensitivity RF coils. Optimized registration between anatomical, functional and diffusion images in the native diffusion space facilitated multi-modality analysis (Figure 2). Prominent V1–V2 connections were observed between the upper and lower visual fields. Few connections were observed between upper V1-lower V2 and lower V1-upper V2 visual fields (Figure 4). V1-V1 connections were identified whereas V2-V2 connections were non-existent (Figure 4). Not all short connections were U-shaped, and average lengths varied between 10–30mm (Figures 3). Lower average values of R1, MTsat and MTVF were obtained for short- compared to long-range connections (Figure 5).Discussion and Conclusion
Feasibility of mapping short association fibre connectivity in the human V1–V2 processing stream was demonstrated by combining DWI, MPM and fMRI for the first time. V1–V2 connectivity results are anatomically plausible and follow the pattern of information flow in the human visual stream (Figure 4). Not all connections exhibit strong U shape. Consistent with the known “lower visual field advantage” 8-11, stronger connectivity was found between lower V1 and V2 compared to the upper. We observed lower myelination for short association fibres measured by MRI-derived myelin markers. Our results are an important step towards robust mapping of short association fibers, hence, construction of a more complete MRI-derived human brain connectome.Acknowledgements
The research leading to these results has received funding from the European Research Council under the European Union's Seventh Framework Program (FP7/2007-2013) / ERC grant agreement no. 616905. This project has also received funding from the BMBF (01EW1711A & B) in the framework of ERA-NET NEURON.References
1. Schüz, A. and Braitenberg, V. (2002) ‘The Human Cortical White Matter: Quantitative Aspects of Cortico-Cortical Long-range Connectivity’, in Cortical Areas: Unity and Diversity, pp. 377–385.
2. Song, A. W., Chang, H.-C., Petty, C., Guidon, A. and Chen, N.-K. (2014) ‘Improved Delineation of Short Cortical Association Fibers and Gray/White Matter Boundary Using Whole-Brain Three- Dimensional Diffusion Tensor Imaging at Submillimeter Spatial Resolution’, Brain Connectivity, 4(9), pp. 636–640. doi: 10.1089/brain.2014.0270.
3. Setsompop, K., Kimmlingen, R., Eberlein, E., Witzel, T., Cohen-Adad, J., McNab, J. A., Keil, B., Tisdall, M. D., Hoecht, P., Dietz, P., Cauley, S. F., Tountcheva, V., Matschl, V., Lenz, V. H., Heberlein, K., Potthast, A., Thein, H., Van Horn, J., Toga, A., Schmitt, F., Lehne, D., Rosen, B. R., Wedeen, V. and Wald, L. L. (2013) ‘Pushing the limits of in vivo diffusion MRI for the Human Connectome Project’, NeuroImage. Elsevier B.V., 80, pp. 220–233. doi: 10.1016/j.neuroimage.2013.05.078.
4. Catani, M., Dell’Acqua, F., Vergani, F., Malik, F., Hodge, H., Roy, P., Valabregue, R. and Thiebaut de Schotten, M. (2012) ‘Short frontal lobe connections of the human brain’, Cortex. Elsevier Srl, 48(2), pp. 273–291. doi: 10.1016/j.cortex.2011.12.001.
5. De Santiago Requejo, F. et al., (2017) 'Mapping asymmetries in the U-shape fibre system of the human brain', Proceedings of the Annual Meeting of the Organisation for Human Brain Mapping, OHBM, Vancouver, Canada.
6. Felleman D.J., Van Essen D.C., (1991) 'Distributed hierarchical processing in the primate cerebral cortex.' Cereb Cortex. 1991 Jan-Feb;1(1):1-47.
7. Sachs, H. (1892) ‘Das Hemisphärenmark des menschlichen Grosshirns’, Verlag von Georg Thieme. Edited by H. Sachs.
8. Cameron, E. L., (2005) 'Perceptual inhomogeneities in the upper visual field', Journal of Vision, 5, p. 176aM.W.
9. Levine, M.W., McAnany, J.J., (2005) 'The relative capabilities of the upper and lower visual hemifields', Vision Research, 45 , pp. 2820-2830
10. Levine, M.W., McAnany, J.J. , (2005) 'More ups and downs of visual processing', Journal of Vision, 5, p. 177a
11. Previc, F.H., (1990) 'Functional specialization in the lower and upper visual fields in humans: Its ecological origins and neurophysiological implications', Behavioral and Brain Sciences, 13 , pp. 519-575
12. Edwards, L. J., Kirilina, E., Mohammadi, S. and Weiskopf, N. (2018) ‘Microstructural imaging of human neocortex in vivo’, NeuroImage, 182, pp. 184–206.
13. Weiskopf, N., Suckling, J., Williams, G., Correia, M. M., Inkster, B., Tait, R., Ooi, C., Bullmore, E. T., … Lutti, A. (2013). Quantitative multi-parameter mapping of R1, PD(*), MT, and R2(*) at 3T: a multi-center validation. Frontiers in neuroscience, 7, 95.
14. Frass-Kriegl R., Navarro de Lara L.I., Pichler M., Sieg J., Moser E., Windischberger C., et al. (2018) 'Flexible 23-channel coil array for high-resolution magnetic resonance imaging at 3 Tesla'. PLoS ONE 13(11): e0206963.
15. Kirilina at al., (2018) 'High resolution in vivo diffusion weighted imaging of the human occipital cortex: enabled by 300mT/m gradients and flexible radio-frequency surface coils'. Proceedings of the Annual Meeting of the International Society for Magnetic resonance in Medicine, ISMRM, Paris, France.
16. Haenelt, D. (2018) 'Mapping color-selective columns in V2 across cortical depth using GE-EPI and SE-EPI'. Proceedings of the Annual Meeting of the Organisation for Human Brain Mapping, OHBM, Singapore.
17. Andersson, J. L. R. and Sotiropoulos, S. N. (2016) ‘An integrated approach to correction for off-resonance effects and subject movement in diffusion MR imaging’, NeuroImage. Academic Press, 125, pp. 1063–1078.
18. Dhollander T., Raffelt D., Connelly A., (2016) ‘Unsupervised 3-tissue response function estimation from single-shell or multi-shell diffusion MR data without a co-registered T1 image’, ISMRM Workshop on Breaking the Barriers of Diffusion MRI, 5.
19. Tournier, J. D., Calamante, F., Connelly, A. (2010) ‘Improved probabilistic streamlines tractography by 2nd order integration over fibre orientation distributions’, Proc. Intl. Soc. Mag. Reson. Med. (ISMRM), Volume 18
20. Tournier J. D., Calamante F., Connelly A. (2012) ‘MRtrix: Diffusion tractography in crossing fiber regions’, Int J Imaging Syst Technol, 22(1):53-66
Figures