0167
SUper-REsolution TRACTography (SURE-TRACT) pipeline using self-similarity between diffusional and anatomical images1Center for Biomedical Imaging, New York University School of Medicine, New York, NY, United States, 2Center for Advanced Imaging Innovation and Research (CAI2R), New York University School of Medicine, New York, NY, United States
Synopsis
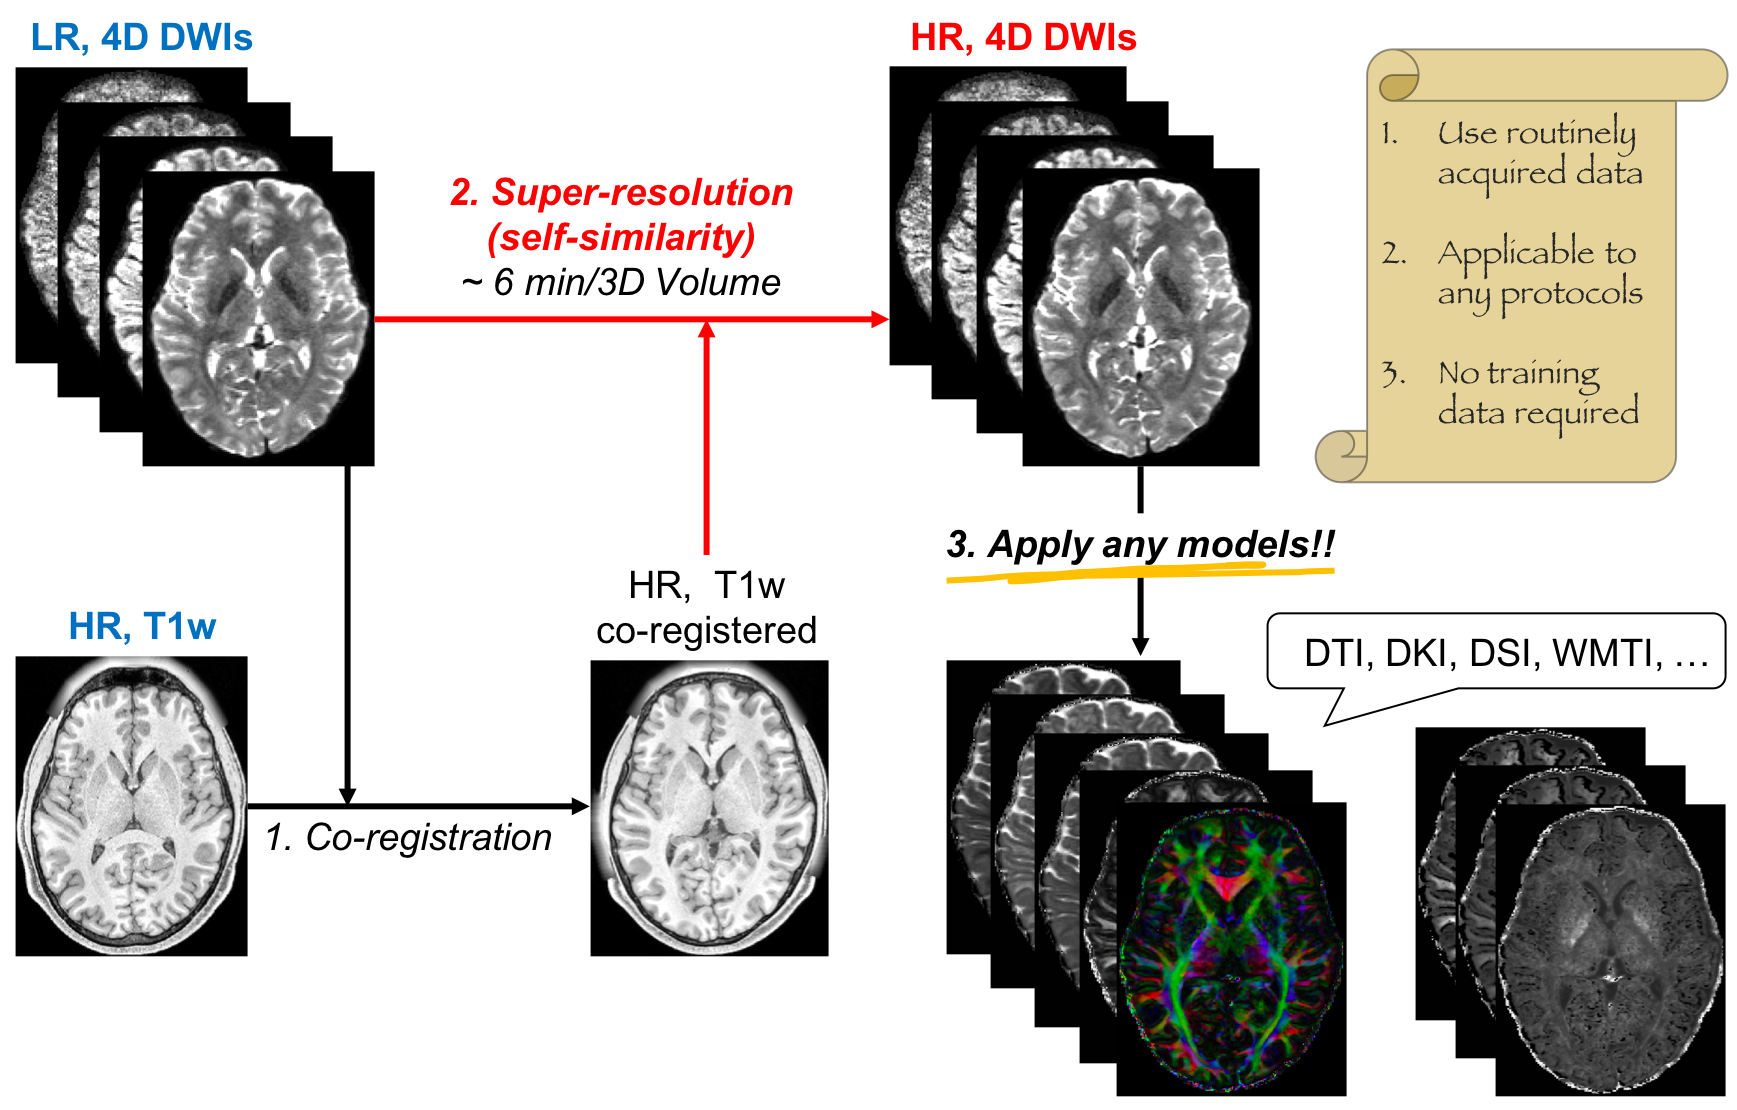
Here, we propose a model-free, self-similarity based SUper-REsolution TRACTography (SURE-TRACT) pipeline to increase the resolution of diffusion weighted images (DWIs) by translating the high spatial frequency details from the co-registered high-resolution anatomical image of the same subject. The generated high-resolution DWIs enable to identify fiber tracks and estimate biophysical parameters with greater anatomical detail. Validating our pipeline using Human Connectome Project data, we showed that the SURE-TRACT pipeline resolves partial volume effects, and is more flexible to different acquisition protocols than other recent machine-learning based algorithms.
Purpose
To increase the resolution of diffusion weighted images (DWIs) using routinely acquired data, we proposed a model-free SUper-REsolution TRACTography (SURE-TRACT) pipeline to translate high spatial frequency details from the co-registered high-resolution anatomical image (e.g., T$$$_1$$$-weighted (T1w) image) into low-resolution DWIs of the same subject. We up-sampled DWIs by applying a local averaging kernel defined by the self-similarity [1] between T1w image and DWI. Validating our pipeline using Human Connectome Project (HCP) data, we demonstrated that our pipeline resolves partial volume effects [2] and enables to identify fiber tracks and estimate biophysical parameters [3-4] in greater anatomical detail. Our pipeline boosts the resolution of DWIs without the needs of special acquisition and reconstruction protocols [5-7] or training data and model-specific features [8], and thus provides the best flexibility for applications of diffusion MRI.Methods
$$$\rm\bf{Pipeline}$$$
As illustrated in Fig.1, we linearly interpolated low-resolution DWIs to double its matrix size as the initial input, and registered the high-resolution T1w image to the same space. Further, for each DWI voxel, we calculated normalized weights in a sliding window (5×5×5-kernel) $$$\Omega$$$ and applied the local weighted sum as the intensity of the high-resolution DWI. The weights, $$$w_{ij}^t$$$ between the $$$i$$$-th and $$$j$$$-th voxels in the vicinity/kernel, were estimated based on the self-similarity between DWI patches $$$N(x_i^t)$$$ (3×3×3 in size) for the $$$t$$$-th iteration and T1w image voxels $$$z_i$$$ [1]:
$$w_{ij}^t=e^{-(z_i-z_j)^2/h^2}\cdot\,e^{-\|N(x_i^t)-N(x_j^t)\|^2/kh^2}\,,\quad\quad(1)$$
where hyper-parameter $$$h$$$ decreases with iterations and $$$k$$$ is fixed; their values are scaled based on maximal signals of DWIs and T1w images. The high-resolution DWI in the ($$$t$$$+1)-th iteration, $$$x_i^{t+1}$$$, is then estimated by [1]
$$x_i^{t+1}=\frac{1}{C_i}\sum_{\forall{}j\in\Omega}x_j^t\cdot{}w_{ij}^t\,,\quad\quad(2)$$
with the normalization factor $$$C_i$$$.
To stabilize the high-resolution estimate, we imposed a constraint that the down-sampled image of the high-resolution estimate needs to be consistent with the original low-resolution data $$$y$$$ [1]:
$$x_i^{t+1}=x_i^{t+1}-NN(DHx_i^{t+1}-y)\,,\quad\quad(3)$$
where $$$DH$$$ is the "box" kernel for the down-sampling, and $$$NN$$$ is the nearest-neighbor interpolation to up-sample the residual.
The super-resolution process in Eqs.(1-3) was iterated over six different $$$h$$$ values.
$$$\rm\bf{MRI}$$$
The HCP young adult 1200 subjects data includes 3T MRI data [2]: T1w image in (0.7mm)$$$^3$$$ isotropic resolution, and dMRI data in (1.25mm)$$$^3$$$ isotropic resolution, with 6b=0 images and 90DWIs for 3 shells of b-value=1000,2000,3000s/mm$$$^2$$$ (18b=0 images+270DWIs in total). Here, we used the "100206" subject data to validate and demonstrate our pipeline. Furthermore, we compared our pipeline with the classic linear interpolation and the recent machine-learning based DTI-specific image-quality-transfer (IQT) algorithm [8] with the weights pre-trained using HCP data.
$$$\rm\bf{Validation}$$$
We down-sampled the original DWIs by a factor of 2, and used them as the input of our pipeline, linear interpolation, and IQT. The original DWIs serve as the ground truth to be compared with the outputs. The final output of our pipeline and linear interpolation include high-resolution DWIs, DTI metrics (mean/axial/radial diffusivity (MD/AD/RD), fractional anisotropy (FA), direction-encoded color (DEC)) [3], DKI metrics (mean/axial/radial kurtosis (MK/AK/RK)) [4], and orientation distribution function (ODF). The output of IQT includes DTI metrics and diffusion-tensor ellipsoid.
After validation, we applied our pipeline to the original data, and produced high-resolution diffusional metrics and fiber tracts in a (0.625mm)$$$^3$$$ voxel size.
The effective resolution translated from T1w image by our pipeline is ~(0.7mm)$$$^3$$$. The calculation time is 6min per 3D volume.
Results
For validation, DEC maps (Fig.2) calculated by IQT and our pipeline are both consistent with the ground truth, with more details in fine tracts than the linear interpolation. DTI metrics (Fig.3) estimated by IQT and our pipeline are both comparable to the ground truth. Similarly, DKI metrics (Fig.3) estimated by our pipeline agree with the ground truth, whereas the DTI-based IQT provides no information in higher order terms.
Further, ODF results for the validation data (Fig.4) show that linear interpolation and IQT are vulnerable to partial volume effects, e.g., in crossing fiber regions. In contrast, our pipeline has smaller partial volume effect and is comparable to the ground truth.
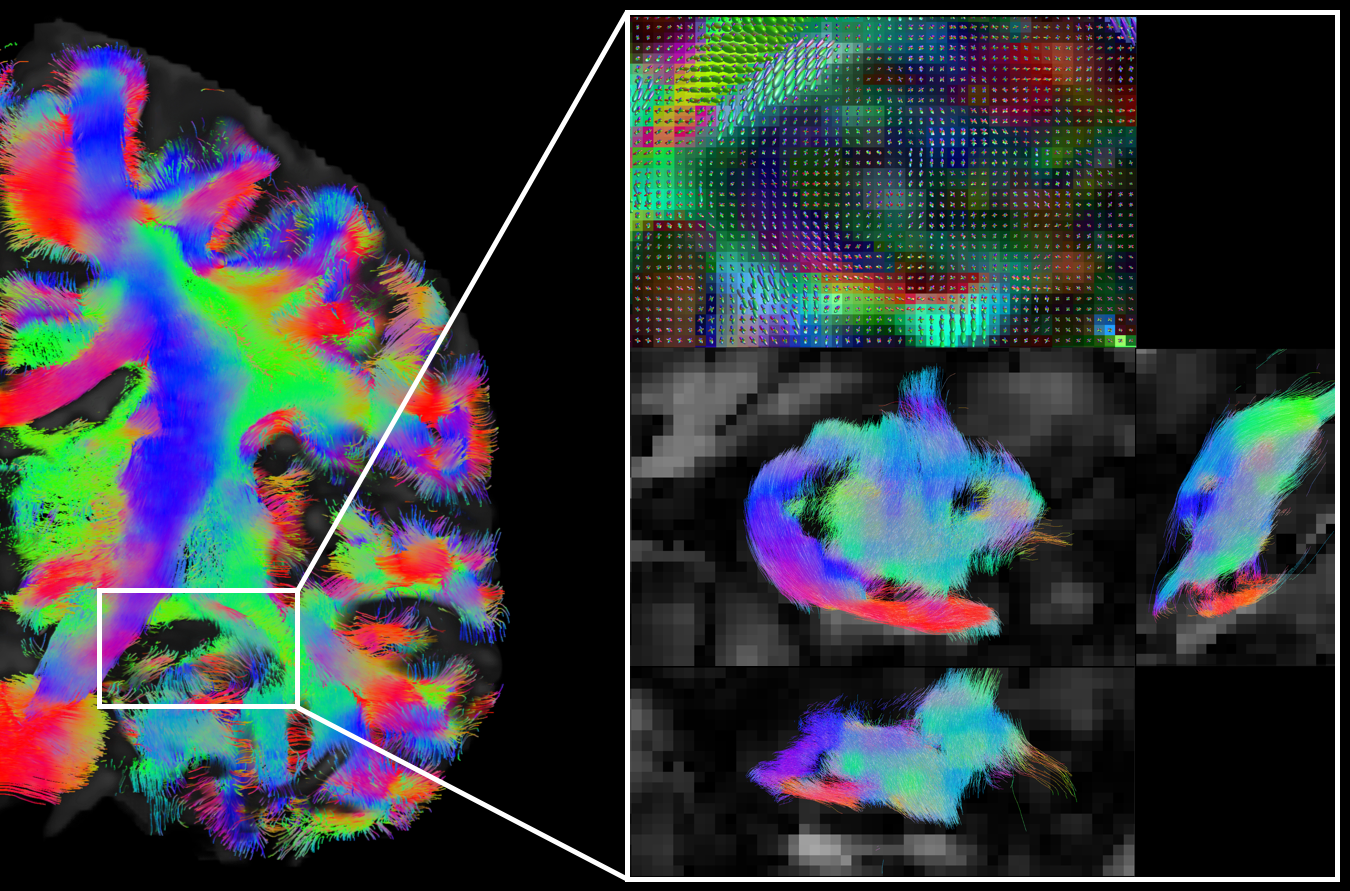
Finally, the very high-resolution DWIs generated by our pipeline show that, benefitting from high-resolution details in DWIs, we can delineate tracts details in small anatomical structures, such as hippocampus (Fig.5 white box).
Discussion and Conclusions
Using routinely acquired data, our pipeline boosts the resolution of DWIs by a factor of 2, and, at the same time, provides reliable estimates of diffusion metrics and fine details in fiber tracts. Furthermore, our pipeline is compatible to any dMRI acquisition protocols, and is applicable to all kinds of dMRI models. Compared with recent machine-learning based methods, our pipeline is more flexible to various applications with no training data required. With better implementations of denoising and parallel computations, we can further improve the performance and the computational efficiency of our pipeline.
Acknowledgements
Research was supported by the National Institute of Neurological Disorders and Stroke of the NIH under award number R21 NS081230 and R01 NS088040 and in part by PHS grants R01 CA111996, R01 NS082436 and R01 MH00380, and was performed at the Center of Advanced Imaging Innovation and Research (CAI2R, www.cai2r.net), an NIBIB Biomedical Technology Resource Center (NIH P41 EB017183).
Data were provided by the Human Connectome Project, WU-Minn Consortium (Principal Investigators: David Van Essen and Kamil Ugurbil; 1U54MH091657) funded by the 16 NIH Institutes and Centers that support the NIH Blueprint for Neuroscience Research; and by the McDonnell Center for Systems Neuroscience at Washington University.
References
1. Manjón, José V., et al. "MRI superresolution using self-similarity and image priors." Journal of Biomedical Imaging2010 (2010): 17.
2. Van Essen, D.C., Ugurbil, K., 2012. The future of the human connectome. NeuroImage 62, 1299-1310.
3. Basser, Peter J., James Mattiello, and Denis LeBihan. "MR diffusion tensor spectroscopy and imaging." Biophysical journal 66.1 (1994): 259-267.
4. Jensen, Jens H., et al. "Diffusional kurtosis imaging: the quantification of non‐gaussian water diffusion by means of magnetic resonance imaging." Magnetic Resonance in Medicine: An Official Journal of the International Society for Magnetic Resonance in Medicine 53.6 (2005): 1432-1440.
5. McNab, Jennifer A., Daniel Gallichan, and Karla L. Miller. "3D steady‐state diffusion‐weighted imaging with trajectory using radially batched internal navigator echoes (TURBINE)." Magnetic Resonance in Medicine: An Official Journal of the International Society for Magnetic Resonance in Medicine 63.1 (2010): 235-242.
6. Chen, Nan-kuei, et al. "A robust multi-shot scan strategy for high-resolution diffusion weighted MRI enabled by multiplexed sensitivity-encoding (MUSE)." Neuroimage 72 (2013): 41-47.
7. Dai, Erpeng, et al. "Simultaneous multislice accelerated interleaved EPI DWI using generalized blipped‐CAIPI acquisition and 3D K‐space reconstruction." Magnetic resonance in medicine 77.4 (2017): 1593-1605.
8. Alexander, Daniel C., et al. "Image quality transfer and applications in diffusion MRI." Neuroimage 152 (2017): 283-298.
Figures